In this ‘Data Analysis’ project, we’ll analyze a global Pharmaceutical Manufacturing Company's raw sales data and draw meaningful insights.

⚡PowerBI Desktop
⚡PowerQuery Editor [For data-transformation/data-modeling]
⚡PowerBI Service [For making the report accessible on the web without PowerBI login]
⚡Multipage fully Interactive Report [For drawing insights and analysis]
Datamatrix-ml Pharmaceuticalsis one of the leading Pharmaceutical Manufacturing companies with a global presence.- Their Markets are divided into different regions across the world. One of those regions manages the German and Poland Markets.
- Company does not sell directly to customers. Instead, they work with a couple of Distributors in all their regions.
- They have an agreement with each distributor to share their Sales Data. This is to enable them to gain insights up to the retail level. This data is made available to them in CSV format.
The firm has asked us to perform in-depth data analysis to get insight into company sales performance. Specifically, below are the essential requirements to be satisfied…
| Requirement ID | For Whom | Requirement Description |
|---|---|---|
| DM-DA01-REQ-1 | Executive Committee | A high-level overview showing company’s overall sales performance by yearbymonth,bycustomer cities,bychannel,bysub-channel .Should be able to quickly see top drug class by sales, top drug by sales, top customer city by sales` |
| DM-DA01-REQ-2 | Sales Manager/Sales Rep | A detailed overview showing sales by distributors and product, top 5 product, customer and cities, sales numbers split by channels and sub-channels. |
| DM-DA01-REQ-3 | Head of Sales | A detailed report of sales by sales-team split by product and sales by sales-team split by product class. A detailed analysis showing Top sales managers, Top sales reps, Top product split by sales team contributions answering. An ability to filter/slice data by year and months. |
Table-1 : Requirements
The dataset is sourced from each distributor. It contains Pharmaceutical Manufacturing Company’s, Wholesale-Retail Data. The field description of the raw data is given below. The raw dataset pharma-data.csv can be downloaded from here
| Field | Description |
|---|---|
| Distributor | Name of Wholesaler |
| Customer Name | Name of customer |
| City | Customer's city |
| Country | Customer's country |
| Latitude | Customer's Geo Latitude |
| Longitude | Customer's Geo Longitude |
| Channel | Class of buyer (Hospital, Pharmacy) |
| Sub-channel | Sector of the buyer (Government, Private, etc.) |
| Product Name | Name of Drug |
| Product Class | Class of Drug (Antibiotics, etc.) |
| Quantity | Quantity purchased |
| Price | Price product was sold for |
| Sales | Amount made from sale |
| Month | Month sale was made |
| Year | Year sale was made |
| Name of Sales Rep | Name of the Sales rep who facilitated the sale |
| Manager | Sales rep's Manager Name |
| Sales Team | Sale rep's team |
| Table-2 : Data Definition |
| Requirement ID | Solution ID | Proposed Solution |
|---|---|---|
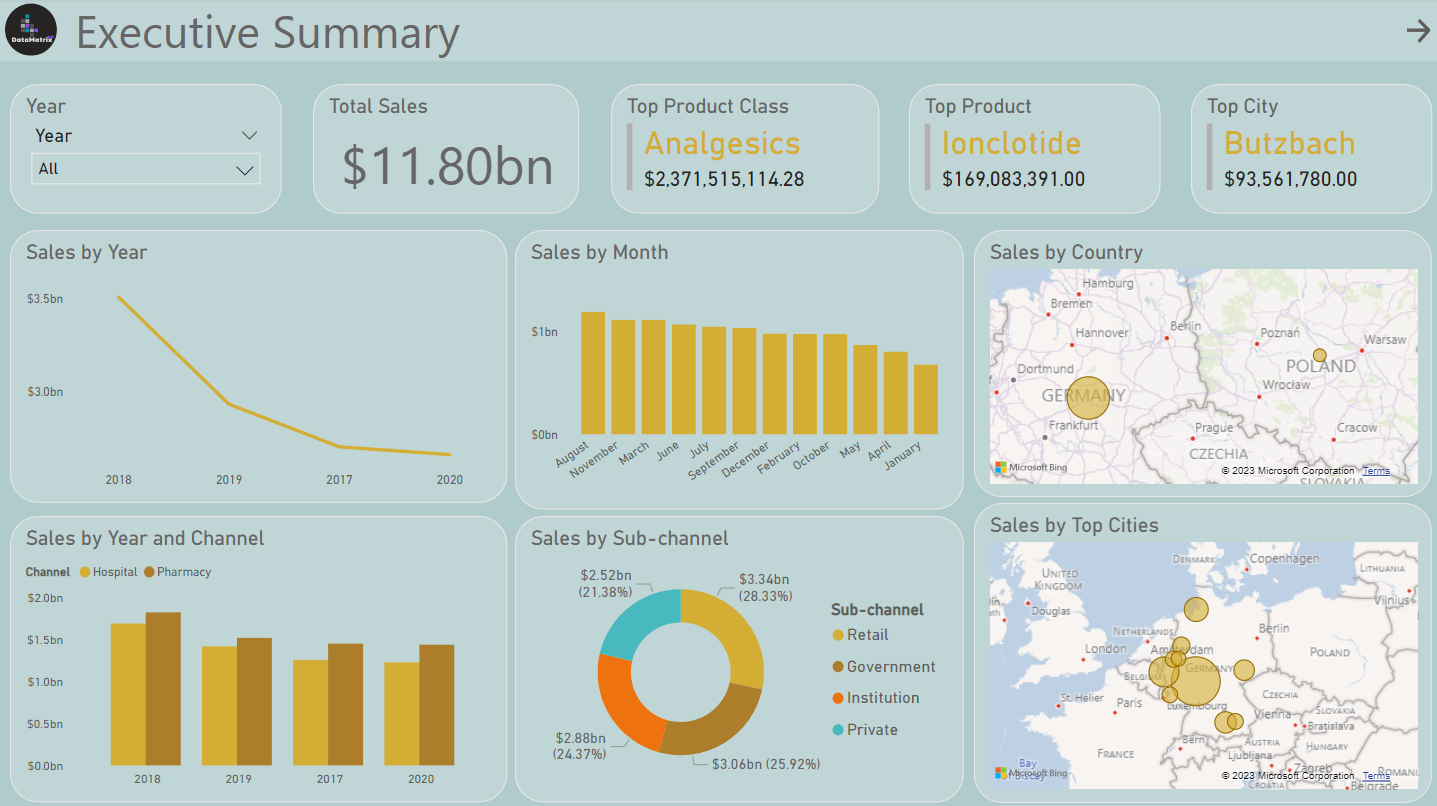
| DM-DA01-REQ-1 | DM-DA01-SOL-1 | An Executive Summary PowerBI dashboard/report page will be built to show a high-level overview of sales data in interactive visuals per the requirements. A year filter will be provided to filter the data by a particular or combination of years |
| DM-DA01-REQ-2 | DM-DA01-SOL-2 | A Distributor & Customer Analysis PowerBI dashboard/report page will be provided with interactive visuals showing data as per the requirement |
| DM-DA01-REQ-3 | DM-DA01-SOL-3 | A Sales Team Performance PowerBI dashboard/report page will be provided with interactive visuals showing data as per the requirement. year and month slicers will be provided to slice/filter data by year and/or months |
Table-3 : Proposed Solution
To understand, be familiar with and check the sanity of the given data, the first step is EDA. This project's initial data exploration has been carried out using the pandas python package. Here, in general, we are checking...
- Presence of any missing values
- Any unusual value (outliers)
- Incorrect values (e.g., sales column, we see -ve numbers)
- Determine
categoricalandnumericcolumns - Determine dimensions of categorical columns and range of numeric columns
Note that these steps can be performed using
PowerQuery Editorand/or excel; however,pandasmakes it much easier and faster; on top of that,pandascan handle massive datasets.
EDA steps can be found in the data-exploration.ipynb notebook.
The provided dataset was relatively clean and well organized; hence only a little work was required in this step; the following steps were carried out...
- Correct column heading provided
- Correct data type is assigned to columns
- The provided data is in a single table format. The exploration revealed that it contains both categorical (
dimensions) and numeric (facts) data. - We build a data model where dimensions and facts are separated, then they are linked together by logical relationship to form a
star schema.The resultant data model is shown below...
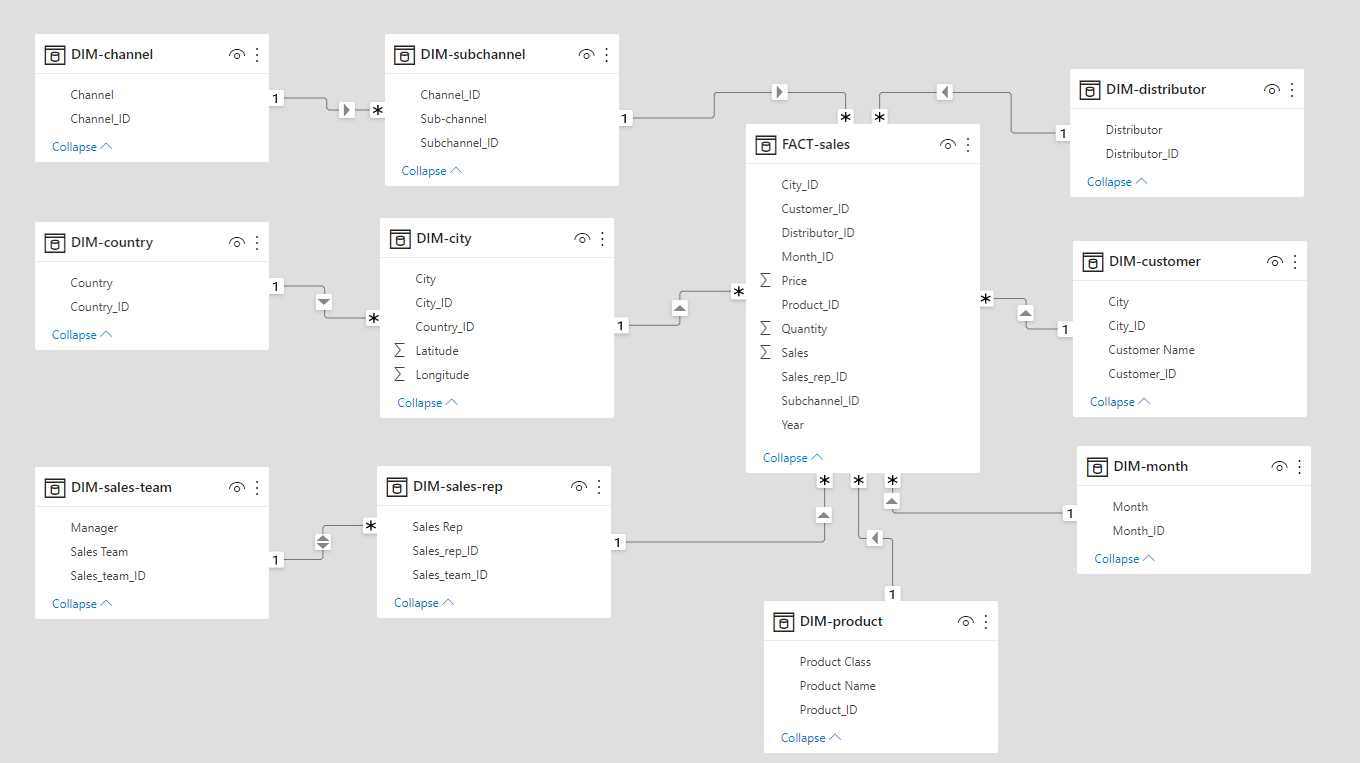
The tables with the prefix DIM are dimension tables, and FACT is the fact table.
Three interactive reports/dashboards (report pages) will be created to implement the proposed solution. Refer to Table-3: Proposed Solution for detailed requirements and the corresponding proposed solution.
This high-level report shows the overall sales figures and elements at a glance.
This more granular detailed report analyses data from the company distributors' and customers' perspectives. Sales by the distributor can be drilled down to specific product levels.

This is another detailed report that analyses the performance of the company's sales team. Sales by the sales team can be drilled down to product class and specific product levels.

Explore the fully functional report with native PowerBI interactive experience.
If you have PowerBI desktop installed, download the pharma-analysis.pbix from the repo and open it using PowerBI desktop. There is no need to download the raw dataset; the pbix files contain the complete normalized data model, feel free to modify and experiment with it.
- Dataset sourced from Foresight BI


