Git Product home page Git Product logo

socnetv / app Goto Github PK

View Code? Open in Web Editor NEW
189.0 6.0 26.0 22.35 MB

Social Network Analysis and Visualization software application.

Home Page: https://socnetv.org

License: Other

QMake 0.25% C++ 98.90% Inno Setup 0.17% Shell 0.68%
centrality network-analysis network-visualization social-network-analysis eigenvector-centrality structural-analysis random-graphs hierarchical-clustering kamada-kawai community-detection-algorithms

app's Introduction

version Travis (.com) branch appveyor langs downloads license website

socnetv SocNetV - Social Network Visualizer

1. Overview

Social Network Visualizer (SocNetV) is a cross-platform, user-friendly free software application for social network analysis and visualization.

With SocNetV you can:

  • Draw social networks with a few clicks on a virtual canvas, load your field data from a file in a supported format (GraphML, GraphViz, EdgeList, GML, Adjacency, Edgelist, Pajek, UCINET, etc.), automatically recreate famous data sets or crawl the internet to create a social network of connected webpages.

  • Edit actors and ties through point-and-click, analyse graph and social network properties, produce beautiful HTML reports and embed visualization layouts to the network.

socnetv

2. Features

  • Standard graph-theoretic and network cohesion metrics, such as density, diameter, geodesics and distances, connectedness, eccentricity, clustering coefficient, walks, reciprocity etc.

  • Matrix routines: Adjacency plot, Laplacian matrix, Degree matrix, Cocitation, etc.

  • Advanced structural measures for social network analysis such as centrality and prestige indices (i.e. eigenvector and closeness centrality, betweenness centrality, information centrality, power centrality, proximity and pagerank prestige),

  • Community detection algorithms such as triad census, clique census, etc.

  • Structural equivalence analysis, using hierarchical clustering, actor similarities and tie profile dissimilarities, pearson coefficients, etc.

  • Random network creation, i.e. Erdos-Renyi, Watts-Strogatz, scale-free, lattice, etc.

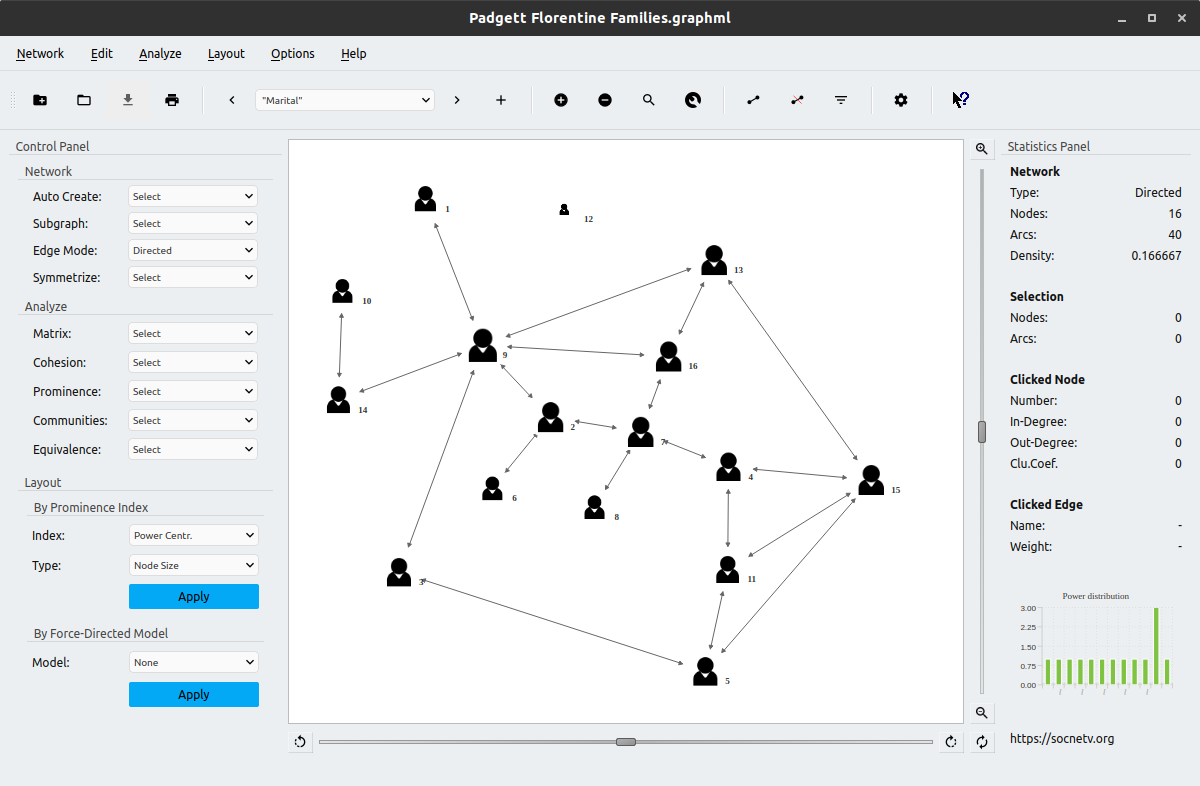
  • One-click recreation of well-known social network datasets such as Padgett's Florentine families.

  • Layout algorithms based on either prominence indices (i.e. circular, level and nodal sizes by centrality score) or force-directed models (i.e. Kamada-Kawai, Fruchterman-Reingold, etc) for meaningful visualizations of your social network data.

  • Multirelational loading and editing. You can load a network consisting of multiple relations or create a network on your own and add multiple relations to it.

  • Built-in web crawler allowing you to automatically create networks from links found in a given initial URL.

  • Comprehensive documentation both online and while running the application explaining each feature and algorithm of SocNetV in detail.

  • Binary packages and installers for Windows, Linux and macOS.

3. Availability & License

Official Website: https://socnetv.org Email: [email protected]

Author: Dimitris V. Kalamaras Blog: https://dimitris.apeiro.gr

SocNetV is a cross-platform application developed in C++ and Qt, an open source software development platform published under the GPL.

This means you can compile and run SocNetV on any Operating System supported by Qt. See available packages and installation instructions below.

SocNetV is Free Software, distributed under the General Public Licence Version 3 (see the COPYING file for details). The documentation is also Free, licensed under the Free Documentation License (FDL).

The application is not a "finished" product. Therefore, there is no warranty of efficiency, correctness or usability.

Nevertheless, we are looking forward to help you if you experience any problems with SocNetV! See bug reporting below.

4. Installation

SocNetV is multi-platform, which means that it can be installed and run in every Operating System supported by the Qt toolkit.

The project offers binaries and installers for the three major Operating Systems: Windows, macOS and Linux.

If there is no binary package for your OS, please download and compile the source code, as explained further below.

a) Install a binary package or installer (Linux/macOS/Windows)

You can download an installer or a binary package for your Operating System from the project's Downloads page: https://socnetv.org/downloads

Follow the instructions below to install it in your system.

Install in Windows

To install SocNetV in Windows, download the latest SocNetV Windows installer from the Downloads page, and double-click on the executable to start the installation.

Note: You might see a Windows pop up about unknown software origin/publisher. Please ignore it and proceed, as we do not sign our released packages with any code signing certificates (which are not free by the way).

Click Next and Accept the License (GPL) to install the program.

The program will be installed in the usual Windows Program Files directory and a new Start Menu shortcut will be created.

Afterwards you can run the application from your Start menu.

Install in macOS

To install SocNetV in macOS, download the latest SocNetV macOS package from the Downloads page. Then right-click on it and select Open.

If the package is an installer, the installation will start immediately and the application will be installed automatically in your Applications.

Otherwise, if the package is just an macOS image disk (a file with a .dmg extension), then double-click on it to open it. You will see a new window with the SocNetV executable icon inside. Right-click on it and select Open to run the application.

Note: The first time you will run SocNetV, macOS may tell you that it cannot verify the software developer/publisher. That's because we do not sign our released packages with any code signing certificates (which are not free by the way). Please press Cancel, not Move to Bin! Then, right-click again on SocNetV app and select Open to run the application normally.

After that, in order to permanently install SocNetV in your macOS, you can simply drag the SocNetV executable icon into your Applications.

Install in Linux

To run the latest and greatest version of SocNetV in Linux, download the latest Linux AppImage from the project's Downloads page.

Then, make the .appimage file executable and double-click on it to run SocNetV. That's it. :)

Please note that SocNetV is also available in the repositories of most Linux distributions. However that is not always the most recent version. We urge you to use the AppImage of the latest version available from our website instead.

Also, users of openSUSE, Fedora and Ubuntu/Debian can install SocNetV from our own repositories.

In Debian and Ubuntu, add our repository and install SocNetV with these commands:

sudo add-apt-repository ppa:dimitris-kalamaras/ppa
sudo apt-get update
sudo apt-get install socnetv

In Fedora and openSUSE, choose and add the correct repository for your distro version from here: https://software.opensuse.org/download.html?project=home%3Aoxy86&package=socnetv

Once you add the repo, install SocNetV using the command (Fedora):

sudo yum install socnetv

or (openSUSE):

sudo zypper in socnetv

b) Compile from Source Code

To compile and install SocNetV from source you need the Qt toolkit development libraries, version 6.

Qt is an open source C++ toolkit, for Windows, Linux and MacOS.

Windows and MacOS users should download and install Qt6 from https://www.qt.io/developers

Linux users need to install the following packages:

openSUSE: libqt6-qtbase, libqt6-qtbase-devel, libQt6Charts6-devel, qt6-tools

Fedora: qt6-qtbase, qt6-qtbase-devel, qt6-qtcharts-devel, qt6-linguist, qt6-qt5compat

Debian: qt6-base-dev, qt6-base-dev-tools, qt6-charts-dev, qt6-svg-dev, qt6-5compat-dev, libqt6opengl6-dev

Once you have Qt installed, you are ready to compile SocNetV from source.

Download the archive with the source code of the latest version from https://github.com/socnetv/app/releases/latest. You will get a compressed file like app-3.0.tar.gz

Then type in the following commands in order to decompress the SocNetV tarball and build it. Replace 3.X with the version you downloaded.

untar zxfv app-3.X.tar.gz
cd app-3.X
qmake
make
sudo make install # or su -c 'make install'

Probably you have already done the first 2 steps, so just type in 'qmake' or 'qmake-qt6'.

When you finish compiling and installing, run the application typing:

socnetv

or go to Start Menu > Mathematics > SocNetV.

5. Command Line Options

SocNetV is primarily a GUI program. Nevertheless, some command line options are available:

Options:
  -h, --help           Displays this help.
  -v, --version        Displays version information.
  -p, --progress       Force showing progress dialogs/bars during computations.
  --nm, --notmaximized Do not show the app maximized.
  -f, --fullscreen     Show in full screen mode.
  -d, --debug <level>  Print debug messages to stdout/console. Available
                       verbosity <level>s: 'none', 'min' or 'full'. Default:
                       'min'.

Arguments:
  file                 Network file to load on startup. You can load a network
                       from a file using `socnetv file.net` where
                       file.net/csv/dot/graphml must be of valid format. See
                       README.

For example, type:

./socnetv net.graphml

to start SocNetV and immediately load network file named 'net.graphml' (in current folder).

6. Usage & documentation

To help you work with the application, there are tooltips and What's This help messages inside the application, when running SocNetV.

To see the full documentation, press F1. It will open a browser window with the SocNetV Manual, which is available online at the project's website: https://socnetv.org/documentation/

7. Bug reporting & contact

If you have a bug report or a feature request, please file it in our GitHub issue tracker: https://github.com/socnetv/app/issues

To contact us directly, send an email to: [email protected]

app's People

Contributors

adriaaah avatar oxy86 avatar probonopd avatar

Stargazers

 avatar  avatar  avatar  avatar  avatar  avatar  avatar  avatar  avatar  avatar  avatar  avatar  avatar  avatar  avatar  avatar  avatar  avatar  avatar  avatar  avatar  avatar  avatar  avatar  avatar  avatar  avatar  avatar  avatar  avatar  avatar  avatar  avatar  avatar  avatar  avatar  avatar  avatar  avatar  avatar  avatar  avatar  avatar  avatar  avatar  avatar  avatar  avatar  avatar  avatar  avatar  avatar  avatar  avatar  avatar  avatar  avatar  avatar  avatar  avatar  avatar  avatar  avatar  avatar  avatar  avatar  avatar  avatar  avatar  avatar  avatar  avatar  avatar  avatar  avatar  avatar  avatar  avatar  avatar  avatar  avatar  avatar  avatar  avatar  avatar  avatar  avatar  avatar  avatar  avatar  avatar  avatar  avatar  avatar  avatar  avatar  avatar  avatar  avatar  avatar

Watchers

 avatar  avatar  avatar  avatar  avatar  avatar

app's Issues

Wrong variance value in clustering coefficient (in repeated computations)

Due to a variable not initialized as it should be, the Variance computed by the clustering coefficient algorithm is correct only on the first computation.
When the user executes the algorithm repeatedly, the variance is not initialized again thus the algorithm reports increasing and wrong variance values.

IDEA: Display current selected layout

When the user selects/embeds a layout model in the network, SocNetV does the work but it does not display anywhere the layout name somewhere. Thus there is no way for the user to remember later what layout she has applied.
SocNetV should display current layout somewhere, either in a new text box or on the canvas.

Eccentricity scores should be infinite when isolated actors exist

When isolated actors exist in a network (and are not disabled) the Eccentricity (max geodesic distance to all other actors) of each actor is by default infinite.
The Eccentricity Report states that fact although it reports non-inf scores for all other actors (except the isolated) as if the isolated one was disabled by the user. This is misleading.

TODO: Graph Reciprocity metric

SocNetV needs to support the Graph Reciprocity metric.
In plain words, the reciprocity of a graph is the fraction of reciprocal edges over all edges of it.

To be more exact, SocNetV should support both Arc and Dyad Reciprocity measures:

  • The arc reciprocity is the fraction of reciprocated ties over all present ties of the graph.
  • The dyad reciprocity is the fraction of actor pairs that have reciprocated ties over all connected.

References:
https://en.wikipedia.org/wiki/Reciprocity_(network_science)
https://reference.wolfram.com/language/ref/GraphReciprocity.html
http://www.analytictech.com/ucinet/help/hs4345.htm

Feature Request: Bonacich Power Centrality

SocNetV should implement Bonacich Power Centrality BPC (alpha,beta) (not to be confused with the already implemented Power Centrality (PC), a generalized degree centrality measure suggested by Gil and Schmidt).

See references
Bonacich, P. (1972). “Factoring and Weighting Approaches to Status Scores and Clique Identification.” Journal of Mathematical Sociology, 2, 113-120.

Bonacich, P. (1987). “Power and Centrality: A Family of Measures.” American Journal of Sociology, 92, 1170-1182.

Proper progress dialogs

At the moment, progress dialogs are not intuitive and do not always show the exact progress the app has made in the algorithm it executes. SocNetV should have proper progress dialogs, each one of them depicting the process of each one algorithm.

New feature: Add text anywhere on the canvas

It would be nice if the user could add arbitrary text anywhere on the canvas.
The text (multi-line or not) could act as remarks/notes of the user on various parts of the network.

Wrong GDC computation

Due to a typo in computing Group Degree Centralisation (versions prior to 2.2), the GDC score of a network was always reported to be divided by N-1.

"Cancel" in Progress dialogs does not work

SocNetV uses qprogressdialogs to inform the user about the progress of a running algorithm/job.
These dialogs have a Cancel button to cancel the job, but pressing it does really nothing leaving the frustrated user waiting for the job to finish.

TODO: Network connectivity metric

SocNetV should compute Network Connectivity.
This is the number of nodes that would have to be removed in order for one actor to no longer be able to reach another. If there are many different pathways that connect two actors, they have high "connectivity" in the sense that there are multiple ways for a signal to reach from one to the other.

SocNetV causes logs in syslog

SocNetV 2.2 for Linux writes a lot of characters (megabytes) into /var/log/syslog when doing an analysis.
But I'm not sure how to reproduce it.

I find this in syslog:
Mar 8 21:43:15 mymachine compiz[2985]: x x x x x x x x x x x x x x x x x x x x x x x x x x x x x x x x x x x x x x x x x x x x x x x x x x x x x x x x x x x x x x x x x x x x x x x x x x x x x x x x x x x x x x x x x x x x x x x x x x x x x x x x x x x x x x x x x x x x x x x x x x x x x x x x x x x x x x x x x x x x x x x x x x x x x x x x x x x x x x x x x x x x x x x x x x x

TODO: Enhanced web crawler

SocNetV has a built-in web crawler, which atm is very simplistic and produces something like ego-social networks:
It scans a 'source' node/webpage for "a href" links to other webpages (which become nodes in the social network) and then visit and scan every one of these other webpages for href links to other pages and so on.

ATM, the only option provided to user is whether the crawler should scan only internal urls (pages in the same domain), external urls (pages in other domains) or both.

The crawler should be enhanced with useful options such as:

  • domains whitelist: allow the user to indicate which domains should be scanned.
  • domains blacklist: allow the user to exclude some domains in bulk.

Two-mode sociomatrix is imported as acquaintance net

  1. Create a .2sm file with the Davis, Gardner and Gardner dataset

1 1 1 1 1 1 0 1 1 0 0 0 0 0
1 1 1 0 1 1 1 1 0 0 0 0 0 0
0 1 1 1 1 1 1 1 1 0 0 0 0 0
1 0 1 1 1 1 1 1 0 0 0 0 0 0
0 0 1 1 1 0 1 0 0 0 0 0 0 0
0 0 1 0 1 1 0 1 0 0 0 0 0 0
0 0 0 0 1 1 1 1 0 0 0 0 0 0
0 0 0 0 0 1 0 1 1 0 0 0 0 0
0 0 0 0 1 0 1 1 1 0 0 0 0 0
0 0 0 0 0 0 1 1 1 0 0 1 0 0
0 0 0 0 0 0 0 1 1 1 0 1 0 0
0 0 0 0 0 0 0 1 1 1 0 1 1 1
0 0 0 0 0 0 1 1 1 1 0 1 1 1
0 0 0 0 0 1 1 0 1 1 1 1 1 1
0 0 0 0 0 0 1 1 0 1 1 1 1 1
0 0 0 0 0 0 0 1 1 1 0 1 0 0
0 0 0 0 0 0 0 0 1 0 1 0 0 0
0 0 0 0 0 0 0 0 1 0 1 0 0 0

  1. Import the file in SocNetV. The network created does not make any sense from the user perspective. In fact, the network which is drawn upon the canvas is the acquaintance network by constructing a 1-mode matrix A such that aij = 1 if person i is in at least one group with person j.

Furthermore the two_sm_mode variable is not used by Parser.

SocNetV should be able to import two-mode data by:
a) creating bipartite graph with both modes (groups of actors/organizations)
b) creating the acquaintance network (as it does now).

Crash on second search after node removal

The app crashes if a search (Ctrl+F) is done after removing a node.
To reproduce:

  1. Open a net (i.e. "Countries_Trade_Basic_Manufactured_Goods" by Wasserman-Faust)
  2. Ctrl+F search for a node.
  3. remove that node (Ctrl+Alt + . )
  4. Press Ctrl+F again. SocNetV crashes.

Can't open/import Pajek file

Everytime I try to open a Pajek formatted file, including my own or the one provided in SocNetv manual, I'm getting an error message "XML tokenstring at line 1 is invalid".

Crashes on HCA with isolated nodes

SocNetV craches when doing Hierarchical Cluster Analysis in networks with isolated nodes. This happens only when the input matrix is the geodesic distances between actors.
To reproduce:

  1. Recreate Padgett's Florentine Families network (press F7 then select it)
  2. Perform HCA on that network from the menu Analyze -> Structural Equivalence -> Hierarchical Clustering. Leave default options (input matrix: distances)

Node and edge keyboard shortcuts simplification

Instead of strange combinations Ctrl+. and Ctrl+/ for new node and edge creation, we should use INSERT (or ENTER) key for node creation and / for edge creation.
Moreover we can automate the creation of a new node connected to an existing node N, by the combination SHIFT+INSERT iff a node N is already clicked/selected.

To delete a node or and edge, it should be suffice to click on it and press key: DELETE - For that, we need to have a delete action which will check if a node or an edge is clicked and then trigger the proper node or edge removal from canvas.

TODO: Katz Centrality

SocNetV should implement Katz Centrality to enable the user to measure the degree of influence of an actor in a social network by taking into account the total number of walks between a pair of actors.

Katz centrality computes the relative influence of a node within a network by measuring the number of the immediate neighbors (first degree nodes) and also all other nodes in the network that connect to the node under consideration through these immediate neighbors. Connections made with distant neighbors are, however, penalized by an attenuation factor \alpha. Each path or connection between a pair of nodes is assigned a weight determined by \alpha and the distance between nodes as \alpha^d.

For example, in the figure on the right, assuming that John’s centrality is being measured and that \alpha = 0.5. The weight assigned to each link that connects John with his immediate neighbors Jane and Bob will be (0.5)^1 = 0.5. Jose connects to John indirectly through Bob, the weight assigned to this connection (composed of two links) will be (0.5)^2 = 0.25. Similarly, weight assigned to the connection between Agneta and John will be (0.5)^3 = 0.125.

Mathematical formulation

Let A be the adjacency matrix of a network under consideration. Elements (a_{ij}) of A are variables that take a value 1 if a node i is connected to node j and 0 otherwise. The powers of A indicate the presence (or absence) of links between two nodes through intermediaries. For instance, in matrix A^3, if element (a_{2,12}) = 1, it indicates that node 2 and node 12 are connected through some first and second degree neighbors of node 2. If C_{\mathrm{Katz}}(i) denotes Katz centrality of a node i, then mathematically:

C_{\mathrm{Katz}}(i) = \sum_{k=1}^{\infin}\sum_{j=1}^n \alpha^k (A^k)_{ji}

Note that the above definition uses the fact that the element at location (i,j) of the adjacency matrix A raised to the power k (i.e. A^k) reflects the total number of k degree connections between nodes i and j. The value of the attenuation factor α has to be chosen such that it is smaller than the reciprocal of the absolute value of the largest eigenvalue of the adjacency matrix A.[4] In this case the following expression can be used to calculate Katz centrality:

\overrightarrow{C}_{\mathrm{Katz}} = ((I - \alpha A^T)^{-1}-I)\overrightarrow{I}

Here I is the identity matrix, \overrightarrow{I} is an identity vector of size n (n is the number of nodes) consisting of ones. A^T denotes the transposed matrix of A and (I - \alpha A^T)^{-1} denotes matrix inversion of the term (I - \alpha A^T).

Urls:
http://en.wikipedia.org/wiki/Katz_centrality

TODO: Improve memory consumption and performance

For increased performance, SocNetV should use as many cpu cores as possible as well as use minimum memory.

ATM, SocNetV runs pretty much in the same cpu core. Only file parser and crawler functions are using differrent cpu threads. Also, when the network has hundreds of nodes and the user moves some of them, there is a constant increase in memory usage.

Use GitHub as code hosting/repository service

After almost 10 years in sourceforge vcs (svn, then git) and a brief experiment with bzr, it's time to move the project code development in a reliable and trusted git hosting service for everybody to see and contribute. I am happy to report that this service will be Github! The codebase (branches, etc) has been imported painlessly and we have been developing version 2.2 using github git for the past month without any problem. So, from now SocNetV will use GitHub.

Graphviz files: Default edge color remains unchanged

Save this network to some file directed.dot:

graph graphname {
// This attribute applies to the graph itself
size="1,1";
// The label attribute can be used to change the label of a node
a [label="Foo"];
// Here, the node shape is changed.
b [shape=box];
// These edges both have different line properties
a -- b -- c [color=blue];
b -- d [style=dotted];
}

  1. Load directed.dot in SocNetV. All network edges appear blue. The default edgecolor should be changed to blue.

  2. Create a new edge by mouse (middle/double clicking). The new edge takes the previously set initEdgeColor (default: black) rather than the color set by the network file.

Feature Request: Undo option

A user wrote:
"My main frustration, as a beginner, is that I can’t find an undo button; when I make large-scale mistakes, I find myself having to start all over, and that’s quite frustrating. "

SocNetV needs to have undo functionality to assist users drawing networks on the canvas.

Wrong info messages on writing/plotting adjacency matrix

Due to a variable not initialized properly, in some cases (i.e. plotting adjacency matrix) the informational message displayed in the progress dialog is not updated but instead it shows the same text from the last user action involving progress dialogs.

One-line Graphviz files not parsed

GraphViz (dot) files can't be parsed if the data is in a single line.

For instance this graph is read but nothing is displayed:
digraph mydot { node [color=red, shape=box]; a -> b -> c ->d node [color=pink, shape=circle]; d->e->a->f->j->k->l->o [weight=1, color=black]; }

If we use line breaks, then everything is OK. Test:

digraph mydot {
node [color=red, shape=box];
a -> b -> c ->d
node [color=pink, shape=circle];
d->e->a->f->j->k->l->o
[weight=1, color=black];
}

TODO: More clustering algorithms

Except HCA, SocNetV should implement the following clustering algorithms to automate finding community structure:

  • the Girvan-Newman algorithm, older one for small graphs mainly, see paper " Community structure in social and biological networks"
  • the Clauset-Newman-Moore algorithm, see paper "Finding community structure in very large networks"
  • the Wakita and Tsurumi algorithm, see paper “Finding Community Structure in Mega-scale Social Networks”

New feature: Kamada-Kawai FDP layout method

ATM, SocNetV supports two layout methods:
(a) force-directed placement (FDP)
(b) radial / level by prominence index score

The FDP layout algorithms in SocNetV have been somewhat improved, but we need to add more FDP models, i.e. Kamada-Kawai

Connectedness method sometimes returns default result

Due to a variable not initialized properly, the connectedness method reports wrong results when executed after an algorithm related to distances. For instance open a connected network, run distances matrix, then connectedness. SocNetV will report it as unconnected.

Disabling isolate nodes has no effect in distance matrix report

Create a test net of 3 actors.
0 1 0
1 0 0
0 0 0

Select Edit > Filter > Disable Isolate Nodes. The actor 3 is disabled and hidden.
But when you do Analyze > Cohesion > Distances matrix the reported matrix is still a 3x3 matrix not a 2x2 one as it should be.

Add scatter plots in html reports

Reports can be more helpful if they offer scatter plots of the results. For instance, a centrality report might include a scatter plot of actor centralities. This would be a handy tool for the researcher to overview the results, as well as another visualization per index layout -- only this time inside the report.

Menu options to apply Node Size layout by Prominence index

SocNetV supports prominence-based layouts where the size of all nodes follows the prominence score of each node. Nevertheless, this functionality is only available through the toolbox. There are no relevant options in the Layout menu, except Node Size by inDegree or outDegree.

New Feature: Alternative node icons support

"I want to know if alternative icons can be substituted for nodes. I have both *.ico and *.png icons that I have made specific to my work. I would like to use those. Is this possible with socnetv?"

Layout by Closeness Centrality Toolbox option does not work

A regression in v2.2 left the Control Panel layout by closeness centrality index option (radial, level, nodal) not working. The user selects Closeness Centr index, clicks Apply but nothing happens. Nevertheless, the same option in the main menu works fine.

Add zero-weighted edge support (?) and zero-weighted edge color selection functionality in Settings

SocNetV omits zero-valued edges during network analysis computations. Nevertheless, when opening weighted edge lists, SocNetV accepts edges with zero values/weights and draws them (although completely by mistake).

A SocNetV user informed me that they need this functionality (zero valued edges to be drawn) and on top of that to be able to select some color for this kind of edges.

We will implement this functionality in Settings but it will be explicitly declared that the functionality serves only for those that have data (i.e. weighted edge lists) with zero weights on some edges and they still need to draw those edges, despite the fact that they will not be considered in any SNA computation by SocNetV.

Note: This functionality needs investigation as to what formats (except edge lists) support zero-valued edges.

Wrong BC scores when the network is weighted

SocNetV up to 2.3 computes wrong Betweeness Centrality scores when the loaded network is weighted.

For example, take the 4 actors social network:

0 | 2 | 0 | 2
2 | 0 | 1 | 0
0 | 1 | 0 | 1
2 | 0 | 1 | 0

image

Apparently, each of actors 2 and 4 lie in half the shortest paths (geodesics) from 1 to 3 . Thus their BC should be 0.5
And actor 4 lies on the sole geodesic between 2 and 4, this its BC should be 1.
But SocNetV reports zero BC for all actors except 4.

TODO: Add Performance options in Settings

Testing really large files (see example net in #23) showed that performance options should be added in Settings. For instance, when the loaded network has thousands edges as in your data, an option to "Disable Edge Highlighting when hovering" would be handy, since that would speed up user interactions with crowded nets.

Recommend Projects

  • React photo React

    A declarative, efficient, and flexible JavaScript library for building user interfaces.

  • Vue.js photo Vue.js

    🖖 Vue.js is a progressive, incrementally-adoptable JavaScript framework for building UI on the web.

  • Typescript photo Typescript

    TypeScript is a superset of JavaScript that compiles to clean JavaScript output.

  • TensorFlow photo TensorFlow

    An Open Source Machine Learning Framework for Everyone

  • Django photo Django

    The Web framework for perfectionists with deadlines.

  • D3 photo D3

    Bring data to life with SVG, Canvas and HTML. 📊📈🎉

Recommend Topics

  • javascript

    JavaScript (JS) is a lightweight interpreted programming language with first-class functions.

  • web

    Some thing interesting about web. New door for the world.

  • server

    A server is a program made to process requests and deliver data to clients.

  • Machine learning

    Machine learning is a way of modeling and interpreting data that allows a piece of software to respond intelligently.

  • Game

    Some thing interesting about game, make everyone happy.

Recommend Org

  • Facebook photo Facebook

    We are working to build community through open source technology. NB: members must have two-factor auth.

  • Microsoft photo Microsoft

    Open source projects and samples from Microsoft.

  • Google photo Google

    Google ❤️ Open Source for everyone.

  • D3 photo D3

    Data-Driven Documents codes.