
Inspired by the repository https://github.com/lydiahallie/javascript-questions I created a questionnaire for a couple of topics that fall under the umbrella of Artificial Intelligence, covering Basic Techniques and Foundations, Computer Vision, Natural Language Processsing, and Reinforcement Learning.
The purpose of this repository is for you to learn the concepts, refresh your knowledge, or prepare yourself for an interview.
The concept is the same as on Liydia's repo, although I don't provide possible answers. The correct answer can be seen by clicking on the expandable part. I'm happy to incorporate feedback, so feel free to drop me a line in case something feels off.
Answer
Example of an answer.
- What is the output when using a convolution kernel?
Answer
- A real number
- How is the conv result calculated?
Answer
- Mean over the sum of the multiplications of image value with convolution kernel value
- What is a first level tensor called?
Answer
- Vector
- What is a second level tensor called?
Answer
- Matrix
- What is a third level tensor called?
Answer
- Tensor
-
How can nominal data be transformed to numerical data?
Answer
- One Hot encoding

-
What is meant by segmentation?
Answer
- Set of data belonging to an object of an object class c
- Is the Euclidean distance a measure of similarity or dissimilarity?
Answer
- Dissimilarity measure
- Is the correlation a similarity measure or dissimilarity measure?
Answer
- Similarity measure
- What is a Voronoi cell?
Answer
- Separation of the solution space into volumes (multi-dimensional) / surfaces (two-dimensional) using mid-perpendiculars between two adjacent points.
-
How does the K-Neighbourhood Classifier work?
Answer
- A hypersphere is enlarged by a new point in feature space until k elements are contained. Then the class is assigned by a simple majority decision.
-
What is a Template?
Answer
-
Template objects are the mean of a certain class. This then results in the center of gravity of a cluster.

Source: Karlsruhe University of Applied Science - Prof. Dr. Norbert Link
-
-
What is the Minimum Distance Classifier?
Answer
- If vec_x closer to template 1, then class c_1, otherwise class c_2
-
Perceptron: What is the idea of the weight vector?
Answer
-
The intuition behind the weight vector comes from the idea of calculating the Euclidean distance from an input vector and a template vector. (See questions about this). The Euclidean distance of two vectors can be resolved to

Source: Karlsruhe University of Applied Science - Prof. Dr. Norbert Link
The middle part shows the weight vector and the +2 the bias. Since we are doing continuous learning, we can define a weight vector w and a random bias. This gives the Euclidean distance when we calculate the scalar product of the input vector with the weight vector. Since the Euclidean distance is a dissimilarity measure, if it is greater than 0, it is assigned a different class than if it is less than 0.

Source: Karlsruhe University of Applied Science - Prof. Dr. Norbert Link
-
-
Perceptron: What is the idea of input vector and weight vector?
Answer
- Calculate the Euclidean distance
- Perceptron: What is the idea of the perceptron?
Answer
- By means of continuous learning, we change the weight vector so that it creates a dividing line between two classes in our feature space.
-
A linear decision function in 2D space may have how many input variables?
Answer
- Only one, because the function value adds another axis

(Linear decision function)
Source: Karlsruhe University of Applied Science - Prof. Dr. Norbert Link
-
Which is the required property for a cost function so that the minimum can be found?
Answer
- Function must be continuous and differentiable
-
What are the two options for the minimum search of the cost function?
Answer
- Numerical (Full Scanning)
- Analytical (derivation)
- In the following example, the cost function is the sum of the quantity of incorrectly classified vec(x)

Source: Karlsruhe University of Applied Science - Prof. Dr. Norbert Link
-
How can the distance of a point vec(x) to the decision line be calculated?
Answer


Source: Karlsruhe University of Applied Science - Prof. Dr. Norbert Link
-
How do I make the Perceptron cost function continuous and differentiable?
Answer
- Use the distance of the incorrectly classified distances and add them up. The function becomes continuous, since we are now working with fine granularity, meaning that a slight change in w may produce a large variation in the result of the function value (hyperplane)

Source: Karlsruhe University of Applied Science - Prof. Dr. Norbert Link
-
How are the weight values initialized?
Answer
- Random!
- Never use 0, otherwise the algorithm cannot start
- How do I update the weights of a perceptron?
Answer
- Weight = weight - learning rate * slope of the cost function from w to at position k (which is the derivative of the cost function over w)
- Multiclass extension of the perceptron: Which Loss do I choose?
Answer
- Hinge-Loss or Maximum Margin Loss
-
How does the Hinge Loss work?
Answer
-
For each class the score is calculated and the goal is that the score for the correct class is greater than a certain delta + the accumulated sum of all other classes. If so, the cost would be 0, if in the delta, costs are calculated proportionally.

-
-
What is the composition of the Multiclass SVM Loss?
Answer
- Composed of hinge loss and regularization loss (with lambda as regularization parameter)
- When do I use the loss and when a score?
Answer
- Loss value implies how well or poorly a certain model behaves after each iteration of optimization. Ideally, one would expect the reduction of loss after each, or several, iteration(s).
- The accuracy of a model is usually determined after the model parameters are learned and fixed and no learning is taking place. Then the test samples are fed to the model and the number of mistakes (zero-one loss) the model makes are recorded, after comparison to the true targets.
- Source: https://stackoverflow.com/questions/34518656/how-to-interpret-loss-and-accuracy-for-a-machine-learning-model
- What is a weakness of the template approach?
Answer
- Template becomes blurry if class instance has a very different feature value
- How can the problem be solved for a template?
Answer
- Transformation of the actual features to so-called intermediate features, which are invariant to differences in original features. (non-linear transformation). This results in an intermediate feature template
-
What is the structure of a non-linear classifier that addresses the problem of intermediate feature templates?
Answer

Source: Karlsruhe University of Applied Science - Prof. Dr. Norbert Link
-
How can non-linearity be generated?
Answer
- With AND, OR and XOR Grids
- What is the advantage of the templates in terms of inference?
Answer
- They are faster because only Voinoi must be calculated for representatives
- What is the disadvantage of the templates ?
Answer
- They are inaccurate
- How do I get the hyperplane of a perceptron?
Answer
- Set zero for one of the two values (x1,x2). Solve the equation and do the same the other way round.
- What is the principle of the minimum distance classifier?
Answer
- Calculate a center of gravity vector from the sample vectors of a class (mean over sum). This is also called a template.
- Classification based on distance to template
- What is the advantage of the minimum distance classifier compared to the nearest neighbour classifier?
Answer
- The Minimum Distance Classifier is more robust against outliers, because not every data point of the sample is considered, but only their main class focuses.
- The inference should be faster, since only the distance to N class centers is determined and not the distance to each individual data point of the sample.
- The distances must be calculated only for the centers of gravity
- What is the disadvantage of the minimum distance classifier compared to the nearest neighbour classifier?
Answer
- Only works under certain conditions
- Mean values are only a good template in special cases
- Only linear class boundaries can be displayed
- How does the perceptron divide a two-dimensional feature space?
Answer
- Through a straight line into two half spaces
- What are the parameters of the perceptrons and on which principle does the perceptron learn its values?
Answer
- Parameters: Weight values 𝑤 Threshold values 𝑤
- Principle: Minimization of the classification error-loss function by using a gradient descent method
- What does the perceptron cost function represent and what is it ?
Answer
- Percepton cost function represents the sum of the distances of all incorrectly classified samples to the decision (hyper) level.
- How can the limitation of linear classifiers be overcome?
Answer
- Combination of linear classifiers in layers with non-linear activation function
- What are the two most common stochastic modelling approaches and in which areas (unsupervised/supervised) are they applied?
Answer
- Joint probability function (Unsupervised Learning)
- conditional probability function (Supervised)
- What are the reasons for prediction/forecast errors?
Answer
- Used model cannot depict real situation
- Randomness at generating the dataset from the real model (if dataset is small)
- Randomness at learning (e.g. stochastic gradient descent, simulated annealing)
- What is the concept of I.I.D ?
Answer
- Independent Identically Distributed. Each of the n feature vectors is independent from the others and all have their origin in the same probability distribution.
- What is the definition of the Likelihood L(𝜗 | G)?
Answer
- For the likelihood L we usually take data G as given and evaluates the likelihood as function of 𝜗
-
What is the definition of P(G | 𝜗)?
Answer
For a given 𝜗 we evaluate the probability of different results G of the data generation.

probability is the quantity most people are familiar with which deals with predicting new data given a known model ("what is the probability of getting heads six times in a row flipping this 50:50 coin?") while likelihood deals with fitting models given some known data ("what is the likelihood that this coin is/isn't rigged given that I just flipped heads six times in a row?"). I wanted to add this perspective because using the example in this clip, a likelihood quantity such as 0.12 is not meaningful to the layman unless it is explained exactly what 0.12 means: a measure of the sample's support for the assumed model i.e. low values either mean rare data or incorrect model!
-
What is the Maximum-Likelihood-Prinicipal?
Answer
-
We determine parameter 𝜗 that results in the max Likelihood for given data G
𝜗_hat = argmax 𝐿 ( 𝜗 | 𝐺 )
-
-
What is the definition of a generative stochastical model?
Answer
- We talk about a a generative stochastical model for a data-mining challenge, on the assumption, that the data was generated by a stochastically process with a known structure (which most has unknown parameters)
- What is the difference between the Naive Bayes Classifier and the Bayes classifier?
Answer
- TL; DR: The naive Bayes classifier is an approximation to the Bayes classifier, in which we assume that the features are conditionally independent given the class instead of modeling their full conditional distribution given the class.
- Taken from:https://www.quora.com/What-is-the-difference-between-the-Naive-Bayes-Classifier-and-the-Bayes-classifier
- What is the definition of Bias?
Answer
- The bias of a learned model for a specifically predicted value f(x_0) is the deviation between the expected value E(f(x_0) and the predicted value f(x_0) of the true value. (Ergo the estimaton of the parameter is not unbiased)
- How is the Bias produced/generated?
Answer
- Often the consequence is that the function class used in learning is not powerful enough to model the true context, or is prevented by regularization or a prior from choosing the parameters appropriately.
- Definition Variance
Answer
- The variance of the learned model for a certain predicted value 𝑓(𝑥) is understood to be a random deviation from the predictable portion 𝑓(𝑥) of the true value.
- Especially for models with (too) many degrees of freedom, the prognosis result will be strongly influenced by the coincidence of the perturbation 𝜖, because the model can and will then also model this random noise, which turn out differently with each repetition.
- What is the composition of the Mean Squared Error (MSE) ?
Answer
- MSE = Variance + Bias (E(f(x) - f'(x))^2) + non predictable portion/noise (epsilon)
- Describe the Tradeoff between Bias and Variance
Answer
- Suppose I took different degrees of freedom. Then my model will have a higher bias with fewer degrees of freedom, but a lower variance
- The optimal total error is usually achieved somewhere in the middle of the model complexity, i.e. neither too much bias nor too much variance is desired.
- However, if I know that a parameter is in fact independent of others, then the model would be limited if I did not treat it as such. In this case, after remodelling, I reduce the variance without increasing the bias.
- → Goal: Find independent Variables
- What is the difference between the Bayesian learning approach and the classical one?
Answer
- The a-priori probability distribution is given and we generate a parameter vector THETA based on it. (One-time execution). This is used to generate the data using random experiments.
- Based on the random sample, bayes is applied and the a-posteriori probability distribution is calculated (without bayes you would have a histogram here, which would basically be the Prior?)
- A-posteriori is used for Inferenc/Recall
- What are the advantages of the Bayesian learning approach?
Answer
- The uncertainty of the estimates is taken into account in a consistent manner
- Therefore less tendency to overfitting
- The assumptions become explicitly visible in the form of the prior
- What are the disadvantages of Bayesian learning?
Answer
- The Prior must be mostly subjectively guessed.
- The recall/inference is usually too complex for exact calculation and must be approximated numerically. (With all imaginable parameter values must be predicted, followed by weighted averaging).
- Definition Prior
Answer
- A-priori (i.e. prior knowledge of the data assumed on the basis of prior knowledge) probability distribution of the unknown parameters
- Definition Posterior
Answer
- A-posteriori (i.e. determined in consideration of data and prior knowledge) probability distribution of unknown parameters
- Is Bayes suitable for the practice?
Answer
- No, because calculating the integral over all possible parameters analytically is too costly
- Why do people still like to use Bayes?
Answer
- Serves as a source of intuition as to what one should expect for a good prognosis
- Approaches of Model Averaging can be considered as approximations of Bayesian learning
- Give an example approach for the approximation of Bayes
Answer
- Bagging: Different sampling (random) and training of separate models. Inference averages the predictions of all models. Predictions turn out differently because of different samples.
- Why should dimensions be reduced?
Answer
- Too high dimensions lead either to computational problems or worsen performance due to irrelevant input. (Curse of Dimensionality)
- Which modeling assumptions are made to solve the problem?
Answer
- Assumption of a linear relationship (correlation of two features)
- Assumption of irrelevant features (input pruning)
- Assumption that the problem can be solved by a linear projection of the input space (PCA)
- Name concrete approaches for the reduction of dimensions
Answer
- Omit unimportant inputs (Input Pruning, Feature Selection), e.g. by
- Greedy Algorithm: remove the (apparently) least important one several times in succession
- Ideal selection: Train a model with each subset of inputs and take the best one.
- Summarize inputs. (e.g. through aggregation or more complex transformations such as PCA (Principal Component Analysis))
- Omit unimportant inputs (Input Pruning, Feature Selection), e.g. by
- What are the critical points of a) Greedy, b) Ideale Selection and c) PCA?
Answer
- a) Greedy selection can lead to suboptimal decisions
- b) Impracticable, as it is too costly. Overtraining in input selection possible.
- c) PCA considers only the statistical distribution of input values, without considering the relevance for the output.
-
Explain the idea of PCA (Principal Component Analysis)?
Answer
- The idea is to eliminate axes representing variables by appropriate rotation (columns of the rotation matrix are orthogonal). One wants to omit the axes that express little variance of the data, which is caused, for example, by the correlation of two variables. This results in two goals:
- the resulting variables are linearly independent of each other.
- the transformed dimensions have as much variance as possible and are sorted by the decreasing variance of the data
- Intuition:
- Preserve the information available in n variables as good as possible in m variables, where m<n.
However: Result depends on the scaling of the inputs.
- The idea is to eliminate axes representing variables by appropriate rotation (columns of the rotation matrix are orthogonal). One wants to omit the axes that express little variance of the data, which is caused, for example, by the correlation of two variables. This results in two goals:
-
Name the steps of the PCA
Answer
- Step 1: Make the variables as independent as possible by rotation
- Step 2: Omit the variables with the lowest variance, for example the second main component
- What is sampling and when should sampling be applied?
Answer
- If the data set is too large, the approaches are first tested on small excerpts. If the results are good, the large data set can be used.
- What are the possibilities for downsizing?
Answer
- Reduce number of tables or columns
- Reduce number of rows
- What options are there for reducing the number of columns?
Answer
- Omitting tables or columns (only the important columns are kept)
- Column aggregation (averaging of columns, e.g. pixels of images) E.g. replace measured values from different sensors by their average value
- Dimension reduction, e.g. with PCA
-
What options are there for reducing the number of rows?
Answer
-
Aggregation of several rows
E.g. measured values that were recorded at millisecond intervals can be made larger by averaging them at one-second intervals
-
Simple Random Sampling
- Without putting it back: default case
- With putting back: Loses more information, desired if stronger randomness is required
- Stratified Sampling
- Amount of data is divided into groups/categories and simple random sampling is performed on these groups. This ensures that the same amount of data is sampled from both groups. (Important if you want to keep the original distribution, e.g. elections)
- Systematic selection (by hand, manual)
- What is the advantage of random sampling?
- Both are robust, in case that the data set is arranged according to some systematic.
- What is the difference between the variant "without replacement" and the variant "with replacement"?
- Variant without replacement is the standard procedure and produces less variance than "with”
- "With" is used if more variance is desired (e.g.: bagging)
- What is a Bias?
- Systematic estimation error
- Which value increases the standard deviation for pure random sampling?
- With the reciprocal of the root of the sampling rate
- When is bias generated during sampling?
- If the sampling selects data objects based on different probabilities
- How can the generated bias be compensated?
- if the data sets in the sample are assigned weighting factors that are inversely proportional to the probability of their being selected into the sample. → reciprocal value
- Example: Fraud cases with 100%, not fraud cases with 0.1% in the sample. Compensate by weighting data sets in the sample with the reciprocal of their sample probability. => not fraud * 1000
- Give two examples of criteria for systematic selection
- Deterministic selection criterion with link to the data contents. Extreme form of stratified sampling in which nothing is left to random chance.
- Example: A department store with an inventory of 100,000 products and 100 branches creates a data record of 10 million purchase transactions - for each product one transaction from each branch.
- Deterministic selection criterion without relevance to the data contents:
Example: Every 10th row of the data set (corresponds to random sampling for randomly sorted data) - What does the abbreviation IID stand for and what does it mean? - Independent and identically distributed random variables - Rows are independent of each other and are all subject to the same distribution - What problems can occur when sampling relational data (across multiple tables)? - Integrity violations during subsequent joins (e.g. purchase order item with order_id for which there is no master data) - Cross-record key figures can be falsified. (e.g. number of articles per shopping cart, average time interval between orders from a customer) - Integritätsverletzungen bei späteren joins (z.B. Bestellposition mit order_id, zu der es keine Stammdaten gibt)
Falsifications can be corrected, but are very costly and depend on the type of key figure calculation. In addition, the corrected values tend to have a very high variance.
-
-
What would be the best solution for relational sampling?
Answer
- Look at the data and best is to sample the data on the top level and then join it (e.g. UserId is top level, join from order_ids)
- What are the disadvantages of relational sampling?
Answer
- If more than one table is processed, it may not be feasible
- Sampling depends on the model approach and features used. (e.g. if we at Instacart want to have a variable for every order that tells us how shortly before the last order was received by Instacart - no matter which user)
-
What is the ROC curve? (Also called Precision Recall Curve)
Answer
ROC and AUC, Clearly Explained!
- ROC is used if you want to compare different values for a threshold.
-
Comparison of True Positive Rate (Sensitivity) and False Positive Rate (1- Specifity)

-
For each new threshold the values are recalculated and plotted again. Here you can see that there are two points that would be best. The left point would have no false positives at all. Depending on the use case, a decision must be made here. The points can still be connected to a line.

-
What is AUC?
Answer
-
Area under the Curve. Describes the area below the curve and is very useful for comparing different approaches

-
-
What is the disadvantage of AUC?
Answer
- Compared to Precision, an imbalance of the data (e.g. the true negative) can have an effect on the result.
- Provide metrics for regression models
Answer
- Mean squared error
- Root mean squared error
- Mean absolute error
- Median absolute error
- What is the advantage of Root Mean Squared Error?
Answer
- Makes the mean squared error more interpretable
- What is the advantage of Mean Absolute Error?
Answer
- Not so sensitive to outliers (more robust)
- What is the advantage of Median Absolute Error?
Answer
- Even more robust against outliers
- When should Precision be used?
Answer
- Suitable for highly unbalanced problems
-
What are the two approaches to multiclass classification?
Answer
-
Look at the binary classification for each class. "belongs" or not. Average values over classes.
a) Arithmetic mean "macro averaging" → Not well-founded, rather poor
b) Weighted by class frequency "Weighted Averaging" → Better
-
Multiclass Confusion Matrix → "Micro Averaging" → Best option: No metrics are created for multiple classes

-
Taken from: https://towardsdatascience.com/multi-class-metrics-made-simple-part-ii-the-f1-score-ebe8b2c2ca1
-
- What does a graphical model represent?
Answer
- The stochastic (in)dependence structures between random variables, that are modeled as nodes
- What types of networks are there?
Answer
- Causal networks (includes causal structure)
- Bayesian networks (dependency structure like for causal networks, but without causal structure). Directed Graph
- Markov networks (undirected graph)
- What is the difference between a causal network and a Bayesian network?
Answer
- By knowing the causality relationships it is possible to predict what happens when you change variables. With Bayes networks only a conclusion is made about what happens with what probability if you do not manipulate/intervene the system.
- What is the goal of the EM-Algos?
Answer
- Clustering of data points using the a-priori values variance and mean.
-
Describe the process of the EM
Answer
Starting point: A cluster of data points without knowing by which probability function the values are created.

- Estimate the a-priori value for variance and mean value (start with two randomly placed Gaussians)
- Estimate Step: Use Bayes Rule to estimate the probability of a point belonging to a certain distribution. Either blue or yellow, but no hard assignment, only the probability (between 0 and 1).
-
Maximize step: Update mu and variance based on the points that were assigned softly

-
How does EM differ from K-Means?
Answer
- If you make a hard assignment in the E step (hard assignment to a cluster), that means each missing value is set to the most likely value, instead of continuing with the whole probability distribution, you get exactly the k-means algorithm.
- When do data flaws not bother you?
Answer
- If the frequency and type of flaws in the selected model type do not indicate a major change in the result. (e.g. single, minor measurement errors, rare outliers with an approach robust against outliers such as Median Absolute Error instead of Mean Squared Error)
- If they can be considered as part of the learning problem
- When does it make sense to take data flaws into training?
Answer
- Training the model with it makes sense if the same deficiencies are also present as input when using the model. The advantage is that no effort is required for data cleansing and if the model can handle it, it is an optimal solution. The disadvantage is that a combination with expert knowledge or models from other sources is difficult. If necessary, rename the feature, for example Temperature → Temperature reported by sensor
- Specify causes for missing values
Answer
- Incomplete data collection (sensor failure, questionnaire incomplete)
- Variable makes no sense (e.g. "time since last order" for first order)
- How can outliers be detected?
Answer
- Check the value range of the variables for plausibility, possibly look at the histogram.
- Display joint distribution of pairs of variables, e.g. as a scatter diagram
- Learn the probabilistic model of the common probability distribution of all variables (i.e. unsupervised). Data objects with the smallest probability are outlier candidates. (Or, for non-probabilistic clustering model: Objects with a large distance from their cluster center, as well as clusters with very few assigned points are candidates).
- How should outliers be dealt with?
Answer
- Leave it in (in any case at (3); also at (2), if the learning process can cope with it).
- Possibly, use a robust model type (e.g. Median Absolute Error instead of Mean Squared Error)
- Replace with replacement value or treat as missing.
-
What types of missing values are there?
Answer
-
MCAR: Missing Completely at Random:
Whether a value is missing or not is stochastically independent of all input and output variables. Example: Transmission error due to radio interference when reading out a radio temperature sensor.
-
MAR: Missing at Random:
Whether a value is missing or not is stochastically independent of the missing value. Example: Women are less willing to give their age in a survey than men. Here: stochastic dependence on gender, but not on age itself.
-
NMR: Not Missing at Random: Whether a value is missing or not depends on the missing value. Example: Older women are less willing to reveal their age than younger ones.
- Which of the three types does not lead to a bias?
- MCAR
- Mention points for dealing with missing values
- Use approaches that can handle missing values (for example, Naive Bayes classifier, certain decision tree variants)
- Ignore affected data objects completely
- Use affected data objects only partially
- Insert a substitute value (imputation)
- Use probability distribution of the missing value as a substitute. (EM algorithm)
- Code 'value missing' as a special value of the variable. Thus, a model (or, in the case of manual analysis, a human) with approaches that require complete data can be applied to incomplete data.
All these procedures only work under certain conditions. There is no way around finding out (or making assumptions) why the values are missing.
-
-
Handling missing values: Explain advantages/disadvantages of Naive Bayes classifier
Answer
- Usually leads to bias, if not MCAR.
- Advantage: Very simple, because you can simply omit one variable in the term.
- Handling missing values: Explain advantages/disadvantages when affected data objects are completely ignored
Answer
- Advantage: Simplest approach.
- Disadvantage: Available data shrinks. Under certain circumstances this can happen very strongly. Example: If there are 100 variables, and each individual value is missing with 2% probability (independent of the others), only 13% of the data objects are complete
- May lead to bias if not MCAR and the output variable is stochastically dependent on the absence of the input variable (Supervised Learning), or if the absence of the input variable depends on the value of a variable whose probability distribution is to be modeled (Unsupervised Learning).
- Prerequisite: Only suitable when little is missing.
-
Handling missing values: Explain advantages/disadvantages of affected data objects only partially used
Answer
- Advantage: Data is optimally used
-
Prerequisites/Disadvantage: May lead to bias if not MCAR, just like when affected data objects are completely ignored.
Example: In the scatterplot for the dimensions (X1, X2) omit the data objects where X1 or X2 are missing, in the scatterplot (X2, X3) omit those where X2 or X3 are missing.
-
Handling missing values: Explain advantages/disadvantages of using substitute values (imputation)
Answer
- (a) For quantitative feature, e.g. mean or median
- (b) For ordinal feature: median
- (c) For nominal feature: modal value; or
- d) CPS hot deck (Current Population Survey): Use the value of the previous data object for this feature. (This means that a random value is taken from the distribution of this feature)
- e) Or in general: Learn a predictive model for the missing feature and thus estimate the missing values. Common: k-nearest neigbor
Advantage of a-d: Simple
Downside:
-
a - c falsifies the distribution of the missing attribute even with MCAR
→ possibly Bias in the results
-
(d) still generates some bias (because dependencies are not taken into account), but less than a-c, but additionally variance (model error/variance due to arrangement of objects)
- (e) produces no variance and even less bias than (d) (bias by using only the most likely value). Is more expensive. (Minimum bias is present because I take the best value)
-
Handling missing values: Explain advantages/disadvantages of using probability distribution of missing value as a substitute. (EM algorithm)
Answer
- Learn the prediction model for the probability distribution of the missing feature to estimate the missing feature from the other features (EM algorithm)
-
Create multiple data objects with the estimated probability values and weight the estimated value with the assigned probability.
Advantage: Best practice from a statistical point of view, with MCAR there is no bias (or only to the extent that the model used has bias).
Disadvantage: High effort. Only worth it if many important values are missing.
-
Handling missing values: Explain advantages/disadvantages of "value missing" encoding as a special value of the variable.
Answer
- No problems with nominal variables
-
Not very nice with metric or ordinal variables (e.g. -99 = "missing").
Whether this is an issue depends on the model types used.
→ Solution:
- Perhaps assign additional binary variables (F1 ... Fn) to the variables (X1 ... Xn), which specify, which of the X-values are missing (nevertheless you need replacement values for the missing values in X).
Prerequisite: It makes sense to learn missing values as part of the problem definition.
Advantage: Little effort. If the model can handle it, optimal solution. Disadvantage: With ordinal or metric features the subject is difficult to model for many model types.
-
How does the bias behave with MCAR and "omitting data objects", imputation and the EM algorithm?
Answer
- Generally unproblematic.
- In this case, Omitting the relevant data objects results in no bias, but in an increase in the variance of the model because the amount of training data is reduced. A data scientist works on a random sample of the (unknown) complete data set.
- If you let a model learn to estimate the probability distribution of the missing value depending on the other variables and thus generate replacement values, this also leads to no bias.
- However, using only the most probable replacement value, or the mean or median, generally results in a systematic deviation of the completed data set from the true values, and therefore in a bias.
-
How does the bias behave with MAR and by using "omitting data objects", orr imputation and the EM algorithm?
Answer
- Omitting in MAR, if the value of the missing variable is to be estimated, leads to distorted estimates (bias increases)
- Replacing by mean value in MAR if the value of the missing variable is to be estimated, leads as well to distorted estimates (bias increases).
Then the missing value is stochastically independent of the missing one under the condition that the other variables are known:
- If the variables on which the absence is stochastically dependent only serve as input variables, no bias occurs in the conditional probability distribution (or regression task) to be estimated, if one just leaves out the incomplete data sets.
- If the absence also depends on output variables, or if a common probability distribution is to be estimated, omitting the data objects with missing values results in a bias. However, this bias can be compensated by creating an estimation model for the probability of the absence depending on the variable values, and then weighting the data records with the reciprocal of the probability of absence.
-
How does the bias behave in NMR and by using "omitting data objects" or imputation and the EM algorithm?
Answer
- Omitting the incomplete data objects generally leads to a bias.
- Problem: This can not be compensated, because the dependency of the missing missing probability on the missing variable cannot be estimated. (No training data)
- Also imputation procedures lead to a bias because there is no training data for data objects with missing values, but the value distribution for these data objects is different from that for those without missing values.
If there is a risk that the missing values will have a significant influence on the results, the data must be collected again.
-
When is a clean approach to the problem critical?
Answer
- If a strong correlation between the missing and the target value of the modelling is to be feared
- What should be done first when it is noticed that features are incomplete?
Answer
- Make assumptions about the mechanism by which the missing values arise.
- When are the generated model errors probably not critical and a simpler procedure should be chosen?
Answer
- If only a few values are missing in a non-critical feature, or in general if values are missing in a non-essential feature.
-
What should be done if data with the same systematics is expected to be missing when given as input to the inference?
Answer
→ Interpret missing data as part of the problem definition, give the model the information what is missing as input
-
Requirements for a bayes network?
Answer
- It is not allowed to be cyclical
- Must have directional edges
- What are difficulties about classifying an image
Answer
- Intra-class variation (Different breed of dogs)
- Shape Variation (Size of dogs)
- Illumination variation
-
What kind of feature did people use before 2012?
Answer
- Color Histogram
-
Key Point descriptor

-
Histogram of gradients

-
Bag of words model

-
Name popular benchmark datasets
Answer
- MNIST
- CIFAR-10 (Canadian Institute for Advanced Research)
- IMAGENET (22 Categories)
- Why haven't been CNNs used before?
Answer
- Requires huge datasets
- and immense computational power
- Name the most popular loss functions for regression and classification
Answer
- Regression: L2 loss (aka mean squared error), L1 loss (aka mean absolute error)
- Classification: cross-entropy loss, hinge loss (used in SVMs)
-
Explain cross-entropy loss
Answer

- M - number of classes
- y_i,c - binary indicator (0 or 1) if class label c is the correct classification for observation o
- (p_i,c) - the predicted probability that observation i is of class c
Source: Karlsruhe University of Applied Science - Yurii Tolochko, 2019
Actually the log function would be mirrored on the x axis and a small value of the predicted probability would be < 0, but since our goal is to minimize it we have to turn the function around and we do that by multiplying -1.

Source: ml-cheatsheet.readthedocs.io/en/latest/loss_functions.html
Therefore, eventually the network learns to output high probabilities for the correct class and low probabilities for the incorrect ones.
-
What is a dense layer?
Answer
- A dense layer (also called a fully connected layer) is a layer where each input is connected to every output, i.e. what we modelled
-
What is the standard activation function to use?
-
What is the output of the conv filter when it slides over an image?
Answer
- Its dot product
-
What does a pooling layer?
Answer
- Used for dimensionality reduction
- Slide with a stride > 1
-
Instead of a dot product of a conv filter the ouput is the max (there are others like average)

Source Illustration: Fei-Fei Li & Justin Johnson & Serena Yeung
-
Impression of a ConvNet from the inside
Answer

Source: Karlsruhe University of Applied Science - Yurii Tolochko, 2019
-
What kind of level feature does a ConvNet encode in the beginning and at the end?
Answer
- The early layers encode most basic feature, whereas deeper layers pick up more specfific ones (e.g. eyes of a face)

Source: Karlsruhe University of Applied Science - Yurii Tolochko, 2019
-
How did they improve neural networks further?
Answer
- Smaller conv filter but deeper networks
-
What is the idea of Inception Modules?
Answer
Create a good local network in a module and stack the modules on top of each other.

Source Illustration : Fei-Fei Li & Justin Johnson & Serena Yeung
-
How do Inception Modules work?
Answer
- Different techniques are applied independently and concatenated afterwards. It is not clear in the beginning which of the approaches will work, but one of these just might.
-
What is the problem of Inception Modules?
Answer
- It creates a huge computational complexity due to a huge increase of the ouput depth
-
Example:

Source Illustration : Fei-Fei Li & Justin Johnson & Serena Yeung
-
How can the problem of Inception Modules be solved?
Answer
-
By applying 1x1 convolutions at the right position, such as prior to a 5x5 or as successor of a 3x3 max pooling

Source Illustration : Fei-Fei Li & Justin Johnson & Serena Yeung
Applying 1x1, leads to:

Source Illustration : Fei-Fei Li & Justin Johnson & Serena Yeung
-
-
What is the goal/purpose of a 1x1 conv filter?
Answer
- It reduces the depth by combining feature maps

Source: Fei-Fei Li & Justin Johnson & Serena Yeung
-
What are the three parts of the GoogleNet?
Answer
- Stem Network
- Stacked Inception Modules
- Classifier Outputs
-
What is the idea of Deep Residual Learning?
Answer
-
Learn difference to the identity map instead of map itself

Source: Fei-Fei Li & Justin Johnson & Serena Yeung
-
-
What is Transfer Learning?
Answer
-
Transfer learning focuses on storing knowledge gained for a specific problem and applying it to a different but related problem”

Source: Fei-Fei Li & Justin Johnson & Serena Yeung
-
-
What different challenges are solvable with computer vision?
Answer
- Object localization: output the class of an image (object) but also output the position of the object (e.g. in form of a bounding box)
-
Object detection: classify multiple objects on an image as well as their locations (bounding boxes)

-
Semantic segmentation: label the individual pixels that belong to different categories (don’t differentiate between instances). Widely used in self-driving cars.

-
Instance segmentation: detect multiple objects, then label the pixels belonging to each of the detected objects. In contrary to Semantic segmentation: Differentiate between instances!

Source Illustration: Fei-Fei Li & Justin Johnson & Serena Yeung
-
What is the idea for object localization?
Answer
- We provide the class we are looking for and the NN tries to locate it. We still need to train a classifier for scoring the different classes, because there could be more than one class in the picture. If the picture showed a dog and cat, and we specify the class as cat, we would only get the bounding boxes for the cat. (or all cats)
-
train a regression output for the box coordinates

Source Illustration: Fei-Fei Li & Justin Johnson & Serena Yeung
-
What are the different loss functions for object localization?
Answer
- Find every object and its bounding boxes in the image.
- softmax loss for classification
-
L2 loss (MSE) for bounding boxes

Source: Fei-Fei Li & Justin Johnson & Serena Yeung
-
What is pose estimation?
Answer
- The human body gets split up in different parts, such as left hand, head, right foot. The NN tries to figure out these parts in the image.
-
What's the ouput of a NN doing pose estimation?
Answer
-
A vector holding different parts and their coordinates.

Source: Fei-Fei Li & Justin Johnson & Serena Yeung
-
-
What is the loss of pose estimation?
Answer
-
L2 loss

Source: Fei-Fei Li & Justin Johnson & Serena Yeung
-
-
What are some approaches to do object detection (which is why harder than object localization?)
Answer
- We do not know beforehand how many object there will be
- Therefore, we cannot use the same approach as in localization (where only one object was to be found and classified).
-
A brute-force approach: apply a CNN to many different subsets of an image and classify each as an object or background.

Source: Fei-Fei Li & Justin Johnson & Serena Yeung
-
Why is the brute force approach bad?
Answer
- checking every crop is computationally costly
-
What are other algorithms to do object detection?
Answer
-
Selective Search for Object Recognition, which does a region proposal for, for example, 2000 parts of the image. The regions are then passed to a normal cnn. This cnn is called Region-CNN (R-CNN)

Source: https://cdn-images-1.medium.com/max/1000/1*REPHY47zAyzgbNKC6zlvBQ.png
-
-
R-CNNs are slow, thats why Fast R-CNN were born. What's the difference?
Answer
-
Fast R-CNN make use of the feature map that is created when an image is fed to the NN. Based on this feature map, regions are derived, they are wrapped into identical size by using pooling operations and then passed to a fully connected layer.

Source: https://cdn-images-1.medium.com/max/1000/1*0pMP3aY8blSpva5tvWbnKA.png
-
-
What does Fast R-CNN do?
Answer
- Uses a predefined algorithm for creating region proposals, and a Region Proposal Network (RPN) to predict proposals from features.
- What are MobileNets and what do they use?
Answer
- On mobile we require nn to process in real time, therefore the number of computations has to be reduced. The engine for this is called depthwise separable convolutions.
-
Explain the idea of Depthwise Separable Convolutions
Answer
Key to understand is to know that the dot product calculation is expensive.
-
A standard convolution does a dot product of all channels

Source: https://cdn-images-1.medium.com/max/800/0*rbWRzjKvoGt9W3Mf.png
-
The idea of depthwise is to reduce the dimension of the channels before the dot product is applied.
1.

Source: https://machinethink.net/images/mobilenets/[email protected]
2.

Source: https://machinethink.net/images/mobilenets/[email protected]
-
-
What impact do the two parameters have on MobileNets?
Answer
The parameters can be used to decrease latency with the drawback to sacrifice accuracy.
- Width multiplier: How thin or thick the feature map gets. (Must be dimensions going into the back)
- Resolution multiplier: Parameter for the size of the resolution of input and feature map.
- Image showing the dropping accuracy with less computation steps

Source: MobileNets: Efficient Convolutional Neural Networks for Mobile Vision Applications, A. Howard et al.
Figure 5 shows the trade off between ImageNet Accuracy and number of parameters for the 16 models made from the cross product of width multiplier α∈{1,0.75,0.5,0.25} and resolutions {224,192,160,128}
-
What's the difference between semantic segmentation and instance segmentation?
-
What is Panoptic Segmentation?
Answer
-
Combines segmenting stuff (background regions, e.g. grass, sky) and Things (Objects with well defined shape, e.g. person, car). Therefore it combines Semantic and Instance Segmentation

Source: Panoptic Segmentation A. Kirillov et al.
-
-
How does Panoptic Segmentation work?
Answer
-
Algorithm must label every pixel in the found objects but also label every pixel in the background "stuff". We map every pixel i to a tupel:

Source: Karlsruhe University of Applied Science - Yurii Tolochko, 2019
-
-
Name datasets to train Semantic or Instance Segmentation models
Answer
- COCO (Common Objects in Context)
- BDD100K (A Large-scale Diverse Driving Video Database)
- Mapillary Vistas Dataset (Data from cities all over the world)
- Cityscapes (50 cities (49 german cities + Zurich), various seasons (spring, summer, fall))
- The KITTI Vision Benchmark Suite
-
What is the Loss Function for Semantic Segmentation?
Answer
- Cross-entropy on a per-pixel basis
-
Main idea: evaluate prediction loss for every individual pixel in an image and then take the average of these values for a per-image loss. This is called Pixel-Wise Cross Entropy Loss.

Source: https://www.jeremyjordan.me/content/images/2018/05/Screen-Shot-2018-05-24-at-10.46.16-PM.png
-
What is the problem for the Loss Function for Semantic Segmentation?
Answer
- Here: every pixel is treated equally (because of the averaging). This can lead to some issues related to imbalanced classes.
-
How can you evaluate the performance of semantic segmentation?
Answer
- For image segmentation we have Intersection over Union (IoU) metric.
-
IoU measures what percentage of pixels in target and prediction images overlap.


Source: https://www.jeremyjordan.me/evaluating-image-segmentation-models/
-
What approaches exist for Semantic Segmentation?
Answer
- Sliding Windows (Inefficient and unusable in practice)
- Fully Convolutional Network for Segmentation (still inefficent, because no dimensionality reduction is applied) //Recall: When a CNN gets deeper we want to have more features but of lower dimension.
-
Image Segmentation Network

Source: Fei-Fei Li & Justin Johnson & Serena Yeung
-
How can we incorporate dimensionality reduction to a CNN for Semantic Segmentation but still have the output of the original size?
Answer
- Design network with downsampling and upsampling (same principal as autoencoder)
-
How can downsampling be done?
Answer
-
Pooling or Strided Convolutions

Source: Karlsruhe University of Applied Science - Yurii Tolochko, 2019
-
-
How can upsampling be done?
Answer
- Unpooling (parameter-free), e.g. "max-unpooling"
- Transpose Convolution (trainable upsampling)
-
What types of Unpooling do you know?
Answer
-
1:

Source: Fei-Fei Li & Justin Johnson & Serena Yeung
-
Bed of Nails (Fill rest of the squares with zeroes)
-
Nearest Neighbour Unpooling. A KIND OF INVERSION OF AVERAGE POOLING OPERATION (Fill rest of the squares with the same number)

Source: Fei-Fei Li & Justin Johnson & Serena Yeung
-
Max Unpooling as Max Pooling Inverse
-
We remember which element was the max value and recover this in the new output


Source: Fei-Fei Li & Justin Johnson & Serena Yeung
-
-
-
Why is the value of the unpooled output slighlty different than it was before?
Answer
-
For this a transpose convolution is used and the scalar of the reduced output is multiplied by the filter. Important: The values in the filter are trained by the network and not predefined.

Source: Fei-Fei Li & Justin Johnson & Serena Yeung
-
-
How does the checkerboard artifact evolve?
Answer

Source: Fei-Fei Li & Justin Johnson & Serena Yeung
-
Convolution and its transpose side-by-side
-
What are other names for transpose convolution?
Answer
- Upconvolution
- Backward strided convolution
- Fractionally strided convolution
- Deconvolution - this one is particularly dangerous because deconvolution is a well-defined mathematical operation which is not the same as transpose convolution.
-
What is the architecture idea for Instance segmentation?
Answer
- There are two independent branches trying to detect a) the categories and the bounding boxes and b) the second branch classifies each pixel whether its an object or not (also called mask prediction).
-
⇒ This procedure happens due to performance reason to the region proposals.

Source: https://github.com/vdumoulin/conv_arithmetic

Source: https://cdn-images-1.medium.com/max/2000/1*lMEd6AcDmpH0mDzBHyiERw.png
-
Note: The idea of mask prediction can also be used for Pose Detection?
- Give a summary of Encoder-Decoder Networks

Source: https://saytosid.github.io/images/segnet/Complete architecture.png
-
What is the motivation for Autoencoders?
Answer
We want them to learn efficient and pertinent data encodings of the data.

Source: https://cdn-images-1.medium.com/max/1600/1*[email protected]
-
Give a definition of Autoencoders
Answer
- Autoencoder is a type of an encoder-decoder network where target space is the same as the input space.
- Provide Characteristics of Autoencoders
Answer
- Data does not have to be labelled
- Latent feature space is usually of lower dimension than the input feature space
- L2 as loss function
-
Where are autoencoders used?
Answer
- All applications of AEs utilize the learned latent features for further purposes.
- Use for dimensionality reduction
- Important: AEs are quite data-specific. They will only work well on data that is similar to that on which they were trained. Extreme example: an AE trained on images will not work well on time-series data.
- Not really good for compression of data
-
Denoising of Input data

Source: https://cdn-images-1.medium.com/max/1600/1*G0V4dz4RKTKGpebeoSWB0A.png
-
Watermark Removal

-
Image Coloring

-
How could we initialize our neural network quite well?
Answer
-
By passing the features of the autoencoder to the weight initialization

Source: Karlsruhe University of Applied Science - Yurii Tolochko, 2019
-
-
How can Autoencoders be used for Anomaly detection?
Answer
- Main idea: let’s say we have a well-trained autoencoder (which means it can reconstruct the data it was trained on without too much error):
- If it works well on the new input, i.e. reconstruction error is low, we can assume that the input is of the normal class.
- If the reconstruction error is high, we should think that the input is of an ‘unseen’ class, i.e. it is an anomaly.
- Main idea: let’s say we have a well-trained autoencoder (which means it can reconstruct the data it was trained on without too much error):
- Potential applications for Autoencoders
Answer
- Detect if input data is of the class that our model was trained on or not.
- Detect outliers.
- Fraud analytics.
- Monitoring sensor data
-
Give an idea of Generative Models
Answer
-
It’s not about predicting and classifying things, it’s
about learning some underlying hidden structure of the data at hand.
We want to train a model distribution pθ ,parameterized by our choice, that would fit or resemble pdata.
If we can successfully obtain this trained model pθ, it in fact means that we know the underlying structure of the data and we can do a lot of interesting things with it.
→ We start by an empirical data distribution

Source: Fei-Fei Li & Justin Johnson & Serena Yeung
-
-
Which famous models belong to generative models?
Answer
- Variational Autoencoder
- Markov Chain (e.g. Boltzmann Machine)
- GANs
-
What are the flavours of Generative Models?
Answer

Source: Fei-Fei Li & Justin Johnson & Serena Yeung
-
On which flavour focuses VAEs and GANs?
Answer
- Variational Autoencoder → Explicit
- GANs → Implicit
-
What are Variational Autoencoder (VAE)?
Answer
- Probabilistic extension of normal autoencoder
- Also considered as latent variable model
- Make it learn latent parameters that describes the probability distribution of the data
- We start with a standard normal distribution and a prior p_theta(z)

-
What is the loss function of VAE?
Answer
- KL (Kullback Leibler) divergence between the learned latent distribution and its prior distribution. This forces the network to learn latent features that follow the prior distribution
-
Reconstruction loss - just as in previous autoencoders, it forces the decoder to match the input.
"Kullback–Leibler divergence (also called relative entropy) is a measure of how one probability distribution is different from a second, reference probability distribution"
-
What is the key difference between Autoencoder and Variational Autoencoder?
Answer
- Autoencoders learn a “compressed representation” of input (could be image,text sequence etc.) automatically by first compressing the input (encoder) and decompressing it back (decoder) to match the original input. The learning is aided by using distance function that quantifies the information loss that occurs from the lossy compression. So learning in an autoencoder is a form of unsupervised learning (or self-supervised as some refer to it) - there is no labeled data.
- Instead of just learning a function representing the data ( a compressed representation) like autoencoders, variational autoencoders learn the parameters of a probability distribution representing the data. Since it learns to model the data, we can sample from the distribution and generate new input data samples. So it is a generative model like, for instance, GANs.
-
Does GANs use a probability distribution?
Answer
- Nope
- What is the idea of GANs?
Answer
- Train an NN that produces images based on an input of some images. This part is called Generator Network. The goal of the Generator Network is, to improve its ability to produce images so that the discriminator will fail.
- The second actor is the Discriminator Network. Its task is to differentiate between the fake image from the generator and real images from the training set.
-
How does the loss function look like?
Answer

Source: Karlsruhe University of Applied Science - Yurii Tolochko, 2019
-
What is a drawback of the loss function and how to solve it?
Answer
When actually training the generator, it was found that the objective function does not work very well because of gradient plateau (flat gradients means very slow if any training).
Solve it by:
- For this reason the generator objective function is “flipped”.
- An intuitive interpretation is that now instead of minimizing the probability of the discriminator being correct, we maximize the probability of it being wrong.
- What do Vannila GANs use?
- Only fully connected layer but no CNN
- When GANs use CNNs, the discriminator uses a normal cnn. What about the generator?
- it uses an upsampling CNN with transpose convolution operations (Recall Image segmentation problems)
- How does deepfakes video work?
- Rely on GANs for data generation.
- Combines existing videos with source videos to create new, almost indistinguishable videos of events that are actually completely artificial


- What is the idea of weight initialization?
Answer
- Using better weight initialization methods leads to a better gradient transport through the network and a faster convergence
-
What are different approaches for weight initialization?
Answer
-
Weights = 0: Bad Idea - no training at all

Source: Source: https://github.com/Intoli/intoli-article-materials/tree/master/articles/neural-network-initialization
-
Random initialization with mean at 0 and small variance. Seems like it works quite well, although it heavily depends on the used distribution function

-
Problem:
-
Different variance values for weight initialization lead to vastly different activations, from vanishing to exploding gradients. Linear activation function

Source: https://intoli.com/blog/neural-network-initialization/
-
-
Why is it important to keep the variance of gradient and activation values of each layer constant?
Answer
- Otherwise it would lead to vanishing or exploding gradients, which leads to problems in training.
-
For linear functions it is easier to have constant variances
Answer

Source: Karlsruhe University of Applied Science - Yurii Tolochko, 2019
-
Constant variances for NON linear, like relu looks like:
Answer

Source: Delving Deep into Rectifiers: Surpassing Human-Level Performance on ImageNet Classification. He et. al.
-
What is Batch Normalization and why should it be applied?
Answer
Why: Covariate Shift ends in bad performance
But the problem appears in the intermediate layers because the distribution of the activations is constantly changing during training. This slows down the training process because each layer must learn to adapt themselves to a new distribution in every training step. This problem is known as internal covariate shift.
Batch normalization: theory and how to use it with Tensorflow

That simply means that the datapoints can vary extremly which forces the intermediate layers to readjust.
Where and on what do we do Batch Norm?
- Usually for the intermediate layers, but it can also be applied on the input layer (taking the raw values). It is not applied on the values itself but on the result of the x vector times the weight vector w, which is z. Z is passed to the activation function and that's why it has to be normalized beforehand. (Sometimes the result of the activation is normalized but this doesn't make sense to me)

Source: Andrew Ng, Deep Learning, Coursera
-
What is the idea of Batch Normalization?
Answer
- BN prevent a neural net from exploding or vanishing gradient and reducing learning time due to internal covariate shift. It forces the activations to have mean 0 and unit variance by standardizing it.
-
What are the steps for Batch normalization?
Answer

-
Should Batch Normalization always be applied?
Answer
No, with the following explanation:

-
What is the idea of Dropout?
Answer
The idea is to prevent an NN from overfitting by removing a specific percentage of neurons from a layer. Often used percentage is between 0.5 and 0.25.

Source: https://static.commonlounge.com/fp/original/aOLPWvdc8ukd8GTFUhff2RtcA1520492906_kc
-
Explain Cosine Similarity
Answer
- Measures similarity between two word vectors
-
Measures the angle of two words rather than their actual distance to each other.

Source: https://neo4j.com/docs/graph-algorithms/current/labs-algorithms/cosine/

-
Explain Bleu Score an when to use it
Answer
BLEU (bilingual evaluation understudy) is an algorithm for evaluating the quality of text which has been machine-translated from one natural language to another. Quality is considered to be the correspondence between a machine's output and that of a human: "the closer a machine translation is to a professional human translation, the better it is"
Scores are calculated for individual translated segments—generally sentences—by comparing them with a set of good quality reference translations. Those scores are then averaged over the whole corpus to reach an estimate of the translation's overall quality. Intelligibility or grammatical correctness are not taken into account
BLEU's output is always a number between 0 and 1. This value indicates how similar the candidate text is to the reference texts, with values closer to 1 representing more similar texts. Few human translations will attain a score of 1, since this would indicate that the candidate is identical to one of the reference translations. For this reason, it is not necessary to attain a score of 1. Because there are more opportunities to match, adding additional reference translations will increase the BLEU score


- Berechne Precision für jedes N-Gram (wähle min von ref und cand)
- Multipliziere über alle n-gram_precision werte
- Wende Penalty für kurze Sätze an
-
What are the disadvantages of the Bleu Scores?
Answer
- No distinction between content and functional words (ESA - NASA).
- Weak in capturing the meaning and grammar of a sentence
- Penalty for short sentences can have strong impact
-
Why do we need RNNs and not normal Neural Nets?
Answer
- Inputs and outputs can be different lengths in different examples.
- Doesn't share features learned across different positions of text
-
What's the architecture of a Vanilla RNN?
Answer
- a is usually referred as the hidden state, whereas I just see it as the activation from the neuron.
- x^ is a word of the sentence at position t (same as at time t)
- As an activation function mostly tanh/Relu is used, but only for the hidden state (a)
- For y_hat we usually use a sigmoid function
- a<0> (hidden state) is initialized with zero.
-
g ist the function (It's actually just the layer and what it does is it has a weight vector for incoming a that is multiplied with the activation value and a weight vector for the new word x that is multiplied with the new word plus a bias), this results in a. g also has a weight vector for calculating y. It takes that vector and multiplies it with the previously calculated a<0> plus a bias. The result is the word at position bzw. y

Source: Andrew Ng, Deep Learning, Coursera

-
What is the loss of the RNN?
Answer

Source: Fei-Fei Li & Justin Johnson & Serena Yeung
-
What are problems of Vanilla RNNs?
Answer

- not good in learning long-term dependencies
- What are LSTMs and why are they needed?
- Vanilla RNNs are not good in learning long-term dependencies. LSTMs can be seen as a fancier family of RNNs.
- Of which components is a LSTM composed?
- Cell State: C(t) Internat cell state (memory)
- Hidden State: External hidden state to calculate the predictions
- Input Gate: Determines how much of the current input is read into the cell state
- Forget Gate: Determines how much of the previous cell state is sent into the current cell state
-
Output Gate: Determines how much of the cell state is output into the hidden state


-
What is the sigmoid function for?
Answer
- The output is a value between 0 and 1. If the network thinks something should be forgotten than it tends to be 0, if it wants to update than it is 1. This is because the output is mostly used for multiplication.
- What is the tanh function for?
Answer
- tanh function squishes values to always be between -1 and 1. This helps preventing the vectors of having too large numbers.
- What is the cell state for?
Answer
- Memory of the network. As the cell state goes on its journey, information gets added or removed to the cell state via gates.
-
What does the forget gate do?
Answer
- Input: Hidden + word (xi)
-
Based on the hidden state, the forget gate decides whether to update or if the information should be thrown away (but applied on the hidden state of the previous time stamp, so it kind of cleans up the past)

-
What does the input gate do?
Answer
- Input: hidden + word (xi)
- Pass both to sigmoid function to decide which values should be updated
- Pass both to tanh to squish values between -1 and 1
-
Multiply sigmoid output with tanh output, to keep important values of tanh output

Source: Source: https://towardsdatascience.com/illustrated-guide-to-lstms-and-gru-s-a-step-by-step-explanation-44e9eb85bf21
-
How is the cell state computed?
Answer
- Input: previous cell state + forget gate output + input gate output
- Multiply prev cell state pointwise with forget gate output
- Add input gate output to the result
-
What does the output gate do?
Answer
- Input: previous cell state + prev hidden state + word(xi)
-
Calculates the new hidden state by multiplying cell state with the output of sigmoid output gate output

-
How does GRU work?
Answer
- Newer generation of RNN
- got rid of cell state
- use hidden state to transport information
- little speedier to train then LSTM’s
-
Reset gate and update gate

-
Let the network learn when to open and close the gates, i.e. update the “highway” with new information.
- Therefore, instead of updating the hidden state at every RNN cell, the network can learn itself when to update the hidden state with new information.

Source: https://wagenaartje.github.io/neataptic/docs/builtins/gru/
- Reset Gate:
- Input: Weight Matrix W, prev hidden state, and word (x)
- It first computes the reset value. That indicates which value of the input are important and which aren't (recall sigmoid value → 0)
- Pass the function of multiplication of prev hidden state and reset vector to the tanh function. This deactivates some prev hidden state values
-
Update Gate:
-
Input: Weight, prev hidden state, x

-
-
Compute Output


I like this illustration more:

Quote: "Similar to normal RNNs the input gets multiplied by the weight matrix and is added to a hidden layer. However here the input is added to h˜ . The r is a reset switch which represents how much of the previous hidden state to use for the current prediction. Coincidentally there is also a neural network for this reset switch which learns how much of the previous state to allow for predicting the next state. z represents whether to only use the existing hidden state h or use its sum with h~(new hidden state) to predict the output character."
-
What is the idea of Attention models?
Answer
- The main idea of the attention mechanism is to imitate the human behaviour of text processing by "reading" a chunk of the input sentence and process it instead of the whole sentence.
- The more words the encoder processed, the less information about the single words is contained in the vector. Attention models try to bypass this by save each output vector ht from a state. In contrast to vanilla Seq2Seq-Models, another processing layer between encoder and decoder was added which calculates a score for each ht. The scores indicate how much attention the decoder should pay on a specific ht.
- → Goal: Increase performance for long sentences
-
Describe the algorithm of Attention Models
Answer

-
Shorten the algorithm in your own words
Answer
- Choose window of words you want to incorporate its attention
- Save the hidden states of them and compute a score for these hidden states
- Apply softmax on the scores to get a probability distribution, resulting in attention weights
- Compute the context vector by attention weights times hidden states
- Take context vector and prev hidden state to compute the next word
-
What is the advantage we have with ConvNets for NLP?
Answer
-
We can compute different convolutions in parallel for our input vector

Source: https://machinelearningmastery.com/best-practices-document-classification-deep-learning/
-
-
How does CNN for NLP work?
Answer
- Use filter for multiple words (Similar approach to n-gram)
- Vanilla CNNs can be used in One-to-One, Many-to-One or Many-to-Many Architecture.
- Used in Text Classification, Sentiment Analysis and Topic Categorization
- Problem: Looses the relation information between words, caused by max pooling layers.
-
How can CNNs be combined with Seq2Seq Models?
Answer
- Each layer has two Matrices
- W - Kernel for convolving input
- V - used for GRU computation
-
GRU calculation decides based on the sigmoid outcome how much of the conv output is propagated to the next level.

-
Describe the basic steps of Speech Recognition
Answer
- Transform sound wave to spectrogram using fourier transformation
- Spectogram is splitted into multiple parts, e.g. 20 ms blocks, resulting in 50 block for a second. A second usually contains between 2 and 3 words.
-
Problem: Get rid of repeated characters and separate them into words (CTC = Connectionist Temporal Classification)

Source: Hannun, "Sequence Modeling with CTC", Distill, 2017.
-
How can the problem of removing repeated characters be solved?
Answer
- Apply Beam Search and take the most likely output
-
Explain a simple approach for Speech to Text
Answer

-
Explain Backpropagation through time (BPTT)
Answer
-
Gather loss for all outputs and at every timestamp and sum them up. (but for each state)
Loss = Sum (y_t - y_t_hat)
-
Apply "normal" backpropagation to each state, keep in mind the partial derivative’s

-
-
What is Truncated Backpropagation through Time?
Answer
- The longer the sequence is the harder it is to calculate the gradients -> Solution: truncated backprop
-
BPTT is periodically on a fixed number of timesteps applied

-
What is a Language Model?
Answer
- It gives you a probability of a following sequence of words/characters for a given word. P(Y) = p(y1 ,y2 ,y3 ,...,yn )
- This effectively estimates the likelihood of different phrases (in a language).
→ Simpler models may look at a context of a short sequence of words, whereas larger models may work at the level of sentences or paragraphs.
Useful for:
- Speech Recognition
- Machine translation
- Part-Of-Speech (POS) tagging
- Optical Character Recognition (OCR)
-
Explain the idea of N-Grams
Answer
- Coalition of n words to "one"
- 1-gram = Unigram
- 2-gram = Bigram
- Can be used to calculate the probability of a given word being followed by a particular one.
- P(x1, x2, ..., xn) = P(x1)P(x2|x1)...P(xn|x1,...xn-1)
-
Define One-Hot Encoding
Answer
-
Encoding categorical variable so that NN can handle it. We need a vocabulary V with all words in it.

Source: https://tensorflow.rstudio.com/guide/tfdatasets/feature_columns/
-
-
What are pros and cons of one hot encoding for text data?
Answer
Pros:
- Can be used on different stages for example words or letters
- Can represent every text with a single vector
Cons: There are a few problems with the one-hot approach for encoding:
- The number of dimensions (columns in this case), increases linearly as we add words to the vocabulary. For a vocabulary of 50,000 words, each word is represented with 49,999 zeros, and a single “one” value in the correct location. As such, memory use is prohibitively large.
- The embedding matrix is very sparse, mainly made up of zeros.
- There is no shared information between words and no commonalities between similar words. All words are the same “distance” apart in the n-dimensional embedding space.
- Example of one hot encoding


-
What is the idea of word embeddings?
Answer
- Encoding for meaning and similarity of words in form of a vector that exists of latent dimensions (latent feature space)
- Main motivation: we want to capture some intrinsic “meaning” of a word and be able to draw comparisons between words
-
Example of latent feature space:

Source: https://medium.com/@jayeshbahire/introduction-to-word-vectors-ea1d4e4b84bf
-
What are word embeddings used for?
Answer
- Semantic Analysis
- Named Entity Recognition
- Weights initilization
- What is a problem with word embeddings?
Answer
- Need huge corpora to train, that's why mostly pre-trained embeddings are used
- What is the basic approach of word embeddings?
Answer
- Words that appear in similar contexts (close to each other) are likely to be semantically related.
- If we want to “understand” the meaning of a word, we take information about the words it coappears with.
-
How does the training process look like?
Answer
We want to have p(context|wt), where wt is the word we are looking at and context the surrounding words.

- Used Loss function: -log[p(context|wt)] //Somewhat like cross entropy loss function
- Optimize NN based on Used Loss Function
- If we can predict context we have good embedding
- delete classifier keep embeddings
Source Illustration: https://laptrinhx.com/get-busy-with-word-embeddings-an-introduction-3637999906/
-
What was an early attempt of word-embeddings?
Answer
- Neural probabilistic Language Models
- → Generate joint probability functions of word sequences
- What were shortcomings of Neural Probabilistic?
Answer
- It was only looking at words before but not at words after the predicted one
-
How does Skip-Gram work?
Answer
blue is the given word to predict the surroundings → + + + C + + +

Source: http://mccormickml.com/2016/04/19/word2vec-tutorial-the-skip-gram-model/
-
How does word2vec work?
Answer
Idea relies on estimating word co-occurences.
For Skip-gram:
- Select Windows size
- Select a word wt
- For a selected word wt in our training corpus look a randomly selected word within m positions of wt.
- train to predict correct context words
- Predict by softmax classifier

-
What is a problem with word2vec?
Answer
- At each window the normalization factor over the whole vocabulary has to be trained (e.g. 10.000 dot products) → computationally too expensive
- How can the problems of word2vec be solved?
Answer
- Applying negative sampling
-
What is negative sampling
Answer
Main idea: we want to avoid having to train the full softmax at each prediction. “A good model should be able to differentiate data from noise by means of logistic regression”.
- Train two binary logistic regressions
- One for the true pair (center word, output)
- One for random pairs (center word, random word)
Exaxmple:
-
"I want a glass of orange juice to go along with my cereal." For every positive example, we have k-1 negative examples. Here k = 4.

- Train two binary logistic regressions
-
How does CBOW work?
Answer
- Target is a single word → C C C + C C C
- Context is now all words within the context window of size m.
- Average embeddings of all context words
-
Differentiate CBOW from Skip-gram
Answer
According to the author, CBOW is faster but skip-gram but does a better job for infrequent words.

Source: https://www.knime.com/blog/word-embedding-word2vec-explained
-
What does GloVe?
Answer
- Calculate co-occurrence directly for the whole corpus
- We go through the entire corpus and update the co-occurrence counts.

- Go through all pairs of words in the co-occurrence matrix.
- Minimize distance between dot product of 2 word embeddings
- Function f(Pij) - allows one to weight the co-occurrences. E.g. give a lower weight to frequent co-occurrences.
- Trains much more quickly and with small corpora
- How can word embeddings be evaluated?
-
Intrinsic Evaluation
- Evaluate on a specifically created subtask


Source Illustration: Pennington, Socher, Manning: https://nlp.stanford.edu/projects/glove/
- Another intrinsic evaluation approach is comparing with human judgments.
-
Extrinsic Evaluation
- How good are our embeddings for solving actual tasks?
- Example of such task is named entity recognition.
- Information on dependence on Hyperparameters

Source Slides: Socher, Manning
-
What are advantages of Character Level Models?
Answer
- Vocabulary is just of the size of the alphabet + punctuation
- No need for tokenization
- No unknown word (out of vocabulary)
- Can learn structures data encoded by characters and only plain text (For example gen informations)
- What are disadvantages of Character Level Models?
Answer
- Require deeper RNN's because there are more characters in a sentence than words
- Generally worse capturing long-distance dependencies
- In order to model long term dependencies, hidden layers need to be larger
-
What are different types of NNs?
Answer
One to One: Image Classification

Illustration: Andrey Karpathy. The Unreasonable Effectiveness of Recurrent Neural Networks
One to Many: Generating caption for an image

Source: https://medium.com/swlh/automatic-image-captioning-using-deep-learning-5e899c127387
Many to One: Sentiment Classification

Source:
Many to Many (Sequence2Sequence): Machine Translation where length of input and output can be different or Entity Recognition

-
Of what does the Sequence2Sequence architecture exist?
-
How can the process of predicting in the decoder part be improved?
Answer
- Further Improvements Remember, we are creating our word vector based on a probabilistic model. Predicting the output vector using a greedy approach may not be the best solution.
-
Describe Beam Search
Answer
Beam search is an approximate search algorithm, so no guarantee to find a global maximum. Beam Search is a heuristic algorithm - it does not guarantee the optimal solution.
Instead of selecting the first best word, we take the k best matching words and calculate the probabilities for all the next words. Out of these, choose again the top b matching samples and repeat. If we choose b=1, than beam seach is a greedy search.

Source: https://d2l.ai/chapter_recurrent-modern/beam-search.html
-
What is a painpoint of beam search?
Answer
The probability of a sentence is defined as product of probabilities of words conditioned on previous words. Due to compounding probabilities, longer sentences have a lower probability by definition. Shorter sentences can have higher probability even if they make less sense.
-
How can the painpoints of beam search be solved?
Answer
We need to normalize sentences by their length multiply the probability of a sequence by its inverse length.

-
Describe the light normalization implementation
Answer
- run, select and save top 3 most likely sequences for every sequence length (e.g. Defined max sequence length = 5 → 1,2,3,4,5)
-
This results in a set of size 3 containing
- 1 sequences (single words, e.g.: ("Oh","donald","trump"), ("Go","Barack","Obama"), (...) )
- 2 sequences (two word sequences)
- Up to N (here 5) sequences
-
For every sequence length run a normalized probability score calculation and assign it to every sequence.
-
Select the sequence with highest probability of all
-
Which two errors can arise with Beam Search?
Answer
- Model errors from our RNN
-
Search errors from our beam search hyperparameter


- Describe the idea of RL
Answer
- The idea of RL is that an algorithm learns a task by itself without precise instructions from a human. A developer defines the goal and provides it with a reward. In addition, it must be defined which actions the model is allowed to perform (actions). The model explores several strategies over a period of time and acquires the best one. This is also known as trial-and-error search.
- Describe the terminology of RL
Answer
- Environment: The abstract world that everything happens in.
- Agent: The Algorithm which interacts with the environment
- State: Part of the environment. Every action of the agent with the Env changes their state
- Reward: Every interaction of an agent with the environment produces a reward. Reward is a signal of how good or bad the interaction was in terms of some goal. At some point, the interaction is terminate. The final goal of the agent is to maximize the cumultative reward
- Policy: The rules by which the agent acts (π)
- When to use Reinforcement Learning
Answer
- If the problem is an inherently sequential decision-making problem i.e. a board game like chess or games in general.
- If the optimal behaviour is not known in advance (unsolved games without "perfect strategy")
- When we can simulate the system behaviour as good as possible to imitate the real world
- Solving problems with a non-differentiable loss function
-
RL is separated into Model-Free RL and Model-Based RL. Name subcategories and associated algorithms
Answer
Model-Free RL:
- Policy Optimization (DDPG, Policy Gradient)
- Q-Learning (DQN, DDPG)
Model Based RL:
- Learn the Model (World Models)
- Given the Model (AlphaZero)

-
Tasks of the Environment
Answer
- Interface: An Env need to provide an interface with which the agent could interact
- Calculating Effects: For an action performed by the agent, the Env needs to calculate the:
- next state
- reward for this action
- Describe Model Free approaches
Answer
- The focus is on finding out the value functions directly by interactions with the environment. All Model Free algorithms learn the value function directly from the environment. That's not entirely true. Looking at Policy Gradient approaches we do not learn the value function.
-
Define the Markov Decision Problem (MDP)
Answer

- The MDP is inspired by the theorem "The future is independent of the past given the present". (Markov Property) That means, to calculate values for the future state
$S_{t+1}$ , only the state$S_t$ counts. It should keep all the information from already passed states.
- The MDP is inspired by the theorem "The future is independent of the past given the present". (Markov Property) That means, to calculate values for the future state
-
Describe the Markov Property
Answer
-
A state contains the Markov property. This gives the probabilities of all possible next states under the condition of the current state in a matrix P. (Markov Property: Capture all relevant information from the past)

-
-
What is the discounted reward?
Answer
- It is the discounted sum over all rewards that happened in the future. Intuitively speaking it is something like a measurement how efficient the agent solved an episode. E.g.: An agent decided to walk loops in a GridWorld scenario and after a few loops he changed his route towards the goal and reached it. The discounted is still good but it would have been better if he had taken the direct path, because reward further in the future are discounted the most. Hence, the final is always discounted most.
- Recall that return is the total discounted reward in an episode:
- G_t = R_t+1 + γR_t+2 + ... + γT-1RT
-
What is a policy?
Answer
A policy is the agent’s behaviour. It is a map from state to action.
- Deterministic policy: a=π(s).
- Stochastic policy: π(a|s) =P[A=a|S=s].
-
What is the State Value Function?
Answer
- Value function for a state is the reward under the assumption of taking the best action/policy from there. → Kind of the best Q Value
-
The Value function takes the reward of all possible next states into account (and the next rewards of those states, which is G) and calculates the value by multiplying the action probability (policy) by the reward for the particular state.

However the description above can be written differently (much smarter so that we can apply dynamic programming on it)!
Explanation of the belman equation:

Discounted Reward: That's just the sum of all rewards (discounted with gamma, but this isn't important to understand the concept here).

Defining G_t brings us to the Expectation_policy

of

The expectation is mathematically defined by the probability (here Pi/policy) times over all elements (here G_t). The policy/probability is the probability of a specific action under state s.
DP, MC and TD Learning methods are value-based methods (Learnt Value Function, Implicit policy).
-
What is the Action Value Function?
Answer
- Equation almost the same as State Value Function

-
Why do we need the bellman equation and how to solve it?
Answer
- Reason: Computing entire value function for some RL use case is too complex/time consuming, therefore, breaking it down to sub equations.
-
Usually solved by using backup methods, we transfer then the information back to a state from its successor state. Therefore we can calculate paths separately?

Can also be applied to q-values!
-
How is optimal policy defined?
Answer
- Optimal policy is defined as that policy which has the greatest expected return for all states
-
We can explicitly write out this requirement for state-value functions and state-action value functions.

-
The optimal policy and the bellman equation leads to the Bellman optimality equation
Answer
- By that we formulate the equation without referring to a specific policy (that's why a star is beneath v)
- "Intuitively, this says that the value of a state under an optimal policy must equal the expected return for the best action from that state."
-
The next image shows this for q values. The order would be that we select the best action at the current state s, following the optimal policy which results in the best value function value.

-
What is the Markov Reward Process (MRP)?
Answer
-
MRP is a tuple of (S,P,R, gamma)
- S is a state space
- P is the state transaction function (probability function)
- R is the reward function with E(R_t+1|S), i.e. how much immediate reward we would get for a state S.
-
Everything results in G_t, which is the total discounted reward for a time step t. The goal is to maximize this function:

-
Gamma is the discount factor which is applied to future rewards. This should play in less than the "closer". This also leads us to avoid infinite returns in Markov processes.
- Another important point is the value function V(S) which can be adapted to different use cases. The original MDP uses the Bellman Equation:

For gamma = 1 we aim at long term rewards and for gamma = 0 we tend to short term profit.
In the following example, a discount of 0.9 is used from the final state reward(Peach) to the start state of the agent (Mario).

However, to solve the Bellman equation we need almost all the information of our environment: Markov property and calculate v* for all other states. Since this rarely works, many RL methods try to approximate the Bellman function with the last done state transition instead of having a complete knowledge of all transitions.
-
-
What is the difference between State Value V(s) and Action Values Q(s,a)?
Answer
- Basically two different ways to solve reinforcement learning problems.
- V_Pi(s) describes the expected value of following the policy Pi when the agent starts at the state S. Basically, the action is greedy.
- Q_Pi (s,a) describes the expected value when an action a is taken from state S under policy Pi.
-
What is the relationship between Q-Values (Q_Pi) and the Value function (V_Pi)?
Answer

- You sum every action-value multiplied by the probability to take that action (the policy 𝜋(𝑎|𝑠)*π(a|s)).
-
If you think of the grid world example, you multiply the probability of (up/down/right/left) with the one step ahead state value of (up/down/right/left).
-
Describe the idea of Q-Learning
Answer
- The goal of Q-learning is to learn a policy, which tells an agent what action to take under what circumstances.
- Approximation of the MDP with the approach of action states without solving the Bellman equation. It is a MDP with finite and small enough state space and actions
-
How can a grid world problem be solved with Q-learning?
- Initialize a table for each state-action pair
- Fill in the table step by step while interacting with the environment
-
Calculate the Q-Values

Source: http://users.isr.ist.utl.pt/~mtjspaan/readingGroup/ProofQlearning.pdf
-
Repeat step 2 + 3 for N epochs
-
Check how well the learned table approximated the State Values (V(s)) for the Bellmann equation. This could look like the following:

Source: https://towardsdatascience.com/qrash-course-deep-q-networks-from-the-ground-up-1bbda41d3677
-
What is Policy Iteration?
Answer
Policy iteration includes: policy evaluation + policy improvement, (both are iteratively)
- Uses also bellman equation but without maximum.
- For each state S we check if the Q-value is larger than the value value: q(s,a) > v(s) under the same policy (test different policies). If the Q-Value returns a larger value, the strategy performs better and we switch to it.
Sometimes it only finds local minima
- Choose a policy randomly (e.g. go in each direction with prob = 0.25)
- Do policy evaluation: Calculate the Value for each state
- Do policy improvement: Change an action a (that results in a new policy pi') and see if the values are better. If so, switch to the new policy,. (We could use the Value function to do this successively for each state
-

-
Example of Policy Iteration for Monte Carlo
-
What is Value iteration?
Answer
Value iteration includes: finding optimal value function + one policy extraction
Usually finds global minima
It is similar to policy iteration, although it differs in the following:
- Value Iteration tries to find the optimal value function rather than first the optimal policy. Once the best value function was found, the policy can be derived.
- It shares the policy improvement function/approach and a truncated policy evaluation
For value iteration it can be less iterations but for one iteration there can be so much of work, because it uses bellman maximum equation. For the policy iteration more iterations.
-
Compare Policy Iteration with Value Iteration
Answer
-
"In my experience, policy iteration is faster than value iteration, as a policy converges more quickly than a value function. I remember this is also described in the book."
-
Policy Iteration: Sometimes it only finds local minima
- Value Iteration: Finds global minima
-
-
What is a disadvantage of policy iteration?
Answer
- Can get stuck in a local minimum
-
How can the disadvantages of policy iteration be compensated?
Answer
- Early stopping
-
What is the idea of the Monte Carlo method?
Answer
In General: A statistical approach that averages the mean for a state over an episode.
- Initialize rewards randomly
- Run through a specific number of episodes (e.g. 1000)
- ~~Calculate the discounted reward for each state~~
- Apply either:
- First visit method: Average returns only for first time s is visited in an episode.
- Every visit method: Average returns for every time s is visited in an episode.
(Check again if example is correct (might be wrong))

-
Give a summary of Monte Carlo
Answer
- MC methods learn directly from episodes of experience.
- MC is model-free: no knowledge of MDP transitions / rewards.
- MC uses the simplest possible idea: value = mean return.
- Episode must terminate before calculating return.
- Average return is calculated instead of using true return G.
- First Visit MC: The first time-step t that state s is visited in an episode.
- Every Visit MC: Every time-step t that state s is visited in an episode.
- https://github.com/omerbsezer/Reinforcement_learning_tutorial_with_demo/blob/master/README.md#MonteCarlo
-
What is the idea of Temporal Difference Learning?
Answer
-
Temporal Difference Learning (also TD learning) is a method of reinforcement learning. In reinforcement learning, an agent receives a reward after a series of actions and adjusts its strategy to maximize the reward. An agent with a TD-learning algorithm makes the adjustment not when it receives the reward, but after each action based on an estimated expected reward.
Source: https://de.wikipedia.org/wiki/Temporal_Difference_Learning
-
Is an on-policy learning approach

Source: https://github.com/omerbsezer/Reinforcement_learning_tutorial_with_demo
-
Compared to DP and MC, which are both offline because they have to finish the epoch first, TD is a mix of the two. Monte Carlo has to run a branch of States, DP even has to run all of them.
- Summary Temporal Difference Learning
- TD methods learn directly from episodes of experience.
- TD updates a guess towards a guess
- TD learns from incomplete episodes, by bootstrapping.
- TD uses bootstrapping like DP, TD learns experience like MC (combines MC and DP).
- MC-TD Difference
- MC and TD learn from experience.
- TD can learn before knowing the final outcome.
- TD can learn online after every step. MC must wait until end of episode before return is known.
- TD can learn without the final outcome.
- TD can learn from incomplete sequences. MC can only learn from complete sequences.
- TD works in continuing environments. MC only works for episodic environments.
- MC has high variance, zero bias. TD has low variance, some bias.
- What is the idea of Dynamic Programming?
-
DP is a general framework concept. It is derived from the divide and conquer principle, where DP tries to break down a complex problem into sub-problems that are easier to solve. In the end, the solutions of the subproblems are merged to solve the main problem.
In order to apply it, the following properties must be given:
- The optimal solution can be divided into subproblems
- Subproblems occur more often
- Subproblems solutions can be cached
- Are the dynamic programming requirements met for a MDP?
- Bellman equation (is a DP approach) gives us a recursive decomposition
- The value function stores the action (serves as a cache) and can thus be used for DP
- What is meant by full backups vs sample backups and shallow vs deep?
- The history of the learned. Full backup utilizes a lot of paths and states, whereas sample backup is a branch in the tree diagram.
- Shallow means that it does not go very deep into the tree before making an update (fast), whereas deep waits for a complete episode.
-
-
What is the difference between on-policy and off-policy?
Answer
- Online: during the job: E.g TD Algorithm
-
On policy learning (Monte Carlo): Improve the same policy that is used to make decisions (generate experience).
-
Off policy learning (Q-Learning (TD-Algorithm)): Improve policy different than the one used to generate experience. Here, improve target policy while following behaviour.
- Target policy - what we want to learn. Therefore, we evaluate and improve upon.
- Behaviour policy - what we use to generate data.
Motivation for having 2 policies is the trade-off between exploration and exploitation. In order to know what actions are best, we need to explore as much as possible - i.e. take suboptimal actions as well.
Target policy π(St) is greedy w.r.t. Q(s,a), because we want our target policy to provide the best action available.
Behavior policy μ(St) is often 𝜀-greedy w.r.t. Q(s,a).
- 𝜀-greedy policy is an extension of greedy policy
- With probability 𝜀 it will output a random action.
- Otherwise, it output is the best action.
- 𝜀 controls how much exploration we want to allow.
This combination of two policies let’s us combine “the best of both worlds”. Our behavior policy gives enough randomness to explore all possible state-action pairs. Our target policy still learns to output the best action from each state.
-
What is the difference between Episodic and Continuous Tasks?
Answer
- Episodic task: A task which can last a finite amount of time is called Episodic task ( an episode )
- Continuous task: A task which never ends is called Continuous task. For example trading in the cryptocurrency markets or learning Machine learning on internet.
-
Differentiate Exploitation from Exploration
Answer
- Exploitation: Following a strict policy by exploiting the known information from already known states to maximize the reward.
- Exploration: Finding more information about the environment. Exploring a lot of states and actions in the environment by avoid a greedy policy every action.
-
What is the sample efficiency problem?
Answer
- After improving our policy by an experience we do not use this information anymore, but with future experiences, which is not sample efficient.
- Define Experience Replay
Answer
- Another human behaviour imitation technique is called experience replay. The idea behind experience replay is, that the agent builds a huge memory with already experienced events.
- For this, a memory M is needed which keeps experiences e. We store the agents experience et=(st,at,rt,st+1)e_{t}=\left(s_{t}, a_{t}, r_{t}, s_{t+1}\right)et=(st,at,rt,st+1) there. This means instead of running Q-learning on state/action pairs as they occur during simulation or actual experience, the system stores the data discovered for [state, action, reward, next_state] - typically in a large table. Note this does not store associated values - this is the raw data to feed into action-value calculations later.
- The learning phase is then logically separated from gaining experience, and based on taking random samples from this table which does not stand in a directional relationship. You still want to interleave the two processes - acting and learning - because improving the policy will lead to different behaviour that should explore actions closer to optimal ones, and you want to learn from those.
- What are the advantages of experience replay?
Answer
- More efficient use of previous experience, by learning with it multiple times. This is key when gaining real-world experience is costly, you can get full use of it. The Q-learning updates are incremental and do not converge quickly, so multiple passes with the same data is beneficial, especially when there is low variance in immediate outcomes (reward, next state) given the same state, action pair.
- Better convergence behaviour when training a function approximator. Partly this is because the data is more like i.i.d. data assumed in most supervised learning convergence proofs.
-
What are advantages of Experience Replay?
Answer
- This turns our RL problem into a supervised learning problem!
- Now we reuse our data, which is far more sample efficient.
-
Before, we worked with non i.i.d., strongly correlated data - we always saw states
one after the other in the trajectory (now we randomly sample)
- We break the correlation by presenting (state,value) pairs in a random order.
- This greatly increases the convergence rate (or even makes possible).
-
What are the disadvantages of experience replay?
Answer
- It is harder to use multi-step learning algorithms, such as
$Q(\lambda)$ , which can be tuned to give better learning curves by balancing between bias (due to bootstrapping) and variance (due to delays and randomness in long-term outcomes). Multi-step DQN with experience-replay DQN is one of the extensions explored in the paper Rainbow: Combining Improvements in Deep Reinforcement Learning.
- It is harder to use multi-step learning algorithms, such as
-
How can we re-use the data?
Answer
- Saving experiences (Gather data)

- Apply Experience Replay
- Define cost function, such as Least Square
- Random sample (state, value) pair from experience
- Apply SGD Update
- What is the idea of Deep Q-Learning (DQN)?
DQN is quite young and was introduced only in 2013. It is an end-to-end learning for the Q(s,a) values for pixels with which well-known Atari games can be solved. Two main ideas are followed:
- Experience Replay (kind of generator for the data generation of the training process).
- Fixed Q-Targets:
- Form of off-policy method
- Direct manipulation of a used Q Value leads to an unstable NN.
- To solve this two parameters are needed:
- current Q values
- target Q values
- During training, we update the target Q values with Stochastic Gradient Descent. After the epoch, we replace our current weights with the target weights and start a new epoch.
-
So far we have seen Value Based RL which relies on improving the model by the state value function, but there is also the possibility to learn a policy directly. What are the advantages?
Answer
- Better convergence properties
- When the space is large, the usage of memory and computation consumption grows rapidly. The policy based RL avoids this because the objective is to learn a set of parameters that is far less than the space count.
- Can learn stochastic policies. Stochastic policies are better than deterministic policies, especially in 2 players game where if one player acts deterministically the other player will develop counter measures in order to win.
- What are disadvantages of Policy Based RL?
Answer
- Typically converge to a local rather than global optimum
- Evaluating a policy is typically inefficient and high variance policy based RL has high variance, but there are techniques to reduce this variance.
-
How can we fix a RL case where the problem is too large (keeping track of every single state or state-action pair becomes infeasible)
Answer
-
Value Function Approximation. Therefore we extend the original Value function of a state and the q- values with a weight parameter.

-
-
What kind of function can be used for Value Function approximation? Elaborate.
Answer
-
Linear combinations of features:
-
In this case we represent the value function by a linear combination of the features and weights.

- This lets us generalize from seen states to unseen states, by optimizing the function to already seen value function for a state and apply the parameters for unseen states.
Big advantage of this approach - it converges on a global optimum.
-
-
Neural networks:
- Most general goal: find optimal parameter w by finding its (local) minimum. Cost function: mean squared error.
- ~~Monte Carlo Method:~~
- In which step during the value function approximation is the approximation checked?
- Policy evaluation

Slide: D. Silver 2015.
-
-
What are Policy Gradient Methods?
Answer
- Return a matrix of probabilities for each action via softmax
- Exploration is handled automatically
- We don't care about calculating accurate state values
- Adjust the action probabilities depending on rewards
- What is a parametrized policy (belongs to Policy Gradient Methods)?
Answer
- Assign a probability density to each action
- Such policies can select actions without consulting a value function
- As we will see, the most sophisticated methods still utilize value functions to speed up learning, but not for action selection (but this is considered as Actor-Critic)
-
A stochastic Policy is a Policy Based RL. Why would we choose that?
Answer
At first it is important to note that stochastic does not mean randomness in all states, but it can be stochastic in some states where it makes sense. Usually maximizing reward leads to deterministic policy. But in some cases deterministic policies are not a good fit for the problem, for example in any two player game, playing deterministically means the other player will be able to come with counter measures in order to win all the time. For example in Rock-Cissors-Paper game, if we play deterministically meaning the same shape every time, then the other player can easily counter our policy and wins every game.
- I.e. at every point select one of the three actions with equal probability (0.33).
- Therefore, a stochastic policy is desirable!

-
Another Policy Based Algorithm is REINFORCE with Monte Carlo Policy Gradient, explain it. (Also called Monte-Carlo Policy Gradient)
Answer

-
REINFORCE, also called Vanilla Policy Gradient (VPG) can also work with Baseline, explain.
Answer
- With the baseline, the variance is mitigated

Source Illustration: https://papoudakis.github.io/announcements/policy_gradient_a3c/
-
What are disadvantages of REINFORCE?
Answer
- REINFORCE is unbiased and will converge to a local minimum.
- However, it is a Monte Carlo method which has its disadvantages.
- Slow learning because of high variance (partially solved by baseline).
- Impossible to implement online because of return.
- we need to generate a full episode to perform any learning.
- Therefore, can only apply to episodic tasks (needs to terminate).
-
Provide a intersection diagram to show what kind of learning a RL Algo can have
Answer

Source: Karlsruhe University of Applied Science - Yurii Tolochko, 2019
-
Explain the Actor-Critic Method
Answer
Actor-Critic methods are a buildup on REINFORCE-with-baseline.
Two parts of the algorithm:
- Actor - updates the action selection probabilities
- Critic - provides a baseline for actions’ value
Actor Critic Method has the same goal as the Baseline for REINFORCE: It should remove the high variance in predicting an action. Instead of applying a Monte Carlo method for value function approximation, we perform an one-step Temporal Difference algorithm.

Source Illustration: Reinforcement Learning: An Introduction. A. Barto, R. Sutton. Page 325
-
What is the motivation for Monte Carlo Tree search rather than use Depth-First search?
Answer
- DFS fails with more complicated games (too many states and branches to go through)
-
Explain Monte Carlo Tree search
Answer
- TLDR: Random moves is the main idea behind MCTS.
- Monte Carlo Tree Search is an efficient reinforcement learning approach to lookup for best path in a tree without performing a depth search over each path. Imagine an easy game like tik tak toe, where we have only 9 field so a game definitively ends after 9 actions. A depth-first search can easy find the best path through all actions. But for games like go or chess, where wie have a huge amount of states (1012010^12010120), it is impossible to perform a normal depth-first search. This is where the MCTS comes in.
Minimax and Game Trees
-
A game tree is a directed graph whose nodes are positioned in a game. The following picture is a game tree for the game tic tac toe.

Source: https://upload.wikimedia.org/wikipedia/commons/1/1f/Tic-tac-toe-full-game-tree-x-rational.jpg
-
The main idea behind MCTS is to make random moves in the graph. For any given state we are no longer looking through every future combinations of states and actions. Instead, we use random exploration to estimate a state’s value. If we simulate 1000 games from a state s with random move selection, and see that on average P1 wins 75% of the time, we can be fairly certain that this state is better for P1 than P2.

-
Vanilla MCTS has a problem with the mere number of possible next states. How could it be improved?
Answer
-
The Vanilla MCTS suffers in the point, that if there are a lot of possible actions in a state, only a few would lead to a good result. The chance to hit one of these good states is really low. An improvement for this could be to change these with something more intelligent. This is where MCTS Upper-Confidence Bound comes in. We can use the information after our backpropagation. The states currently keep information about their winning chance. We do actual move selection by visit count from root (max or as proportional probability). Idea is that by UCT "good" nodes were visited more often.
-
But of course, a balance between exploration and exploitation is quite important. We need to make sure that we explore as many states as possible, especially in the first few rounds. The following formula can be used to calculate the selection of the next node:

-
This approach can be leveraged by using a neural net which does value function approximation. So we do not need to explore a lot of states because the NN tells us, how a good a state is.
-
-
How does AlphaGo Zero work?
-
Shorten the algorithm of AlphaGo Zero
Answer
- Use current network and play some games to create training data. use MCTS (Monte Carlo Tree Search) for that. Completly focused on self-training.
- Use this data to retrain the network (Fix and target values). We train a policy and a value network.
- Now we have a slightly better network, repeat 1 + 2.
Notes:
- AlphaGo Zero uses ResNet
- Takes the last 8 images of the board into account
Output of the feature vector:
- Value vector:
- Policy vector: Probability distribution for all actions
- Define Actor-Critic
- Learnt value function
- Learnt policy
- Value function “helps” learn the policy


-
What is the Saliency Map?
Answer
- Saliency describes unique features in an image (Pixels, resolution, ..). The purpose is to visualize the conspicuity of an image or in other words to differentiate the visual features of it.
- This could be the color scale of an image, which is done by converting it to black and white, displaying a given temperature, or think of night vision (brightness is green, and darkness is black).

Could be used for traffic light detection. (Saliency detection)
Source: https://analyticsindiamag.com/what-are-saliency-maps-in-deep-learning/
-
What is Integrated Gradients?
Answer
- Attribution Algorithm. Works by specifying the target class.
-
What is the difference betweeen CNN Heat Maps: Gradients vs. DeconvNets vs. Guided Backpropagation?
-
What is NMF?
Answer
- A matrix factorisation technique (another one would be SVD). It stands for Non Negative Matrix Factorization and splits the user item matrix R into the matrices U and V. The optimization problem is that the multiplication of U and V should result in R.
-
What is NCF (Neural Collaborative Filtering)?
Answer
- Models User Item interactions in the latent space with a NN
- Is a generalization of Matrix Factorization
- In the input layer, the user and item are one-hot encoded.
- Neural CF Layers can be anything that is non linear
They claim that the precendent dot product of matrix factorization limits the expressiveness of user and item latent vectors. (vector a might be closer to vector b than to c, although it is more similar to c.

Neural CF Layer is replaced by a multiplication layer, which performs element-wise multiplication on the two inputs. Weights from multiplication layer to output is a identity matrix with a linear activation function.

y_ui = predicted item of recommender matrix
L = Linear activation function
circle with dot = element-wise multiplicaton
p_u = latent vector user
q_I = latent vector item
Since J is an identity matrix it transforms the element-wise multiplication to a dot product. Because L is a linear function it means that the input would only be up or downscaled, but there is no real transformation. Hence, we can omit it. We end up with the same function as for Matrix Factorization, which shows, that NCF can be a generalization of Matrix Factorization.
To leverage the architecture of NCF we need non-linearity. It includes Multiple Layer Perceptron (MLP), Generalized Matrix Factorization (GMP) and a non linear activation function sigmoid.

Source:
-
What are the components of a NeuMF (Non-linear NCF)?
Answer
- GMF (Generalized Matrix Factorization)
- MLP (Multi Layer Perceptron)
-
What is a Multilayer perceptron network (MLP)?
Answer
It is just a name for the simplest kind of deep neural network.
- There's at least one hidden layer
- Each neuron has a non-linear activation function
- Densely connected (each neuron in one layer is connected to every neuron the next or previous layer)
- Uses as usual optimizer (e.g. Adam) and as a Loss function Binary cross-entroy for example
- What is the Mean Reciprocal Rank (MRR)?
MRR takes the single highest ranked positive/relevant item (since a system always returns an ordered list, it is the first positive solution). Here depicted as rank_i. It does not care about other relevant items (e.g. at position 4 or 20)
User MRR if:
- There is only one result
- You care only about the highest ranked result (web search scenario)

Example:
```xml Query: "Cities in California"
Ranked results: "Portland", "Sacramento", "Los Angeles"
Ranked results (binary relevance): [0, 1, 1] Number of correct answers possible: 2 Reciprocal Rank = 1/2
Precision at 1: 0/1 Precision at 2: 1/2 Precision at 3: 2/3 Average precision = 1/m∗[1/2+2/3]=1/2∗[1/2+2/3]=0.38 ```
Source: https://stats.stackexchange.com/questions/127041/mean-average-precision-vs-mean-reciprocal-rank
-
How does MRR differ to MAP?
Answer
-
MAP considers all relevant items in the returned ranking. MAP and MRR are equivalent if MAP is set to k=1, since it then looks only at the first relevant item, and so does MRR.
Source:https://stats.stackexchange.com/questions/127041/mean-average-precision-vs-mean-reciprocal-rank
-
-
What is the difference between implicit and explicit matrix factorization?
Answer
- Implicit describes mostly unary ratings, such as that the user has seen an item or not (0 or 1)
- Explicit desribes the actual given rating, such as 3.5 by a range from 0 to 5
-
What is the median rank?
Answer
- The position of the relevant item that is in the middle of the relevant item list (50%). If odd than it is one above.
python Example: Relevant items position: [4, 60, 67, 77, 80] Median rank: 67 -
What is Binary Cross-entropy?
Answer
- With binary cross entropy I can only classify two classes, whereas categorical cross entropy can classify many classes.
-
What algorithms can be used for recommendation?
Answer
- Matrix Factorization (SVD
-
Nearest Neighbour (worse than MF)
- LSTMS, provide seen movies as a list of Ids to a LSTM network. Also, add tags to it.

Source: https://medium.com/deep-systems/movix-ai-movie-recommendations-using-deep-learning-5903d6a31607
-
What is the Monte Carlo method?
Answer
- random sampling
- On wikipedia it is described as follows:
- Define a domain of possible inputs
- Generate inputs randomly from a probability distribution over the domain
- Perform a deterministic computation on the inputs
- Aggregate the results
-
Aggregating the result would be the mean for our P(x)

-
Source: https://anotherdatum.com/vae.html https://en.wikipedia.org/wiki/Monte_Carlo_method
- What is the difference in the latent space of a variational autoencoder and a regular autoencoder?
- AE learns just a compressed presentation of the input data under the restriction that it is able to reconstruct the input, whereas VAE assumes that the underlying input space has a probability distribution and the latent space itself is assumed as a probability distribution as well. (usually normal distribution). VAEs are penalized if the latent space distribution is divergent from the assumed prior (here normal distribution). Hence, VAEs are pushed torwards adjusting the distributions to the given prior distribution.
- Source: https://www.quora.com/What-is-the-difference-in-the-latent-space-of-a-variational-autoencoder-and-a-regular-autoencoder#:~:text=AutoEncoders are free to have,is as good as mine.
-
What is a partial dependence plot and how does it work?
Answer
- Shows how the average prediction in your dataset changes when the j-th feature is changed
- Requires to see the model as additive.
- Computes the marginal effect on one or two features.
Note: Marginal effect means, what one feature adds to the prediction if they others are independent. In order to calculate it we have to average over those non-interesting

Source:
https://christophm.github.io/interpretable-ml-book/pdp.html
This means the following: In order to make a statement about a variable and its partial dependency to the output we need to make the inferences with all possible values of the other features, resulting Here in B3,B3, C2,C3. At the end we have n predicted outcomes, which need to be averaged. This averaged y is the marginal contribution of A1.
Example:

Source: https://towardsdatascience.com/introducing-pdpbox-2aa820afd312
-
What are advantages of PDP?
Answer
- perfect result, if features are independent
- easy to implement
- calculation is causal for model but not for the real world
- What are disadvantages of PDP?
Answer
- max feature = 2
- Some plots do not show the distribution → misleading interpretation
- Assumption of independence (weight ↔ height example) → Solution: Accumulated Local Effect plots (ALE) // works with conditional distribution
- Heterogeneous effects might be hidden. Cancelling out large positive and negative predictions (→ resulting in zero, meaning no effect on the model) → Solution: Individual Conditional Expectation Curves ⇒ ICE-Curves
- What is Individual Conditional Expectation plot?
Answer
- Extension of Partidal Dependence Plot
-
What is an additive model?
Answer
- It is characterized that the effect of one variable does not depend on another (independence) and their contribution/effect adds up to the total effect/prediction. Therefore, we can assume to understand each variable individually (synonym marginally), and as a result, we are able to interpret the model.
- Think of good old regression models. In a simple regression model, the effect of one variable does not depend on other variables and their effects add up to the total effect. If we can understand each variable individually or marginally, we would be able to interpret the entire model. However, this will no longer be true in the presence of interactions.
-
What is the idea of Shapley Values?
Answer
- Averaging over the contribution of all N! possible orderings. (Since non-linear models always depend on the order of the features)
-
What is LAYER-WISE RELEVANCE PROPAGATION (LRP)?
Answer
- It is similar to Saliency Maps as it produces a heatmap, but LRP connects it to the neurons that contributed the most.

Source: https://dbs.uni-leipzig.de/file/XAI_Alexandra_Nau.pdf
-
What is the idea of a regularizer?
Answer
- Discourage the NN memorizing/overfitting
-
What is the manifold space?
Answer
- A continuous, non-intersecting surface

-
What is the null hypothesis?
Answer
- A null hypothesis is a hypothesis that says there is no statistical significance between the two variables in the hypothesis. It is the hypothesis that the researcher is trying to disprove. In the example, Susie's null hypothesis would be something like this: There is no statistically significant relationship between the type of water I feed the flowers and growth of the flowers. A researcher is challenged by the null hypothesis and usually wants to disprove it, to demonstrate that there is a statistically-significant relationship between the two variables in the hypothesis. Source: https://study.com/academy/lesson/what-is-a-null-hypothesis-definition-examples.html
- What Is an Alternative Hypothesis?
Answer
- An alternative hypothesis simply is the inverse, or opposite, of the null hypothesis. So, if we continue with the above example, the alternative hypothesis would be that there IS indeed a statistically-significant relationship between what type of water the flower plant is fed and growth. More specifically, here would be the null and alternative hypotheses for Susie's study:
- Null: If one plant is fed club soda for one month and another plant is fed plain water, there will be no difference in growth between the two plants.
- Alternative: If one plant is fed club soda for one month and another plant is fed plain water, the plant that is fed club soda will grow better than the plant that is fed plain water.
- Source: https://study.com/academy/lesson/what-is-a-null-hypothesis-definition-examples.html
- What is the Friedman's test?
Answer
- Similar to the parametric repeated measures ANOVA, it is used to detect differences in treatments across multiple test attempts. Essentially, you have n data records, e.g. participants and those participants have experienced different types of something, e.g. wine or drugs. Now, what you're gonna do is to assign a rank to each entry. The goal is to find out whether there is a difference among those populations or not. At the end you either reject or you don't the null hypothesis.
- Source: https://www.statisticshowto.com/friedmans-test/
- Source: https://statistics.laerd.com/spss-tutorials/friedman-test-using-spss-statistics.php
-
What is the Lower Bound?
-
What is Jensens inequality?
Answer
Linear transformation of a variable followed by another linear transformation leads to the same result as the other way around.
Example:
python
mean(f(x)) == f(mean(x)), for linear f()
Jensens inequality says:
The intuition of linear mappings does not hold for nonlinear functions.
Non linear functions are not a straight line when we think of the transformation on the input to the output. It is either convex (curving upward) or concarve (curving downwards).
Example:
python
(x) == x^2 is an exponential convex function.
I quote:
"Instead, the mean transform of an observation mean(f(x)) is always greater than the transform of the mean observation f(mean(x)), if the transform function is convex and the observations are not constant. We can state this as:"
python
mean(f(x)) >= f(mean(x)), for convex f() and x is not a constant
Out intuition that the mean of a row of numbers multiplied by a non linear function (square), would be the same as applying the square to each of them and then calculate the mean, is wrong! The latter is greater.
- used to make claims about a function where little is known about the distribution
- used to compare arithmetic mean and geometric mean
Source: https://machinelearningmastery.com/a-gentle-introduction-to-jensens-inequality/
-
What is the geometric mean?
Answer
- The Geometric Mean is a special type of average where we multiply the numbers together and then take a square root (for two numbers), cube root (for three numbers) etc.
- For n numbers we take the nth root. (Nth root is concave)
-
What is data scarcity?
Answer
-
"Data scarcity, means too few data points often because it is difficult to get data or the data is small as compared to the amount needed."
-
-
What is a Cox Model?
Answer
-
Quote: "A Cox model is a statistical technique for exploring the relationship between the survival of a patient and several explanatory variables. Survival analysis is concerned with studying the time between entry to a study and a subsequent event (such as death)."
Source: http://www.bandolier.org.uk/painres/download/whatis/COX_MODEL.pdf
-
-
Can a linear model describe a curve?
Answer
Yes, that is possible. Usually a linear model only contains linear parameters and linear variables, but as long as the parameter remain linear and the variable to change is independent, it's exponent can be changed. For example can a independent variable be raised to quadratic, to fit a curve.
Rule for a linear model:


Source: https://statisticsbyjim.com/regression/difference-between-linear-nonlinear-regression-models/
-
What are Restricted Boltzmann Machines?
Answer
- Can be used for: dimensionality reduction, classification, regression, collaborative filtering, feature learning, and topic modeling.
- The goal is to learn a compressed version of features (lower dimensional representation) that describe the input well. The concept is similar to AEs but in contrary they don't have a dedicated decoding part. The decoding flows back to the input and updates the weights directly instead of having additional weights. The flown back reconstruction is compared and the weights updated.
- Therefore, we need two biases. One is for the forward pass (hidden bias) and the other for the backward pass (reconstruction). The input layer is considered as visible layer and the second layer as Hidden Layer.

- RBM uses stochastic units with a particular distributions. Based on this we use Gibbs Sampling:

- As an alternative to backpropagation and we use Contrastive Divergence. (I guess it is due to the probability distribution. VAE solves this problem by the reparameterization trick)

Source: https://medium.com/edureka/restricted-boltzmann-machine-tutorial-991ae688c154
Additional Source: https://www.patrickhebron.com/learning-machines/week5.html
-
What is a Deep Belief Network?
Answer
- Many layers of RBMs stacked together. For updating the weights, the Contrastive Divergense is still be used.
- What is synthetic data?
Answer
- data generated by an algorithm
-
What is the inverse covariance matrix?
-
What are explicit factor models?
Answer
- Explicit factor models (EFM) [17] generate explanations based on the explicit features extracted from users’ reviews.
-
What is Explainable Matrix Factorization (EMF)?
Answer
- another algorithm that uses an explainability regularizer or soft constraint in the objective function of classical matrix factorization. The con- straining term tries to bring the user and explainable item’s latent factor vectors closer, thus favoring the appearance of explainable items at the top of the recommendation list.
Source: An Explainable Autoencoder For Collaborative Filtering Recommendation (https://arxiv.org/abs/2001.04344)
-
What is the optimal transport cost (OT)?
Answer
- It uses the Wasserstein distance to measure how much work has to be invested to transport one probability distribution to another. In other words: The cost to transform one distribution into the other.
-
What is the infimum?
Answer
- That is the lower bound (not to be mixed up with the minimum).
-
What is the difference between Wasserstein and Kullback-Leibler?
Answer
- Wasserstein is a metric and KL not (KL is not symmetric and does not satisfy the triangle inequality)
-
Intuition:
- KL Divergence just tells you how similar two distributions are but Wasserstein distance gives you a measure for the effort to transport one probability mass to the other.

-
What is the chi-squared test?
Answer
- used for categorical data
- Does one categorical variable affects another one?
- calculates the p-value
- In case of a low p-value:
- Result is thought of as being "significant" meaning we think the variables are not independent.
- chi square = (Observed - Expected)^2 / Expected
- Calculate the degree of freedom: Degree of Freedom = (rows − 1) × (columns − 1)
-
Look up p-value in pre-computed table by using chi-square and degree of freedom

-
Source: https://www.mathsisfun.com/data/chi-square-table.html
-
What is a CSR Matrix?
Answer
Compressed sparse row (CSR), Algorithm to compress the size of a matrix by indexing the 1s with row_id, col_id

Source: https://machinelearningmastery.com/sparse-matrices-for-machine-learning/
-
What is rocchio feedback?
Answer
- Improving the search query by transforming the query and documents into a vector space and try to approach the centroid of the relevant documents while penalizing the distance to the centroid of the non-relevant documents.
- Described as an equation:


Source and example calculation: https://www.coursera.org/lecture/text-retrieval/lesson-5-2-feedback-in-vector-space-model-rocchio-PyTkW
-
What is a Weighted Matrix Factorisation?
Answer

- In contrast to SVD that has a cost function that processes all in one (seen and unseen), weighted MF sums over observed and unobserved items separately. SVD leads to poor generalisation when the corpus is large due to a sparse matrix.

-
Matrix A is the interaction matrix.
Source: https://developers.google.com/machine-learning/recommendation/collaborative/matrix
-
How can the objective function (cost) be minimized?
Answer
- Stochastic gradient descent (SGD) is a generic method to minimize loss functions.
-
Weighted Alternating Least Squares (WALS) is specialized to this particular objective.
Source: https://developers.google.com/machine-learning/recommendation/collaborative/matrix
-
What are the differences betweeen SGD and WALS?
Answer
SGD
+: Very flexible—can use other loss functions.
+: Can be parallelized.
-: Slower—does not converge as quickly.
-: Harder to handle the unobserved entries (need to use negative sampling or gravity).
WALS
-: Reliant on Loss Squares only.
+: Can be parallelized.
+: Converges faster than SGD.
+: Easier to handle unobserved entries.
-
What are advantages and disadvantages of Collaborative Filtering?
Answer
Taken from: https://developers.google.com/machine-learning/recommendation/collaborative/summary
Advantages:
No domain knowledge necessary
We don't need domain knowledge because the embeddings are automatically learned.
Serendipity
The model can help users discover new interests. In isolation, the ML system may not know the user is interested in a given item, but the model might still recommend it because similar users are interested in that item.
Great starting point
To some extent, the system needs only the feedback matrix to train a matrix factorization model. In particular, the system doesn't need contextual features. In practice, this can be used as one of multiple candidate generators.
Disadvantages:
Cannot handle fresh items
The prediction of the model for a given (user, item) pair is the dot product of the corresponding embeddings. So, if an item is not seen during training, the system can't create an embedding for it and can't query the model with this item. This issue is often called the cold-start problem. However, the following techniques can address the cold-start problem to some extent:
-
Projection in WALS. Given a new item i0 not seen in training, if the system has a few interactions with users, then the system can easily compute an embedding vi0 for this item without having to retrain the whole model. The system simply has to solve the following equation or the weighted version:
minvi0∈Rd‖Ai0−Uvi0‖
The preceding equation corresponds to one iteration in WALS: the user embeddings are kept fixed, and the system solves for the embedding of item i0. The same can be done for a new user.
-
Heuristics to generate embeddings of fresh items. If the system does not have interactions, the system can approximate its embedding by averaging the embeddings of items from the same category, from the same uploader (in YouTube), and so on.
Hard to include side features for query/item
Side features are any features beyond the query or item ID. For movie recommendations, the side features might include country or age. Including available side features improves the quality of the model. Although it may not be easy to include side features in WALS, a generalization of WALS makes this possible.
To generalize WALS, augment the input matrix with features by defining a block matrix A¯, where:
-
Block (0, 0) is the original feedback matrix .
A
-
Block (0, 1) is a multi-hot encoding of the user features.
- Block (1, 0) is a multi-hot encoding of the item features.
-


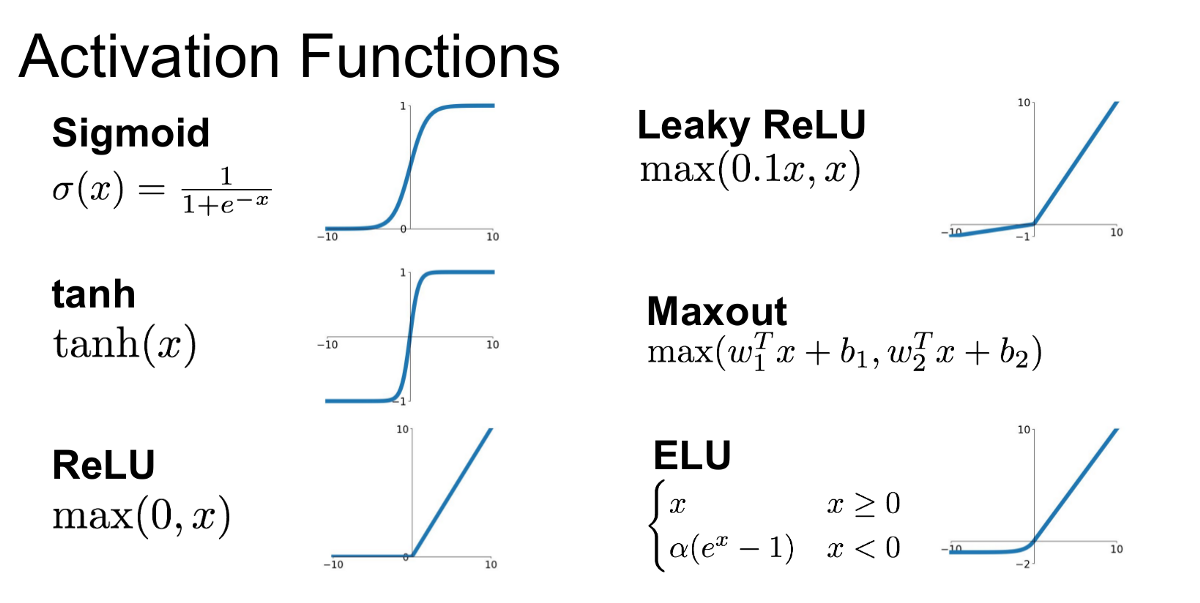
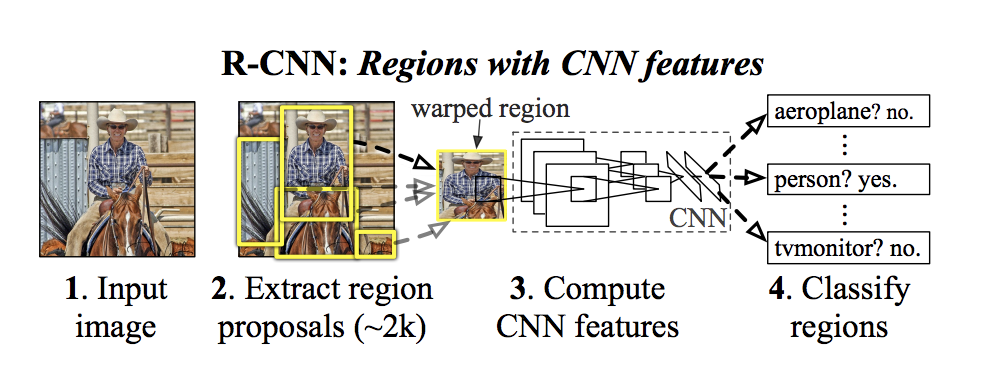
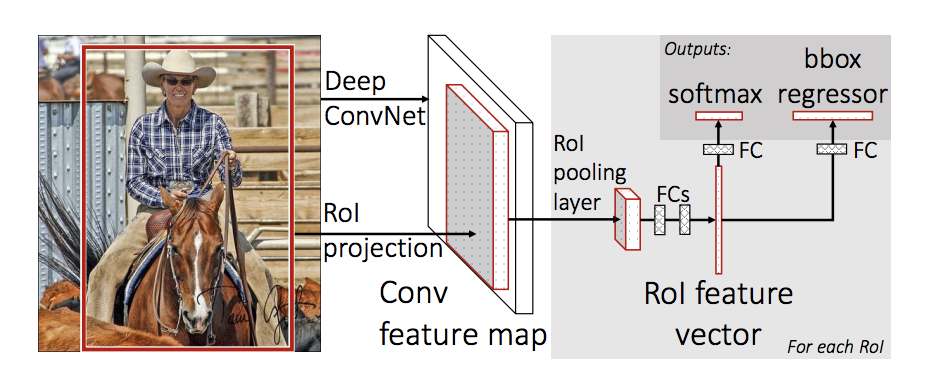
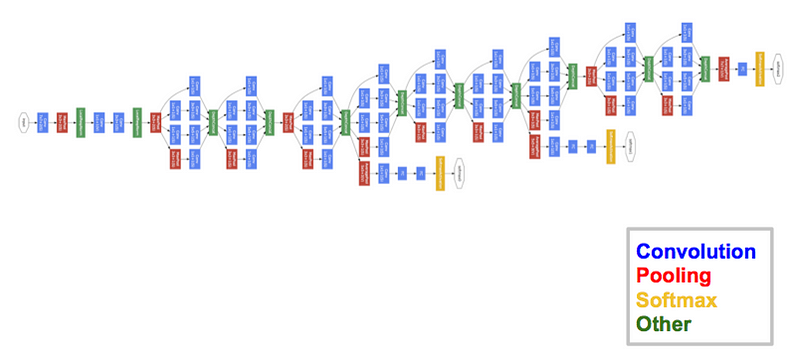
![https://machinethink.net/images/mobilenets/[email protected]](https://machinethink.net/images/mobilenets/DepthwiseConvolution@2x.png)
![https://machinethink.net/images/mobilenets/[email protected]](https://machinethink.net/images/mobilenets/PointwiseConvolution@2x.png)
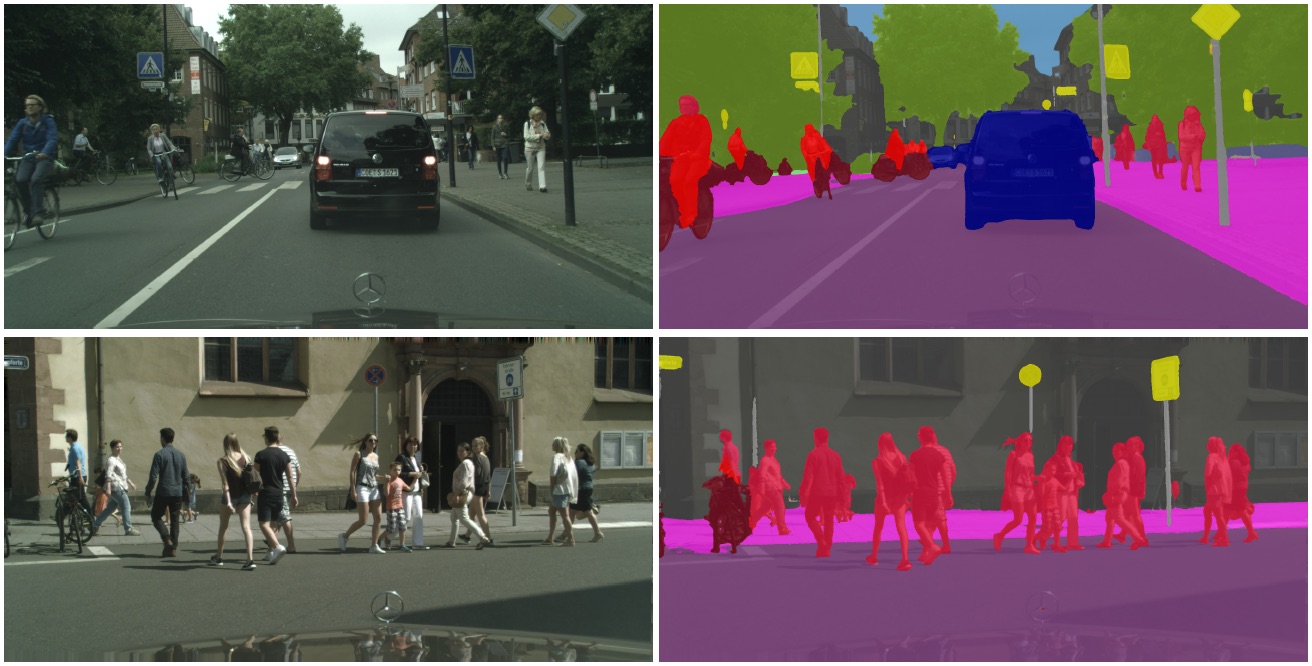
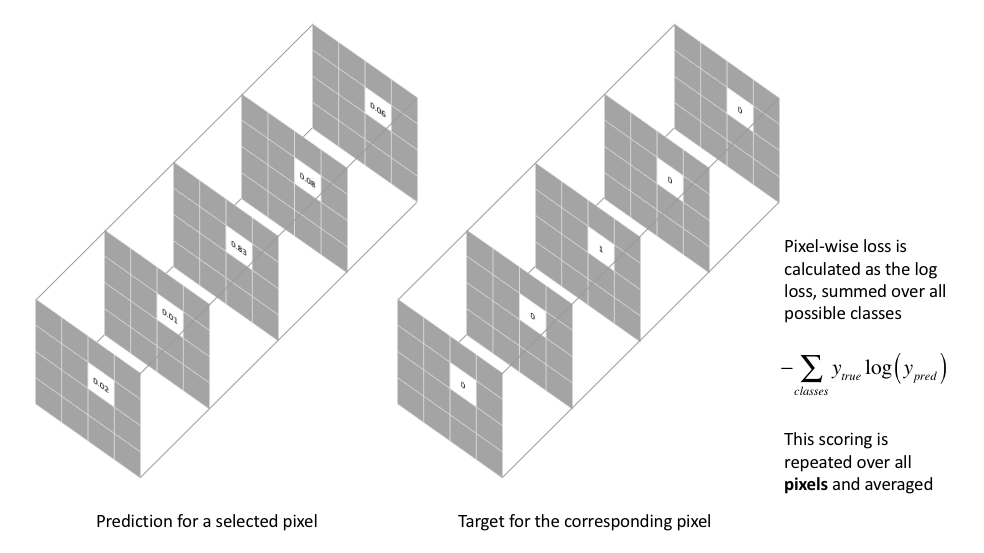
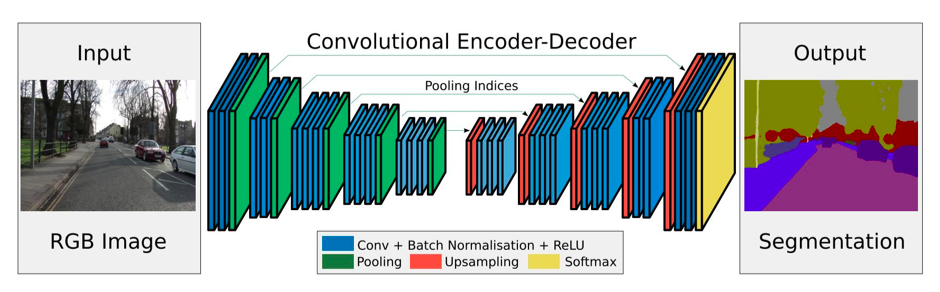
![https://cdn-images-1.medium.com/max/1600/1*[email protected]](https://cdn-images-1.medium.com/max/1600/1*44eDEuZBEsmG_TCAKRI3Kw@2x.png)
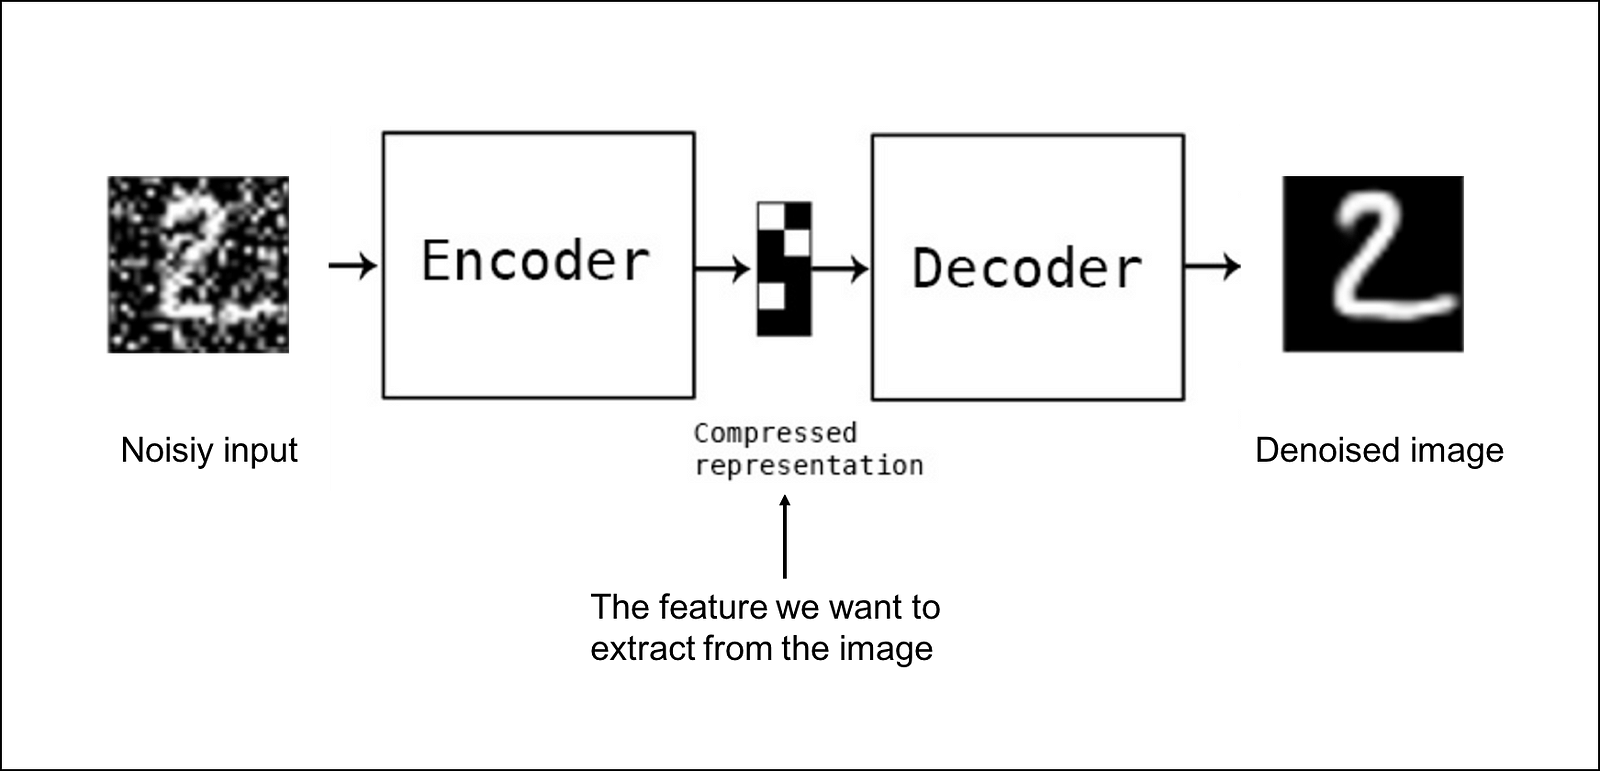
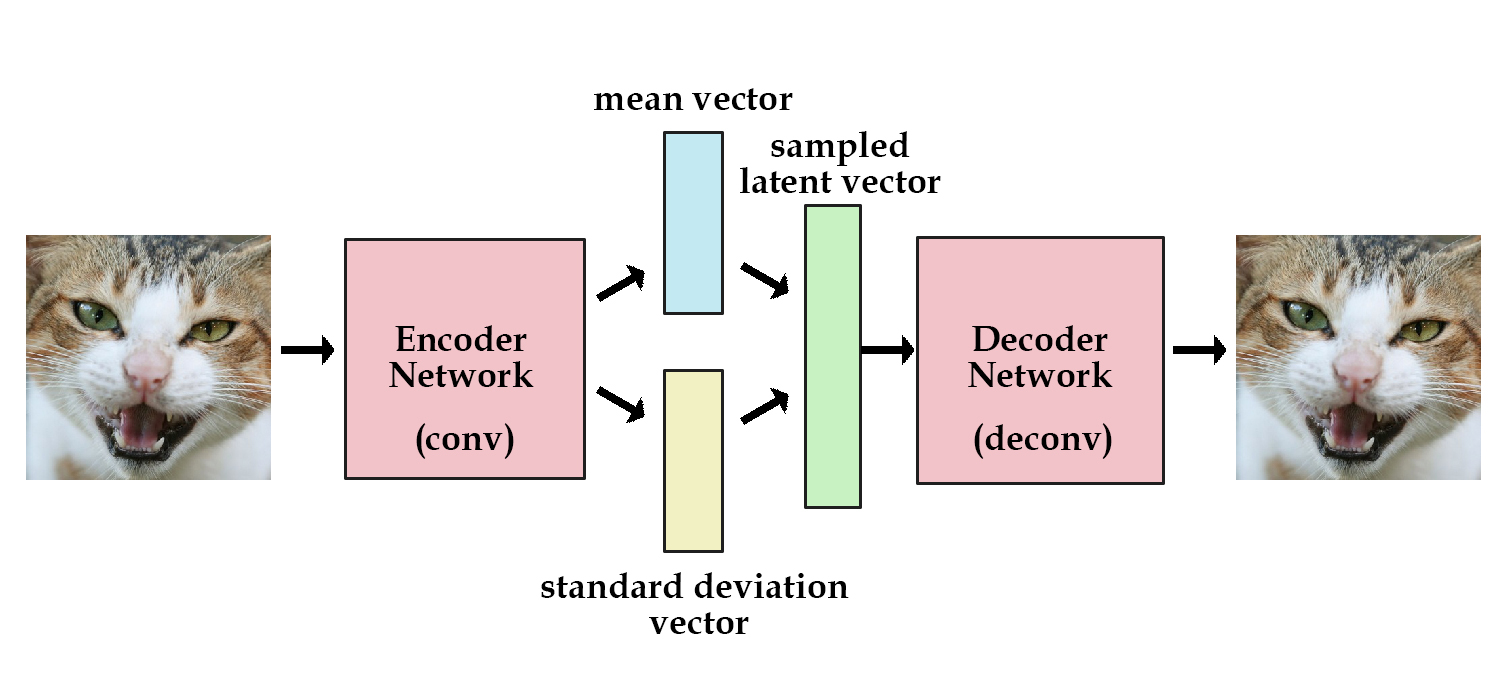