Git Product home page Git Product logo

h5web's Introduction

H5Web: React components for data visualization and exploration

Demos DOI

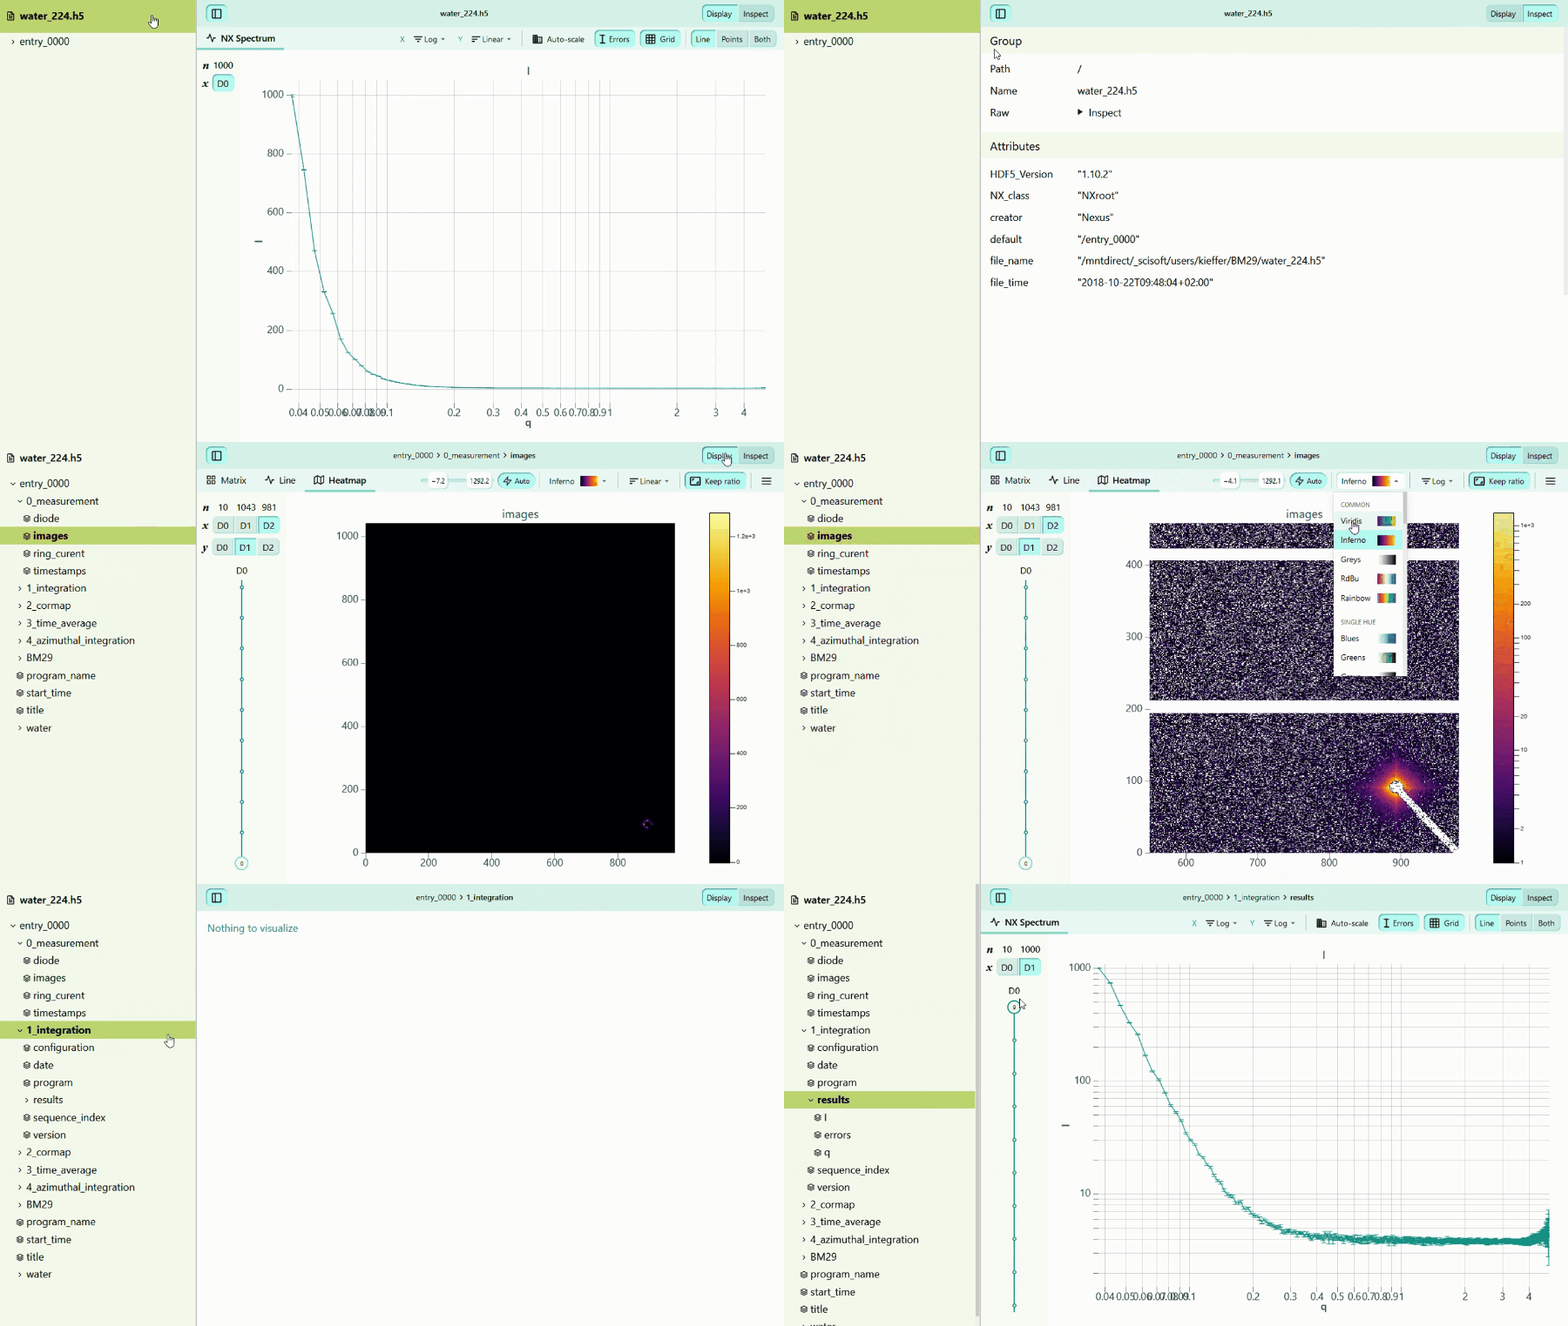
H5Web is a collection of React components to visualize and explore data. It consists of three packages:

  • @h5web/lib: visualization components built with react-three-fiber.
  • @h5web/app: a component to explore and visualize data stored in HDF5 (or HDF5-like) files, and data providers to connect this component to various back-end solutions.
  • @h5web/h5wasm: an additional data provider that can read HDF5 files straight in the browser.

While H5Web was initially built with the HDF5 format in mind, @h5web/lib visualization components are not tied to HDF5 and can be used to visualize data from any source. Also, @h5web/app lets you write your own data provider and can therefore work with any other hierarchical data format.

If you're after a ready-made solution to view local HDF5 files, take a look at myHDF5, at the Visual Studio Code extension or at the JupyterLab extension.

H5Web GIF demo

NPM packages ๐Ÿ“š

H5Web's component library, which includes the main visualization components (LineVis, HeatmapVis, etc.) as well as some of their lower-level building blocks (VisCanvas, ColorBar, etc.)

The library is documented in a Storybook site accessible at https://h5web-docs.panosc.eu.

Some examples of usage of @h5web/lib:

Multiple curves Heatmap with color bar Gamma vs Power scale

HDF5 viewer component (App) and built-in data providers.

Data providers are components that fetch data from HDF5 back-end solutions and provide this data to the app through React Context. H5Web currently includes three providers, two of which are available in the @h5web/app package:

This package includes a third data provider, H5WasmProvider, that can read HDF5 files straight in the browser thanks to the h5wasm library.

Demos

The demo app demonstrates the use of the built-in data providers and visualizations. Several demos are available, one per data provider:

Ecosystem

Check out these projects from the H5Web ecosystem:

  • myHDF5 โ€“ online HDF5 file viewing service
  • jupyterlab-h5web โ€“ H5Web extension for JupyterLab
  • vscode-h5web โ€“ H5Web extension for Visual Studio Code
  • h5grove โ€“ core utilities to serve HDF5 file contents

Contributing

Want to help improve H5Web? We're always looking for feedback, bug reports and feature requests, so don't hesitate to open an issue or start a discussion.

If you'd like to know more about contributing to the codebase, please check out the CONTRIBUTING guide.

h5web's People

Contributors

axelboc avatar bmaranville avatar dependabot[bot] avatar loichuder avatar peterc-dls avatar t20100 avatar

Stargazers

 avatar  avatar  avatar  avatar  avatar  avatar  avatar  avatar  avatar  avatar  avatar  avatar  avatar  avatar  avatar  avatar  avatar  avatar  avatar  avatar  avatar  avatar  avatar  avatar  avatar  avatar  avatar  avatar  avatar  avatar  avatar  avatar  avatar  avatar  avatar  avatar  avatar  avatar  avatar  avatar  avatar  avatar  avatar  avatar  avatar  avatar  avatar  avatar  avatar  avatar  avatar  avatar  avatar  avatar  avatar  avatar  avatar  avatar  avatar  avatar  avatar  avatar  avatar  avatar  avatar  avatar  avatar  avatar  avatar  avatar  avatar  avatar  avatar  avatar  avatar  avatar  avatar  avatar  avatar  avatar  avatar  avatar  avatar  avatar  avatar  avatar  avatar  avatar  avatar  avatar  avatar  avatar  avatar  avatar  avatar  avatar  avatar  avatar  avatar  avatar

Watchers

 avatar  avatar  avatar  avatar  avatar  avatar  avatar  avatar  avatar  avatar  avatar  avatar

h5web's Issues

[Heatmap] Orthonormal coordinates

  • Allow switching to a orthonormal coordinate system where the x and y axis share the same unit of length.
  • Let the heatmap expand to fit its container while maintaining the resulting aspect ratio (e.g. 1000x800 => 0.8). object-fit: contain might help with this.

Review position of metadata viewer

I initially chose to put the viewer in a panel for two reasons:

  1. I wasn't a fan of the behaviour in Silx View, where one has to switch back to the metadata tab each time (when navigating between datasets).
  2. I thought one would find it useful to be able to integrate the dataset visualizer and the metdata viewer separately in various applications - e.g. one could build an HDF5 viewer with just the explorer and the metadata viewer, or just the explorer and the dataset visualizer.

Reason 1 is less of a problem now that the active visualization is kept when navigating between two datasets in H5Web, but I don't like relying on this behaviour as it may require more complexity in the future (global state, Nexus, etc.)

Reason 2 still seems valid to me. If the metadata viewer becomes a "visualization" displayed in the tab bar, it becomes coupled to DatasetVisualizer. That being said, when we start publishing DatasetVisualizer as a package, perhaps we'll find a way to make it flexible in terms of which visualizations it is allowed to use (so people can remove the metadata and matrix visualizations, for instance).

One alternative to turning the metadata viewer into a visualization could be to provide an intuitive interface to select various kinds of layouts: explorer + dataset visualizer + metadata viewer; explorer + dataset visualizer; explorer + metadata viewer; dataset visualizer only.

[Explorer] Select custom node on mount

At the moment, when the explorer is first rendered, we select the root node by default. Making this behaviour more flexible by allowing a specific node to be selected on mount would get us closer to being able to persist and restore the state of the explorer in some way (cf. #94). This would save us headaches in development, notably.

This issue requires solving the problem of addressing a node in the tree across renders. We can't:

  • use HDF5 IDs since the same entity can be linked from multiple places;
  • use HDF5 link names since multiple links can have the same name;
  • use node IDs, since they are generated randomly on load.

What we can do is count on the order of the nodes in the tree. So I think our only option is to use an array of indices - e.g. [0, 2] <=> root node / first link / third link.

Save canvas as PNG without loss of resolution

Note that, in Firefox at least, there's a "View image" contextual option on the heatmap's canvas, which generates an image automatically. This doesn't work for me, but it works somewhat for others:

When I do "View image" with Firefox I see the zoomed image but then if leave go to another tab in firefox and go back to the image I see a empty (white) image. I get this URL: blob:null/b92087e5-f865-4a88-b13c-6c7b1481b192.

It may be worth making sure "View image" works before implementing a more advanced export feature.

Investigate zooming sensitivity on Mac laptop

The touchpad seems to be quite sensitive between two-finger scroll (heatmap zoom) and two-finger pinch (browser zoom). Perhaps we should mitigate this by canceling some pinch events. We'll have to test this on a Mac laptop at some point.

Stack visualization

Creating an epic for now, as this is quite complex.

  • Create a stack visualization to allow visualizing for nD datasets where n is in the interval [2, 3] (at least initially).
  • Users navigate on one of the dimensions with a slider (typically the first dimension).
  • The (n-1)D dataset can then be visualized with the appropriate visualization (scalar, matrix, line chart, heatmap, etc.)

The definition above is quite generic but the two main use cases are visualizing a 2D dataset as a stack of line charts, and a 3D dataset as a stack of heatmaps.

Line plots of 2d matrix

It would be useful to have the option to display a line plot of a 2d image by selecting a row or column to plot and in the future an arbitrary cut.

I am not sure if this is part of the 2d display widget or if the line display should be able to handle 2d images?

I leave it to the developers to make a proposal.

[Line] Switch from Recharts to react-three-fiber

After experimenting with react-three-fiber for the Heatmap visualization, I think it'd be a much better solution than Recharts for the Line visualization. It's easy to use and stable, and it performs much better than all of the charting libraries that render to SVG.

Before we make the switch, though, we should first implement axis in the Heatmap visualization.

Axis-to-dimension mapping

Allow selecting which dimension should be displayed on which axis. This applies to the Matrix, Line and Heatmap visualizations.

Ideally swapping two axis should take a single click and not require a intermediate step where the same dimension is displayed on two axis.

Copying/exporting datasets

The goal is to be able to use a dataset somewhere else, like in a Jupyter Notebook. The copy could be done either by reference or by value. The export could be to CSV or other raw formats.

Highlight selected dataset in explorer

When selecting a dataset then a group or datatype, the dataset remains displayed in the visualizer. Perhaps this should be made clear by highlighting the dataset that was last selected in the explorer even when another group or datatype is also highlighted.

Breadcrumbs

Add a breadcrumbs bar (see #67) above the VisSelector tab bar showing the path to the selected entity.

Collapse group in explorer only when already selected

Current behaviour

  1. Click on entry_0000 group => group node expands and group metadata appears in metadata viewer.
  2. Click on start_time dataset => dataset metadata appears in metadata viewer.
  3. Click on entry_0000 group again to see its metadata => group node collapses and group metadata appears in metadata viewer.

Suggested behaviour

  1. Click on entry_0000 group again to see its metadata => group metadata appears in metadata viewer (group node does not collapse).
  2. Click on entry_0000 group one more time => group node collapses.

Inspect/visualize switcher

Implement a control to switch between the metadata viewer and the dataset visualizer. The control is described in #66 and should sit in a new bar above the VisSelector tab bar.

Persist application state

This is a very high-level issue for now. Here are some initial ideas:

  • Persist inspect/display state.
  • Persist open/closed state of groups in explorer.
  • Persist selected node and expanded groups in explorer.
  • Persist explorer width if resized.
  • Persist selected visualization.
  • Persist visualization options - cf. #72
  • Persist some states to the URL (inspect/display, selected node, selected visualization, visualization options, etc.)?

We can play with different amounts of persistence and technical solutions:

  • Persistence during a session - i.e. restore state when unmounting then remounting a component:
    • move state up the component hierarchy;
    • make state global.
  • Persistence across sessions - i.e. restore state when closing then re-opening the app in the same browser:
    • localStorage - e.g. UI settings;
    • cookies - e.g. authentication.
  • Persistence across environments:
    • URL - e.g. navigation;
    • server-side database - e.g. permalink generation, authenticated settings, etc.

Recommend Projects

  • React photo React

    A declarative, efficient, and flexible JavaScript library for building user interfaces.

  • Vue.js photo Vue.js

    ๐Ÿ–– Vue.js is a progressive, incrementally-adoptable JavaScript framework for building UI on the web.

  • Typescript photo Typescript

    TypeScript is a superset of JavaScript that compiles to clean JavaScript output.

  • TensorFlow photo TensorFlow

    An Open Source Machine Learning Framework for Everyone

  • Django photo Django

    The Web framework for perfectionists with deadlines.

  • D3 photo D3

    Bring data to life with SVG, Canvas and HTML. ๐Ÿ“Š๐Ÿ“ˆ๐ŸŽ‰

Recommend Topics

  • javascript

    JavaScript (JS) is a lightweight interpreted programming language with first-class functions.

  • web

    Some thing interesting about web. New door for the world.

  • server

    A server is a program made to process requests and deliver data to clients.

  • Machine learning

    Machine learning is a way of modeling and interpreting data that allows a piece of software to respond intelligently.

  • Game

    Some thing interesting about game, make everyone happy.

Recommend Org

  • Facebook photo Facebook

    We are working to build community through open source technology. NB: members must have two-factor auth.

  • Microsoft photo Microsoft

    Open source projects and samples from Microsoft.

  • Google photo Google

    Google โค๏ธ Open Source for everyone.

  • D3 photo D3

    Data-Driven Documents codes.