Git Product home page Git Product logo

shu1jia1 / dex Goto Github PK

View Code? Open in Web Editor NEW

This project forked from patmartin/dex

0.0 2.0 0.0 111.76 MB

Dex : The data explorer. A data visualization tool written in java/javafx capable of powerful ETL and publishing D3 and other HTML visualizations.

License: Apache License 2.0

CSS 2.40% R 0.01% JavaScript 65.64% Shell 0.01% HTML 14.31% Makefile 0.02% CoffeeScript 0.26% C 14.73% Objective-C 0.99% Ruby 0.01% Groovy 0.95% Python 0.03% Processing 0.05% Java 0.61%

dex's Introduction

Dex

Dex : The data explorer is a data visualization tool written in Java/JavaFX capable of powerful ETL and data visualization.

Other Resources

Requirements

  • Java 8

Installation

There are 2 main ways to install Dex.

  1. Download a stable release
  2. Install via Git by following the instructions below.

Via Git

Download:

git clone https://github.com/PatMartin/Dex.git

Run

cd Dex
java -jar Dex.jar

Example Visualizations

The following are a small sample of the 50+ data visualizations Dex is capable of generating.

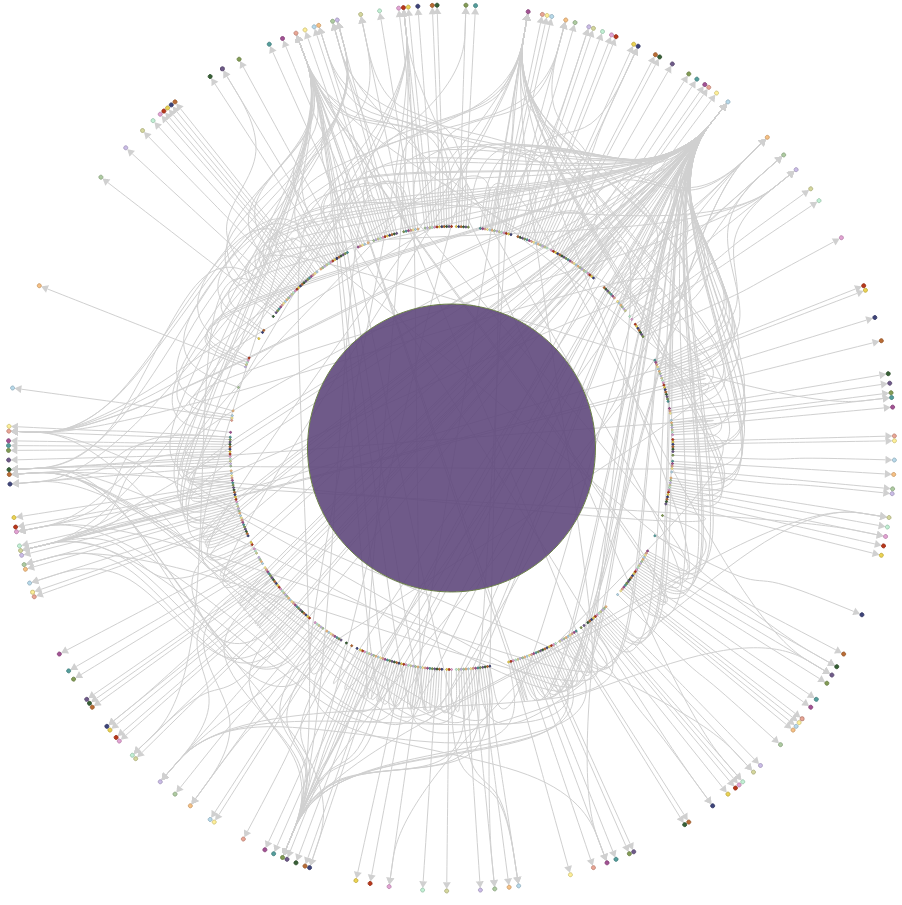
Ring Network

This visualization was created with Dex to visualize the relationships between Dr Who villans and motivations.

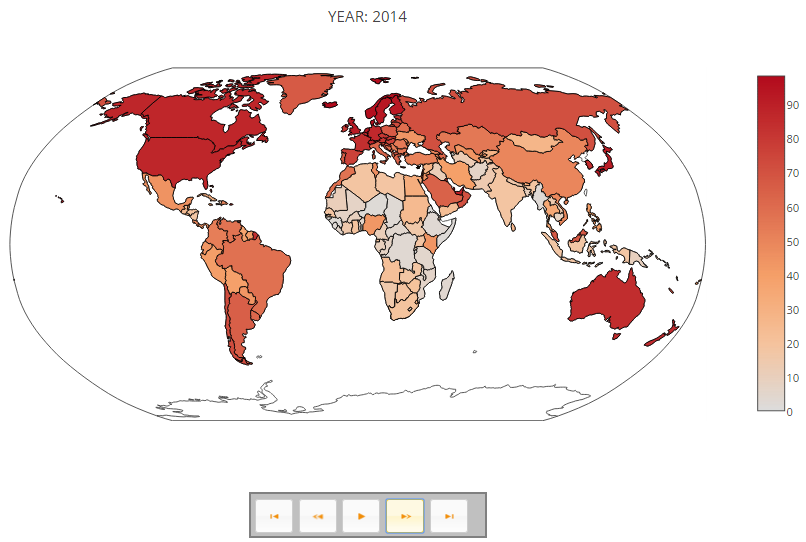
Maps

This visualization was created with Dex to visualize internet use across the world over the past 20 years.

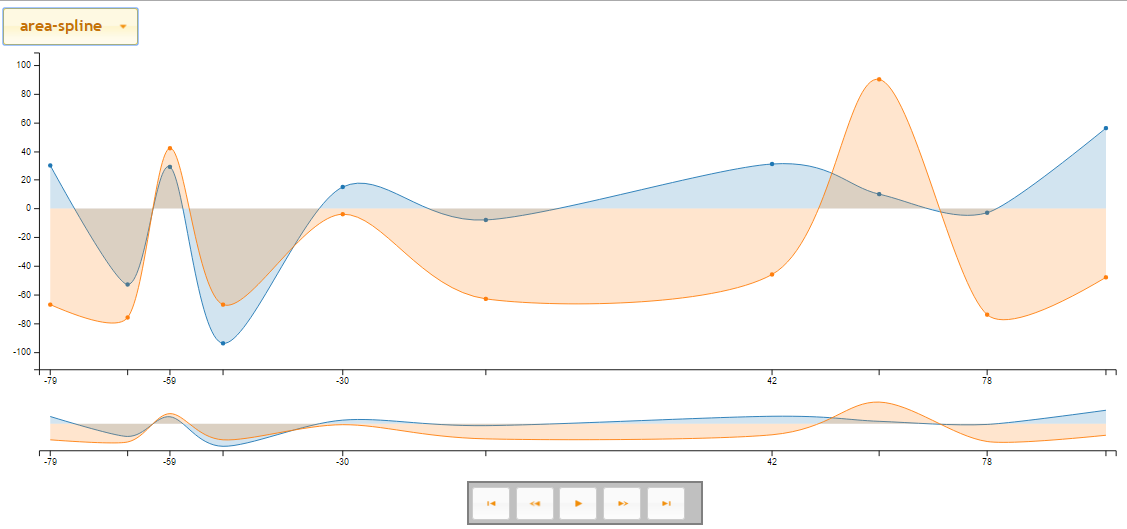
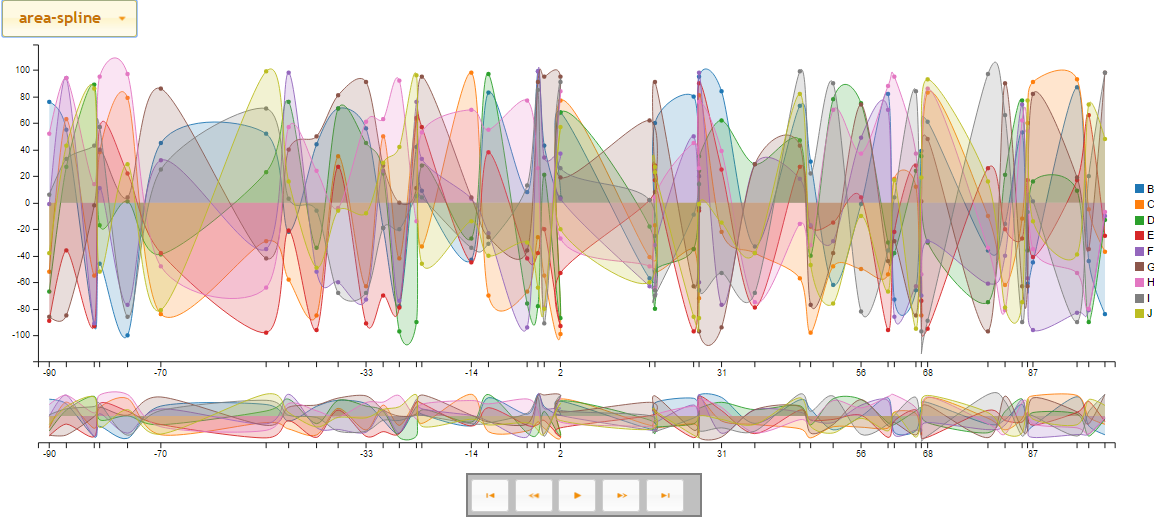
Time Visualizations

This visualization depicts a small series over time.

This visualization depicts a more complex series over time.

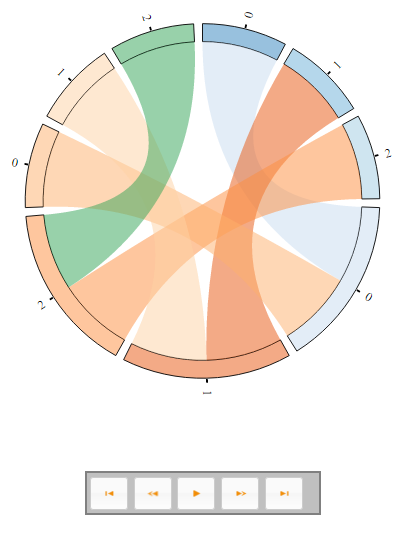
Chord Visualizations

This visualization depicts relationships via a Chord diagram over time.

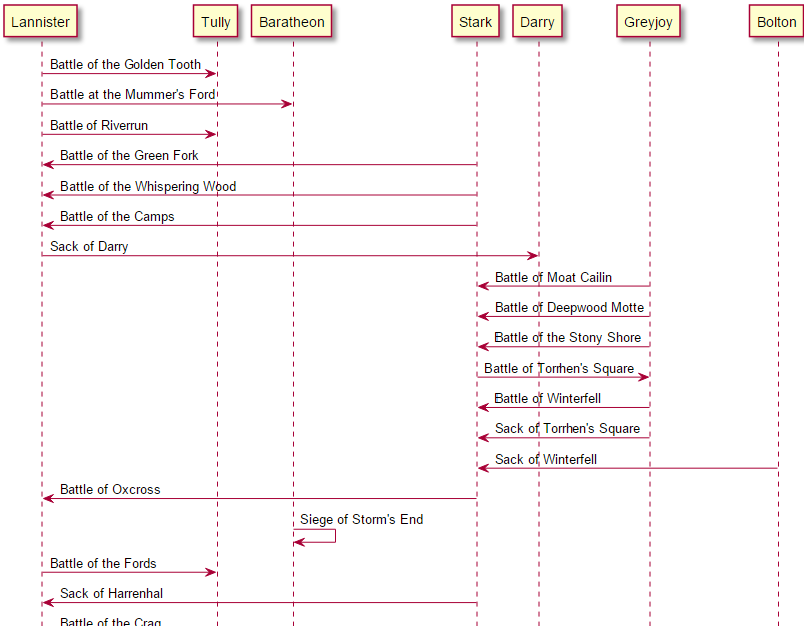
UML Visualizations

A Class Diagram of the various battles within the Game of Thrones.

A Sequence Diagram of the various battles within the Game of Thrones.

Network Visualizations

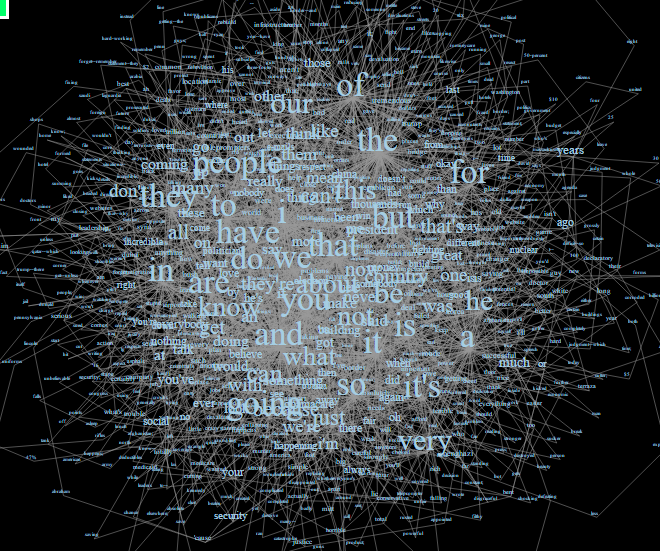
A large network comprised of every word spoken by Donald trump connected by the next word within the Iowa speech. This network visualization is founded on the high performance VivaGraph.

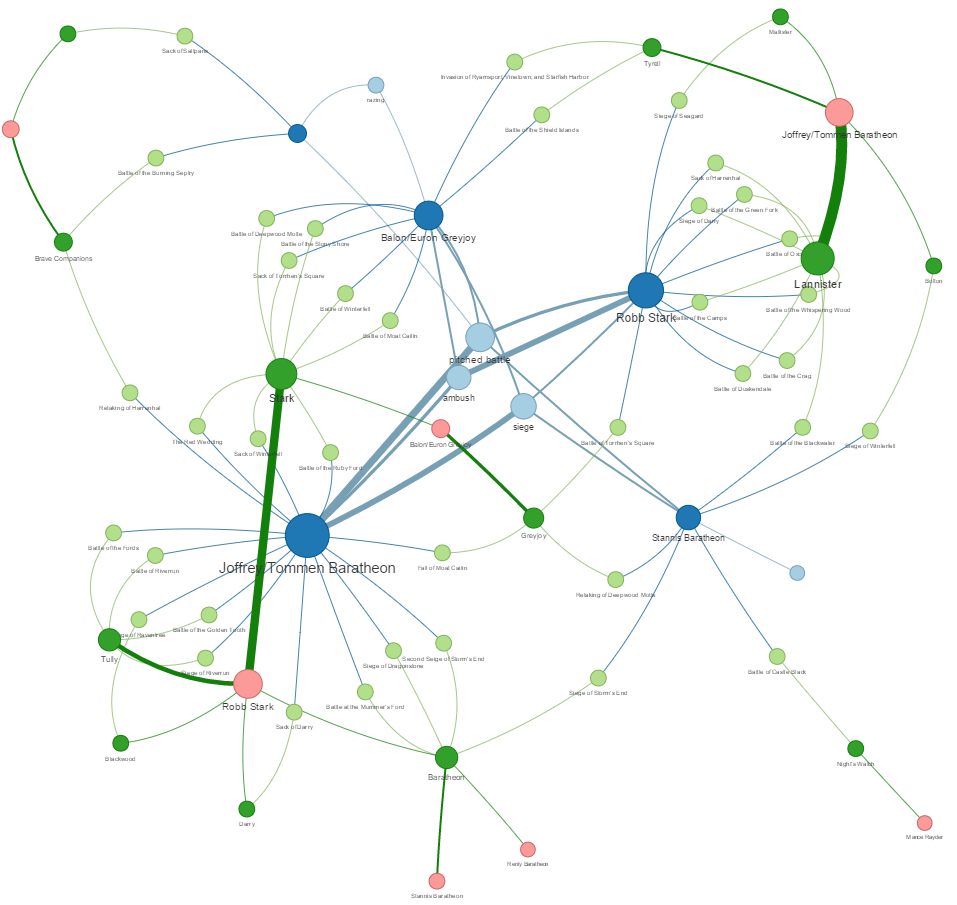
A vis.js visualization of the battles between the various houses within the Game of Thrones.

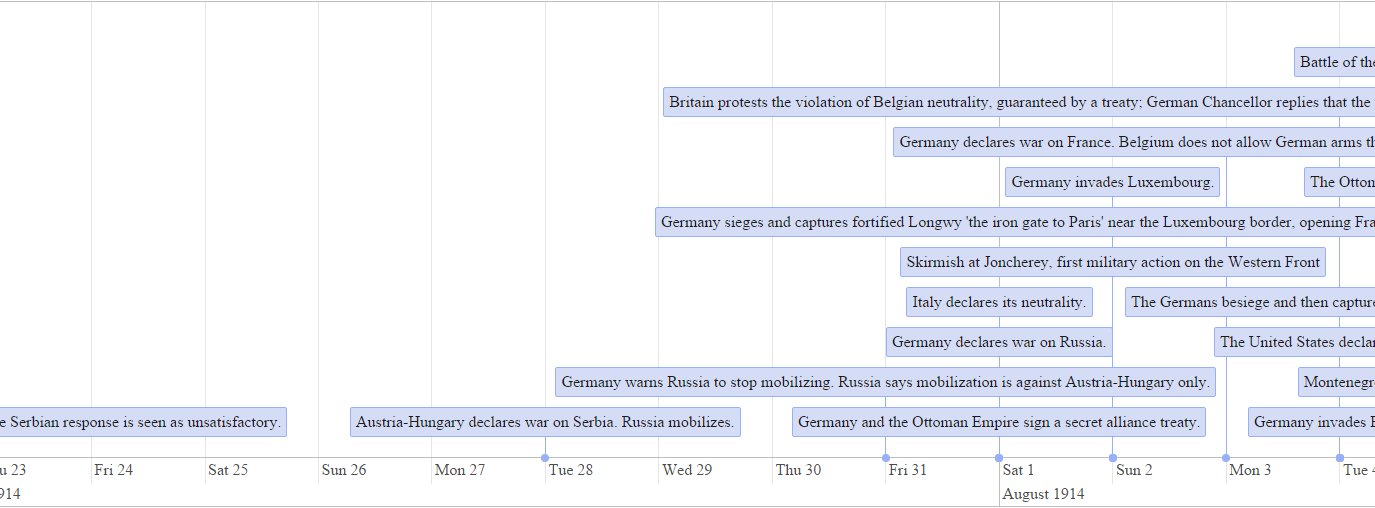
Timelines

A vis.js timeline visualization of the sequence of events that lead up to, and occurred during World War I.

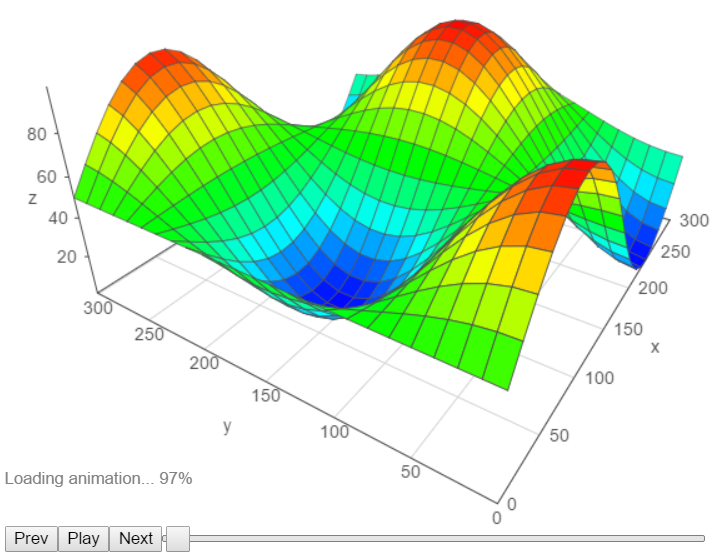
3D Graphs

A 3D graph of some data generated via Dex using a vis.js visual.

dex's People

Contributors

patmartin avatar

Watchers

James Cloos avatar  avatar

Recommend Projects

  • React photo React

    A declarative, efficient, and flexible JavaScript library for building user interfaces.

  • Vue.js photo Vue.js

    ๐Ÿ–– Vue.js is a progressive, incrementally-adoptable JavaScript framework for building UI on the web.

  • Typescript photo Typescript

    TypeScript is a superset of JavaScript that compiles to clean JavaScript output.

  • TensorFlow photo TensorFlow

    An Open Source Machine Learning Framework for Everyone

  • Django photo Django

    The Web framework for perfectionists with deadlines.

  • D3 photo D3

    Bring data to life with SVG, Canvas and HTML. ๐Ÿ“Š๐Ÿ“ˆ๐ŸŽ‰

Recommend Topics

  • javascript

    JavaScript (JS) is a lightweight interpreted programming language with first-class functions.

  • web

    Some thing interesting about web. New door for the world.

  • server

    A server is a program made to process requests and deliver data to clients.

  • Machine learning

    Machine learning is a way of modeling and interpreting data that allows a piece of software to respond intelligently.

  • Game

    Some thing interesting about game, make everyone happy.

Recommend Org

  • Facebook photo Facebook

    We are working to build community through open source technology. NB: members must have two-factor auth.

  • Microsoft photo Microsoft

    Open source projects and samples from Microsoft.

  • Google photo Google

    Google โค๏ธ Open Source for everyone.

  • D3 photo D3

    Data-Driven Documents codes.