Git Product home page Git Product logo

shopify-theme-inspector's Introduction

Shopify Theme Inspector for Chrome

Profile and debug Liquid template on your Shopify store.

Shopify themes are fast out of the box, but Liquid changes made afterwards can cause slowdowns. Shopify Theme Inspector for Chrome helps identify Liquid changes that are slowing your site down by providing a visualization of Liquid render profiling data, and giving you the means to triage the slowest parts of your Shopify theme.

Elements

Install

Visit the Chrome Web Store page and select Add to Chrome.

How to use

๐Ÿ™‹โ€โ™€๏ธ In order to proceed, you will need a Shopify single login account.

  1. Navigate to your Shopify store.
  2. Open Chrome DevTools.
  3. Navigate to the Shopify tab, located in the top group of tabs in Chrome DevTools.
  4. Click the โ†ป (Load Profile) button to request and view your Liquid profile flamegraph.

Note: Development stores cannot generate a liquid profile. Shopify is working on this issue.

Share your Performance Wins!

We would love to learn how you use this tool and solve your Liquid rendering issues. Please share by making a comment here and/or tweet us about your win @shopifydevs.

Understanding the Liquid profile flame graph

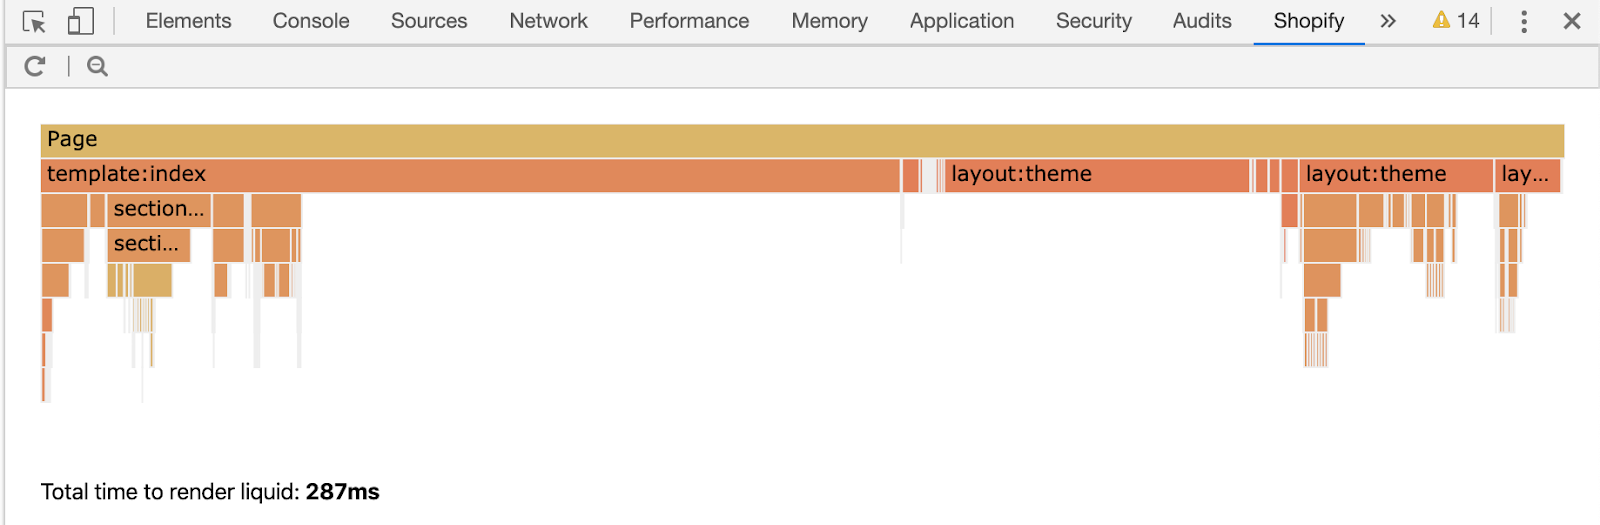
Starting from the top of the stack, Page contains the total time the server spent to render the entire page.

The total time Page spent on rendering does not equal to time to first byte (TTFB). There will be some overhead due to the network.

Page total render time + network overhead = time to first byte

template:index is an example of top level liquid code that Page needs to resolve and render. You can learn more details about this section by clicking on the bar.

  • File - where this code is located in your themes files
  • Total Time - the time it took for server to render this code
  • Code snippet - the exact code that server resolved (The link will take you to Online Store Code Editor)
  • Line - the line number where the code exists

What to look for when debugging?

Too many sections

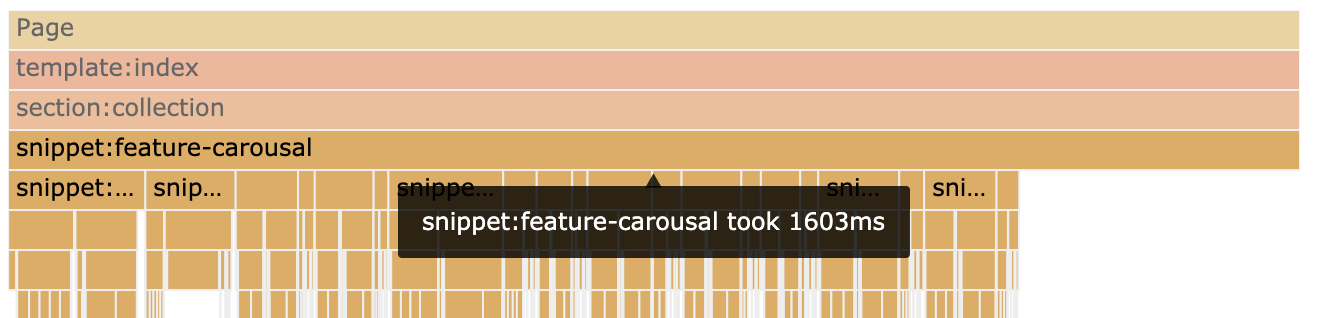
For each section, the server will take time to resolve and render. When there are too many sections, the server will take more time to resolve.

Too deep

Here are some possible reasons why a flame graph would result in this situation:

  • Too many conditionals
  • Nested loops
  • Nested includes
  • Combination of all of the above

Non-Visual Sections

These sections could be for:

  • Scripts
  • SEO
  • Analytics
  • โ€ฆ etc.

Evaluate whether these sections are necessary or refactor it so that it becomes more efficient.

FAQ

Can I profile any Shopify store I want?

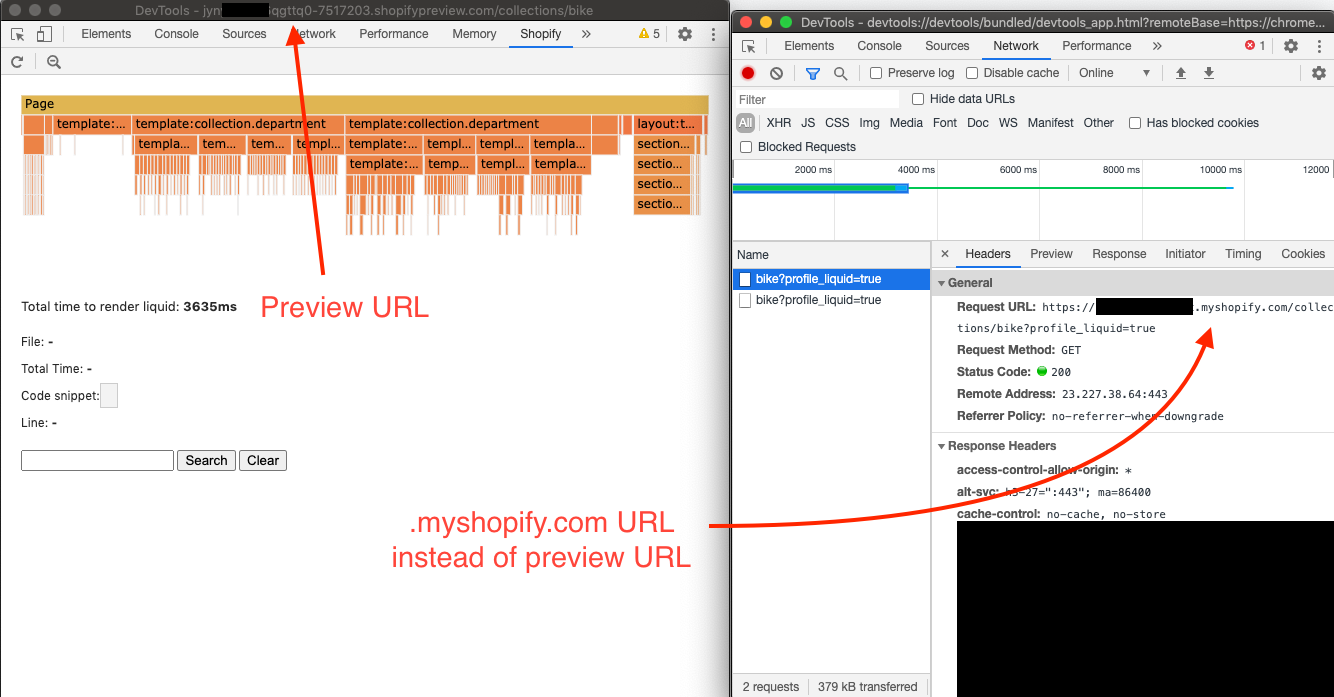
No, you can only profile stores that are linked to your single login Shopify account. You can also profile stores that you have access as a Shopify partner collaborator that have themes access.

Shopify partner collaborator accounts will not be able to profile a development store. Shopify is working on this issue, however, there is no timeline on when it will be done.

I'm not seeing the Shopify tab in Chrome DevTools

The Shopify tab will only show when viewing a Shopify Online Store.

I received an error page which says "This page cannot be profiled."

If you see this error, it may be because of one of the following conditions:

  • Your account does not have access to the current store you are trying to profile.
  • You might be trying to profile a checkout page, which is not supported by this extension.
  • There was an unhandled error in the request, e.g. timeout, lost connection, etc.

If it was none of the errors above you can right click on Shopify DevTools , inspect page, and view console for error details.

Contributing

To learn more about how to contribute to this project check out the contributing documentation.

If you find a bug please open an issue.

If you would like to request a feature, check out the feature request documentation.

Shopify Employees

View the internal documentation for more details on internal usage, development, and publishing new releases.

shopify-theme-inspector's People

Contributors

clayton-shopify avatar cursedcoder avatar dependabot[bot] avatar jlarson909 avatar krzksz avatar macournoyer avatar max611 avatar mgmanzella avatar t-kelly avatar uchoudh-zz avatar umair-choudhary avatar wizardlyhel avatar

Stargazers

 avatar  avatar  avatar  avatar  avatar  avatar  avatar  avatar  avatar  avatar  avatar  avatar  avatar  avatar  avatar  avatar  avatar  avatar  avatar  avatar  avatar  avatar  avatar  avatar  avatar  avatar  avatar  avatar  avatar  avatar  avatar  avatar  avatar  avatar  avatar  avatar  avatar  avatar  avatar  avatar  avatar  avatar  avatar  avatar  avatar  avatar  avatar  avatar  avatar  avatar  avatar  avatar  avatar  avatar  avatar  avatar  avatar  avatar  avatar  avatar  avatar  avatar  avatar  avatar  avatar  avatar  avatar  avatar  avatar  avatar  avatar  avatar  avatar  avatar  avatar  avatar  avatar  avatar  avatar  avatar  avatar  avatar  avatar  avatar  avatar  avatar  avatar  avatar  avatar  avatar  avatar  avatar  avatar  avatar  avatar  avatar  avatar  avatar  avatar  avatar

Watchers

 avatar  avatar  avatar  avatar  avatar  avatar  avatar  avatar  avatar  avatar  avatar  avatar  avatar  avatar  avatar  avatar  avatar  avatar  avatar  avatar  avatar  avatar  avatar  avatar  avatar  avatar  avatar  avatar  avatar  avatar  avatar  avatar  avatar  avatar  avatar  avatar  avatar  avatar  avatar  avatar  avatar  avatar  avatar  avatar  avatar  avatar  avatar  avatar  avatar  avatar  avatar  avatar  avatar  avatar  avatar  avatar  avatar  avatar  avatar  avatar  avatar  avatar  avatar  avatar  avatar  avatar  avatar  avatar  avatar  avatar  avatar  avatar  avatar  avatar  avatar  avatar  avatar  avatar  avatar  avatar  avatar  avatar  avatar  avatar  avatar  avatar  avatar  avatar  avatar  avatar  avatar  avatar  avatar  avatar  avatar  avatar  avatar  avatar  avatar  avatar

shopify-theme-inspector's Issues

Receiving 401 code responses while signed into a valid account

Problem

Hello. I have been trying to work with the Shopify Theme Inspector to inspect an Unpublished theme, on a store to which I am signed in via a Partners Account with Collaborator status and themes access, as mentioned in the docs.

I was receiving "This page cannot be profiled" errors, and the network tab was showing 401 errors consistently. Eventually, on the advice of a coworker, I signed in and out of my account in the Theme Inspector popup a few times, refreshed / navigated between pages, and I was able to successfully profile pages that hadn't been working before.

However, after doing some other work for a few minutes, I came back to the same page and clicked Load Profile in the plugin again, and received the same "Page Cannot be Profiled" and 401 error.

Replication steps

I am not sure how to replicate. As far as I can tell, there were no variables changed, besides waiting 10 minutes in between requests. The best I can say is

  1. Sign into an account with Collaborator Status and themes access on the store
  2. Sign in and out and refresh the page until Shopify Theme Inspector starts working
  3. wait 10-12 minutes
  4. Profile the page again

The screenshots below illustrate the Network requests made by the plugin.

image

image

More Information

This theme is not being rendered using the Shopify Storefront Renderer.

I am still signed into the same account, that hasn't changed.

Thanks for your time.

Shopify tab won't load on DevTools

Problem

I can't make the Shopify tab appear in Chrome Devtools. I'm running this using a staff account with full access to the store. The store uses Shopify plan and it's not a development store.

Replication steps

I just do what the docs say. Download the extension, log in with the staff acount, and open devtools.

More Information

Can 403 issues ( Gorgias ) be breaking the inspector?

Cannot sign in with Shopify Theme Inspector chrome extension

Problem

I just discovered the new "speed score" functionnality on my Shopify admin. And as my site has some room for improvment in that matter, I follow the guidelines and I installed the Shopify Theme Inspector extension for Chrome.

But when I tried to use it, I click on the "sign in" button, and it runs indefinitely.

Replication steps

  • I click on the Shopify icon of the Shopify Theme Inspector extension
  • I click on the "sign in" button
  • I wait... and nothing happens
    Shopify-theme-inspector-problem

More Information

  • I am the owner of my shopify store, I am on a paid plan, this is not a development nor a partner store
  • I am already loged in my store admin at the time the problem arises
  • I am using a free theme (Venture)

Shopify extension won't log in

Problem

/* Succinct outline of the problem or request. */

Replication steps

/* How to replicate the problem. Include screenshots or video if relevant. */

More Information

/* Any additional information which might be helpful. */

Liquid profiling does not work with {% liquid ... %} in theme.liquid and template liquid files

Problem

I try to profile https://de.afew-store.com/ and the Inspector is saying: "This page cannot be profiled"

More Information

When inpecting the plugin I can see the following wrrors:

I can load the resource in a new browser tab without the http error.

Input elements should have autocomplete attributes (suggested: "current-password"):

Problem

When I try to use debugger I get the 'this page cannot be profiled' with the above message in the console. I have full collab access to this website.

Replication steps

logged into partner account. opened store from there. go to shopify tab in debugging tools. hit the reload icon. a log in screen pops up. i log into store and get that same message.

More Information

/* Any additional information which might be helpful. */

This page cannot be profiled

Problem

After installing the Chrome Extension on Edge and logging in, I get the "This page cannot be profiled" error

Replication steps

  1. Install the extension on Edge
  2. Log in by clicking on the extension Icon
  3. Navigate the website, open Dev Tools > Shopify > Click on the reload button

More Information

Console Log:

shop.mobilhouse.it/:2463 [Intervention]Images loaded lazily and replaced with placeholders. Load events are deferred. See https://go.microsoft.com/fwlink/?linkid=2048113
bss-po-js.js?v=92558512759036727611702312076:16 Merge Init PO
Merge Init PO
modern/:15 In a sandboxed environment, addEventListener may not behave as expected.
(anonymous) @ modern/:15
addEventListener @ page-script.js:16771
Messenger @ page-script.js:16781
forDOMCommunication @ page-script.js:16769
(anonymous) @ page-script.js:16910
(anonymous) @ page-script.js:17005
(anonymous) @ page-script.js:17007
bss-po-js.js?v=92558512759036727611702312076:16 PO script
bss-po-js.js?v=92558512759036727611702312076:16 Start Cart Observer

Problems tab:

image

Thank you

Shopify flame graph to reflect the preview theme you are viewing

Problem

When I run the flame graph, while previewing an unpublished theme that I have made changes to, I don't see the updated changes reflected in the flame graph.

Replication steps

  1. Reduce the number of products rendered for a "featured collection" component in an unpublished theme.
  2. Run the flame graph tool and you will see the number of products rendered for the "featured collection" component is from the published theme and not the unpublished theme that you made the change in.

How to log out of the extension

Problem

I logged in using one partner account when using for one site, but I am now trying to debug another site, where I have been provided a separate account. How do I log out of the extension and back in?

Flamegraph no longer visible under sections

Problem

The flamegraph now shows one large flame for the entire section file and no longer breaks it down to liquid inside those sections

Replication steps

Tested on multiple stores

More Information

I think this might be related to a recent update, I haven't seen this issue before

Theme inspector is not showing up in developer tools

Problem

It was working fine until Chrome updated to version 86.

Replication steps

More Information

I tried to reinstall the app, but that's didn't help. Chrome info:

Google Chrome 86.0.4240.111ย (Official Build)ย (x86_64)
Revision b8c36128a06ebad76af51591bfec980224db5522-refs/branch-heads/4240@{#1290}
OS macOS Version 10.15.7 (Build 19H2)
JavaScript V8ย 8.6.395.17
Flash 32.0.0.445 /Users/dimka/Library/Application Support/Google/Chrome/PepperFlash/32.0.0.445/PepperFlashPlayer.plugin
User Agent Mozilla/5.0 (Macintosh; Intel Mac OS X 10_15_7) AppleWebKit/537.36 (KHTML, like Gecko) Chrome/86.0.4240.111 Safari/537.36
Command Line /Applications/Google Chrome.app/Contents/MacOS/Google Chrome --flag-switches-begin --enable-gpu-rasterization --enable-quic --flag-switches-end

You have all the permissions to profile a store but it doesn't work ...

Problem

The extension is returning "Cannot profile this page"

  • You are an authorized user (Owner, Staff with themes permission, Collaborators with themes permission) to profile a page
  • It is not a development store

Status

It is possible that your store is running the latest Storefront Renderer from Shopify. You may check by looking for the following attribute in the main document's response header.

Response Header:
  ...
  x-storefront-renderer-rendered: 1

We are working hard to get this extension working with the Storefront Renderer. You may follow this progress at #63

Issue with layout folder path

Problem

When clicking on the Shopify file it takes you to the wrong path layouts/theme. liquid

/* Succinct outline of the problem or request. */

Replication steps

/* How to replicate the problem. Include screenshots or video if relevant. */
image
image

More Information

/* Any additional information which might be helpful. */

Incompatible with unpublished themes

Problem

When attempting to profile an unpublished theme, results for the published theme are computed instead.

Replication steps

  1. Load up a preview for an unpublished theme that has obvious liquid differences from the main theme.
  2. Attempt profiling, inspect the profiler in devtools and replay the profile_liquid=true request via fetch, but add the parameters fts=0&preview_theme_id=${themeId}.
  3. Resolve to text
  4. Extract the json from the #liquidProfileData container.
  5. Compare to what the profiler provided and you'll find the wrong theme was profiled.

More Information

Thanks for the amazing tool. This is really amazing to finally have.

Cannot profile shop user account pages

Problem

Running the latest version of the tool I am able to run the flame reports on all of the pages of the site, except for those in the /account/ path, so the login, list of past orders etc. I've logged out and then back in again to my admin account, I've tried a fresh/different computer. I'm on the most recent version of chrome and the plugin.

Replication steps

Go to a dev shop, and try to run the flame report on /account or /account/login or other such pages and receive a "This page cannot be profiled" error

Log in doesn't work

Known Issues

  • Partner collaborator accounts with shop permissions will not log in (Fixed - May 27, 2020)

Shopify is planning to work on this issue but there is no timeline on when this will be fix.

Cannot profile unpublished themes

Problem

When I try to profile an unpublished theme, I see the profile of the published theme instead.

Replication steps

  1. Preview an unpublished theme (either with a shared preview URL or with ?preview_theme_id URL param)
  2. Open Shopify Theme Inspector
  3. Click Load Profile

More Information

When I inspect the network requests for Shopify Theme Inspector, I see the production URL being used. See the following screenshot:

Screen Shot 2020-06-03 at 6 16 18 PM

This seems to be due to the extension pulling the inspected URL from the window variable Shop.shop:

`(/myshopify\\.io/.test(document.location.host) ? document.location.host : Shopify.shop) + document.location.pathname + document.location.search`,

Screen Shot 2020-06-03 at 6 24 14 PM

In previous versions, this doesn't seem to be the case: bc6bb0c

'This page cannot be profiled' error

Problem

Trying to use the Shopify Inspector chrome extension but I keep experiencing issues and seeing an error message that says 'This page cannot be profiled' after refreshing the page as requested within the app.

I am logged in via our staff Shopify Partners account so I have admin access to stores and admins and I can preview all themes. Just wondering if this is a permissions issue on the account access type I have within Shopify Partners?

Replication steps

  1. Installed App
  2. Close Chrome / Open Chrome again
  3. Opened inspector
  4. Clicked 'Shopify Tab'
  5. Opens Partners Login Window + Logged in
  6. Returned to Chrome with theme open, Opened inspector, Clicked 'Shopify Tab'
  7. Refreshed page
  8. Error within inspector tab: 'This page cannot be profiled'

Cannot profile development stores

Known Issue

As a Shopify Partner account, I can not profile development stores that I created

Shopify is current working on this but there is no timeline on when this will be fixed

Plugin injects code into non-html rendering

Problem

I was checking out the Shopify changelog XML feed and saw this text at the bottom of the page:

window.postMessage({ hasDetectedShopify: typeof window.Shopify !== 'undefined', }, '*');

Turns out that the plugin is indiscriminately injecting it's script tag into the page.

Replication steps

  1. Visit https://changelog.shopify.com/feed.xml
  2. See window.postMessage({ hasDetectedShopify: typeof window.Shopify !== 'undefined', }, '*'); at the bottom of the page

More Information

/* Any additional information which might be helpful. */

Slow store cannot run profiler on any page

Problem

When trying to profile all pages on a live site - I get the error 'this page cannot be profiled'.
Inspecting the devtools frame shows errors parsing the json from #liquidProfileData:

SyntaxError: Unexpected end of JSON input
    at JSON.parse (<anonymous>)
    at $jscomp.generator.Engine_.program

I have looked at the response from page?profile_liquid=true and extracted #liquidprofiledata myself, and it parses as json just fine in my ides formatter but not with JSON.parse.
It is 3mb of json / 52k lines formatted. Maybe that has something to do with it? JSON.parse has some hard limits and we have a lot of lines of code.

I saw in another issue that @wizardlyhel asked someone to twitter DM the site to debug further - would be happy to do that if it would help figure out the problem.

Inspector profiles in preview mode but not on published themes

Problem

The inspector shows the "Page cannot be profiled" error when trying to inspect published themes. However, the inspector is able to profile any theme in the library when viewed in preview mode.

I encountered this behavior in two different stores. I confirmed that I was logged into the extension for each store with the proper access and permissions.

page not profiled

I can't profile the home page of my site despite having all the permissions. how can i solve?

Shopify Theme Inspector Not Working

Problem I am the owner of the site and I am trying to run shopify theme inspector to remove unwanted javascript and fix errors but it won't run. I'm using Impulse theme and avada app for image optimization and lazy load. It keeps saying the page cannot be profiled.

This page cannot be profiled

Problem

Not a development store. Tested with all existing store accounts, including store owner. Tried removing and reinstalling extension twice. Always the same response, "This page cannot be profiled".

Replication steps

Attempt to profile the store.

More Information

Every time I press the profile button, the extension pops up the login window. No matter which user I log in with, the response is the same - "This page cannot be profiled". This is true for any page on the store, homepage, cat pages, pdp. In the console I have noticed the following, which however I don't think is related:

"DevTools failed to load SourceMap: Could not load content for https://cdn.shopify.com/shopifycloud/storefront-recaptcha-v3/v0.1/index.js.map: HTTP error: status code 404, net::ERR_HTTP_RESPONSE_CODE_FAILURE"

This page cannot be profiled

Problem

When logged into my company's Shopify Plus account, and opening the Shopify tab in Chrome dev tools, I get the following error message: This page cannot be profiled.

Replication steps

Install the Chrome extension
Open dev tools and hit the reload button
Screenshot attached
Screenshot 2024-01-03 135814

More Information

I tried re-installing the extension, restarting Chrome, logging out of Shopify and back in. I also tried clearing browser cache.
Operating system: Windows 11 Pro, OS Build: 22621.2861
Browser: Chrome Version 120.0.6099.130 (Official Build) (64-bit)

Share your Performance Wins!

We would love to learn how you use this tool and solve your Liquid rendering issues. Comment below and tell us:

  • How many milliseconds have you saved? (Even a 50ms saving makes a big difference)
  • What was the cause? (Bad liquid pattern? Injected by another app? Zombies?)

Tweet us your wins! @shopifydevs

This page cannot be profiled (suspected theme problem)

Problem

Cannot use on Shopify Plus site with custom domain nor on their staging/dev site without custom domain. Both the live site and the dev site are using versions of the same theme (Brooklyn, pretty heavily modified).

Tried using the .myshopify.com domain, tried adding ?_ft=0; in all cases I get some variation of the following:

Error: Liquid profile not found for this page
  at devtools.js:8
  (etc)
SyntaxError: Unexpected token ' in JSON at position 330617 (this number varies)

(see screenshot for more complete errors)
Screen Shot 2020-02-04 at 1 18 04 PM

Replication steps

I can't replicate this on other Shopify sites. So I think it's a problem with the theme, because:
Works fine with two completely different stores.
Works when theme in dev store is changed to an unedited version of Brooklyn.

Likely this is actually a feature request: can this supply more information as to where the JSON syntax error can be found and fixed?

Liquid profile not found for this page

Problem

I've tried two Shopify stores with a single-login full access account and both times received the message 'This page cannot be profiled'

The console gives me one error:

devtools.js:16 Error: Liquid profile not found for this page

Replication steps

I'm not sure but I'm glad to provide more information. I'm possibly not satisfying all of the requirements for this tool

More Information

The XHR for example.com/collections/all?profile_liquid=true doesn't respond with anything different from a request to example.com/collections/all

The page cannot be profiled

Hi all,

Just launched a new store and been checking out the extension to see how we can improve store speed. We're using a 3rd party theme (not developed by Shopify). I'm relatively technical but not a developer AND this is my first time posting, so go easy :)

Getting the "cannot be profiled" message on any page. Copy of the console below and I expanded each entry to show all child notes.

If it needs to be attached in another way please let me know.

(index):6010 {omegaFBSettings: {โ€ฆ}}
jquery-migrate-1.4.1.min.js?v=8839049224236534361699138854:2 JQMIGRATE: Migrate is installed, version 1.4.1
10[Violation] Forced reflow while executing JavaScript took ms
[Violation] Forced reflow while executing JavaScript took 44ms
[Violation] Forced reflow while executing JavaScript took 46ms
[Violation] Forced reflow while executing JavaScript took 68ms
[Violation] Forced reflow while executing JavaScript took 48ms
[Violation] Forced reflow while executing JavaScript took 53ms
[Violation] Forced reflow while executing JavaScript took 63ms
[Violation] Forced reflow while executing JavaScript took 64ms
[Violation] Forced reflow while executing JavaScript took 174ms
[Violation] Forced reflow while executing JavaScript took 33ms
[Violation] Forced reflow while executing JavaScript took 39ms
index-60bab31c9a9dbce229a4323c052d2e0e98c44e5a685f07bad938fd6977d9c8d0.js:6 [Violation] Added non-passive event listener to a scroll-blocking 'touchmove' event. Consider marking event handler as 'passive' to make the page more responsive. See https://www.chromestatus.com/feature/5745543795965952
(anonymous) @ index-60bab31c9a9dbce229a4323c052d2e0e98c44e5a685f07bad938fd6977d9c8d0.js:6
(anonymous) @ index-60bab31c9a9dbce229a4323c052d2e0e98c44e5a685f07bad938fd6977d9c8d0.js:7
add @ index-60bab31c9a9dbce229a4323c052d2e0e98c44e5a685f07bad938fd6977d9c8d0.js:3
(anonymous) @ index-60bab31c9a9dbce229a4323c052d2e0e98c44e5a685f07bad938fd6977d9c8d0.js:2
each @ index-60bab31c9a9dbce229a4323c052d2e0e98c44e5a685f07bad938fd6977d9c8d0.js:2
O @ index-60bab31c9a9dbce229a4323c052d2e0e98c44e5a685f07bad938fd6977d9c8d0.js:2
on @ index-60bab31c9a9dbce229a4323c052d2e0e98c44e5a685f07bad938fd6977d9c8d0.js:3
(anonymous) @ index-60bab31c9a9dbce229a4323c052d2e0e98c44e5a685f07bad938fd6977d9c8d0.js:6
f @ index-60bab31c9a9dbce229a4323c052d2e0e98c44e5a685f07bad938fd6977d9c8d0.js:3
d @ index-60bab31c9a9dbce229a4323c052d2e0e98c44e5a685f07bad938fd6977d9c8d0.js:3
e.bugsnag @ index-60bab31c9a9dbce229a4323c052d2e0e98c44e5a685f07bad938fd6977d9c8d0.js:6
(anonymous) @ index-60bab31c9a9dbce229a4323c052d2e0e98c44e5a685f07bad938fd6977d9c8d0.js:7
e.bugsnag @ index-60bab31c9a9dbce229a4323c052d2e0e98c44e5a685f07bad938fd6977d9c8d0.js:6
(anonymous) @ index-60bab31c9a9dbce229a4323c052d2e0e98c44e5a685f07bad938fd6977d9c8d0.js:6
facebook-pixel.js:1 Add ttclid: {"fbc":null,"fbp":"fb.1.1704137929294.1704138015065"}
appstle-subscription.min.js?shop=dc30c8-3.myshopify.com&v=1704176099799:1 jQuery is loaded, after 1462 milliseconds!
avada-fsb-main.min.js?v=1704314097805:1 Avada FreeShipping Bar initialized
avada-boost-sales-main.min.js?v=1704314097804:1 Avada Boost Sales initialized
avada-sale-pops-main.min.js?v=1704314097802:1 Avada Sales Pop has initialized
jquery-3.6.1.min.js?v=77015668167349694581699138854:2 [Violation] 'setInterval' handler took 63ms
avada-sale-pops-v2-main.min.js?v=1704314097803:1 Avada Boost Sales Sales Pop V2 has initialized
hourglassmagic.com/:1 Uncaught (in promise) Error: A listener indicated an asynchronous response by returning true, but the message channel closed before a response was received

Any insight appreciated.
Cheers!

Software can't run

Problem

/* Succinct outline of the problem or request. */

Replication steps

/* How to replicate the problem. Include screenshots or video if relevant. */

More Information

/* Any additional information which might be helpful. */

"Page cannot be profiled" on specific collection template

Problem

On all pages using a specific collection layout template, the profiler always fails with a This page cannot be profiled error. This does not happen on any other pages.

Replication steps

Navigate to a page using this collection template, attempt to profile it.

More Information

Link to a gist of the error log: LOG

Might have been able to narrow it down to the usage of this specific liquid snippet in the collection layout template as well. Will eventually do some testing to see what might be causing the problem in the snippet.

Update:
From what I have been able to tell from the extension logs it is failing when it attempts to receive the profiler data with a HTTP 500 error. This appears to only happen on pages that have this specific usage of the liquid default filter: assign variable_name = variable_name | default: 'default value'. It works fine in the renderer and is useful as a shorthand way of providing default values to parameters in snippets but for some reason breaks the profiler.

Qn about Shopify Theme Inspector and Scope of Support

Problem

``
DevTools failed to load source map: Could not load content for https://cdn.shopify.com/s/trekkie.storefront.min.js.map: HTTP error: status code 404, net::ERR_HTTP_RESPONSE_CODE_FAILURE

DevTools failed to load source map: Could not load content for https://cdn.shopify.com/shopifycloud/shopify-xr-js/v1.0/bundle.js.map: HTTP error: status code 404, net::ERR_HTTP_RESPONSE_CODE_FAILURE
DevTools failed to load source map: Could not load content for https://sm.pinimg.com/webapp/sw-www-authdesktop.mjs.map: HTTP error: status code 404, net::ERR_HTTP_RESPONSE_CODE_FAILURE
DevTools failed to load source map: Could not load content for https://sm.pinimg.com/webapp/workbox-precaching.prod-c9d8c403a8a2d2df.js.map: HTTP error: status code 404, net::ERR_HTTP_RESPONSE_CODE_FAILURE
DevTools failed to load source map: Could not load content for https://sm.pinimg.com/webapp/workbox-sw-49788b12e8ffa47d.js.map: HTTP error: status code 404, net::ERR_HTTP_RESPONSE_CODE_FAILURE
DevTools failed to load source map: Could not load content for https://sm.pinimg.com/webapp/workbox-core.prod-da0b69af4d8ad8a3.js.map: HTTP error: status code 404, net::ERR_HTTP_RESPONSE_CODE_FAILURE
DevTools failed to load source map: Could not load content for https://sm.pinimg.com/webapp/workbox-routing.prod-1f85f744c0ecb34d.js.map: HTTP error: status code 404, net::ERR_HTTP_RESPONSE_CODE_FAILURE
DevTools failed to load source map: Could not load content for https://sm.pinimg.com/webapp/workbox-strategies.prod-fa8ffe3cde8c6c73.js.map: HTTP error: status code 404, net::ERR_HTTP_RESPONSE_CODE_FAILURE
starcadia-quest-nayomi-tanaka-kickstarter-edition-board-game-expansion:1 The resource https://cdn.shopify.com/s/files/1/1915/6645/files/TGS_Logo_600x.png?v=1619993151 was preloaded using link preload but not used within a few seconds from the window's load event. Please make sure it has an appropriate as value and it is preloaded intentionally.


Freezing issue

Problem

After profiling a page, mousing over/clicking the bars where a loading time bubble is shown locks up the extension

Replication steps

Happening to me on homepage of https://www.alphalion.com/
https://screenshot.click/16-52-35tmi-8w6o5.mp4

This doesn't happen on my test store with a fairly vanilla theme.

More Information

No errors in the extension's console. Currently this store is having issues with their header liquid code causing a slow load, so I'm suspect it's looping too much, which might be overloading this tool by putting too many elements into the graph:
https://screenshot.click/16-49-pmwxg-nx5ow.png
Though that's a scenario that this tool should help to investigate so ideally this can be overcome.

This page cannot be profiled

Hi Guys,

I have a shopify partner login. I am trying to run shopify-theme-inspector for stores I manage.

However I keep getting the following error

Screenshot 2020-09-17 at 14 12 10

Are you able to help at all?

accidental submission

Problem

/* Succinct outline of the problem or request. */

Replication steps

/* How to replicate the problem. Include screenshots or video if relevant. */

More Information

/* Any additional information which might be helpful. */

Can only profile "page" templates

Problem

As a partner collaborator I only seem to be able to profile page templates, not collections, products, index, account or cart

Replication steps

  1. Sign in to extension
  2. Load store, and open inspector
  3. Hit the load profile button on the Shopify tab
  4. If it's a page template receive the profile output, otherwise receive the "This page cannot be profiled" error

Page:
page-template

Any others:
others

More Information

I've tried this on two paid stores (one basic, one plus store) and observed the same behaviour.
I have attempted re-installing the extension and signing out and back in without any success.
I've also attempting signing in as the owner of the store without any change.

Unable to log in

I am the store owner and the app is not allowing me to log in. All it's doing is shown in the screenshot below. Please help me to resolve this.

Screenshot (649)

Recommend Projects

  • React photo React

    A declarative, efficient, and flexible JavaScript library for building user interfaces.

  • Vue.js photo Vue.js

    ๐Ÿ–– Vue.js is a progressive, incrementally-adoptable JavaScript framework for building UI on the web.

  • Typescript photo Typescript

    TypeScript is a superset of JavaScript that compiles to clean JavaScript output.

  • TensorFlow photo TensorFlow

    An Open Source Machine Learning Framework for Everyone

  • Django photo Django

    The Web framework for perfectionists with deadlines.

  • D3 photo D3

    Bring data to life with SVG, Canvas and HTML. ๐Ÿ“Š๐Ÿ“ˆ๐ŸŽ‰

Recommend Topics

  • javascript

    JavaScript (JS) is a lightweight interpreted programming language with first-class functions.

  • web

    Some thing interesting about web. New door for the world.

  • server

    A server is a program made to process requests and deliver data to clients.

  • Machine learning

    Machine learning is a way of modeling and interpreting data that allows a piece of software to respond intelligently.

  • Game

    Some thing interesting about game, make everyone happy.

Recommend Org

  • Facebook photo Facebook

    We are working to build community through open source technology. NB: members must have two-factor auth.

  • Microsoft photo Microsoft

    Open source projects and samples from Microsoft.

  • Google photo Google

    Google โค๏ธ Open Source for everyone.

  • D3 photo D3

    Data-Driven Documents codes.