![]()


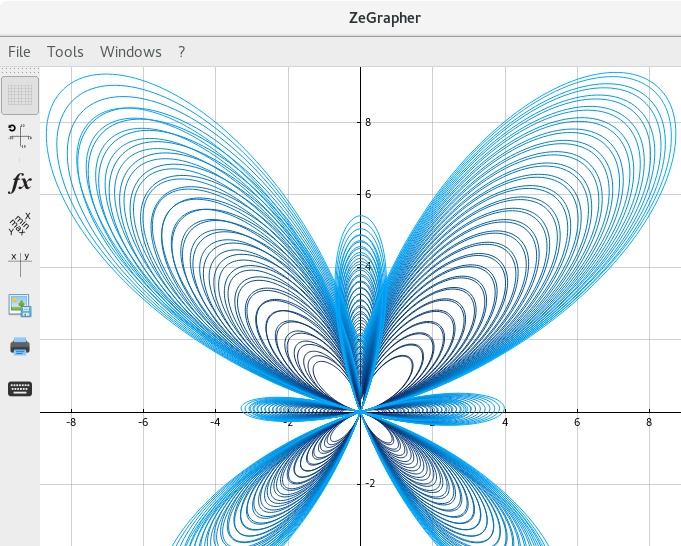
ZeGrapher is a free, open source and easy to use software for plotting mathematical objects. It can plot functions, sequences, parametric equations and data on the plane.
Official website: https://zegrapher.com/
- Visualize up to six functions simultaneously, they currently have fixed names:
fghprm. It is planned to implement plotting of an arbitrary number of user named function.- All the standard mathematical functions (
coscoshexp...etc) can be called: they're all written on a virtual keyboard that can be displayed with a button. - On a given function, other functions be called, so it is possible to associate or compose functions.
- Using the uppercase letter of a user-defined function, e.g
Fmakes ZeGrapher compute its antiderivative. - Using the primed version of a user-defined function, e.g
f'makes ZeGrapher compute its derivative.
- All the standard mathematical functions (
- Visualize up to six numerical sequence simultaneously, they currently have fixed names:
uvlwqt.- Sequences can be defined by a recurrent relation, e.g
u(n) = u(n-1) + u(n-2)in which case initial values should be given in the corresponding input widget, separated by;, e.g.1;1 - Sequences can be defined explicitly, e.g
u(n) = 2*n + 1.
- Sequences can be defined by a recurrent relation, e.g
- Parametric equation plotting. The curves can be animated, with adjustable framerate and speed.
- Experimental data plot and polynomial fit (regression). Data can be imported/exported from a CSV file.
- Parametric plot for functions, sequences and parametric equations: the parameter name to use is fixed to
k. This will be overheauled in the upcoming version. - Plot tangents: they can be moved and resized simply with the mouse.
- Plot derivatives and antiderviatives.
- Print the graph, with these options :
- Choose the size and the position of the graph on the sheet.
- Print in color or gray-scale.
- Export on a PDF file.
- Export to all common image formats (png, jpeg, tiff, gif...).
- Display a table of values with different options.
- Navigate on the graph :
- Select a curve to display the coordinates of its points.
- Zoom/unzoom on each axis separately, around the mouse (with the scroll wheel), or fit on a mouse drawn rectangle.
- Move the graph.
- Customize the presentation :
- Change colors: axes, background, functions...
- Adjust the plotting precision. Note that it will also affect rendering speed.
- Show/hide a grid.
- Activate/deactivate curves' smoothing.
- Plot the graph on an orthonormal basis.
ZeGrapher is available in the official repositories of Debian, Fedora, Ubuntu, FreeBSD. In the Archlinux (AUR). An AppImage is otherwise available, along with Windows and Mac versions in Zegrapher's Github releases page or at zegrapher.com.
To compile from sources, ZeGrapher needs a C++ compiler and the following libraries:
For Windows, one also needs to edit the following line in ZeGrapher.pro to where the boost folder has been extracted:
win32 {
# Modify this line in Windows to boost's folder to be able to compile
    INCLUDEPATH += C:/boost_1_72_0
}
To compile from the command line:
$ git clone https://github.com/AdelKS/ZeGrapher.git
$ cd ZeGrapher
$ qmake ZeGrapher.pro
$ make
It is also possible to use Qt Creator as a GUI software to compile ZeGrapher by opening with it the ZeGrapher.pro file then pressing the "play" button, after configuring the project.


