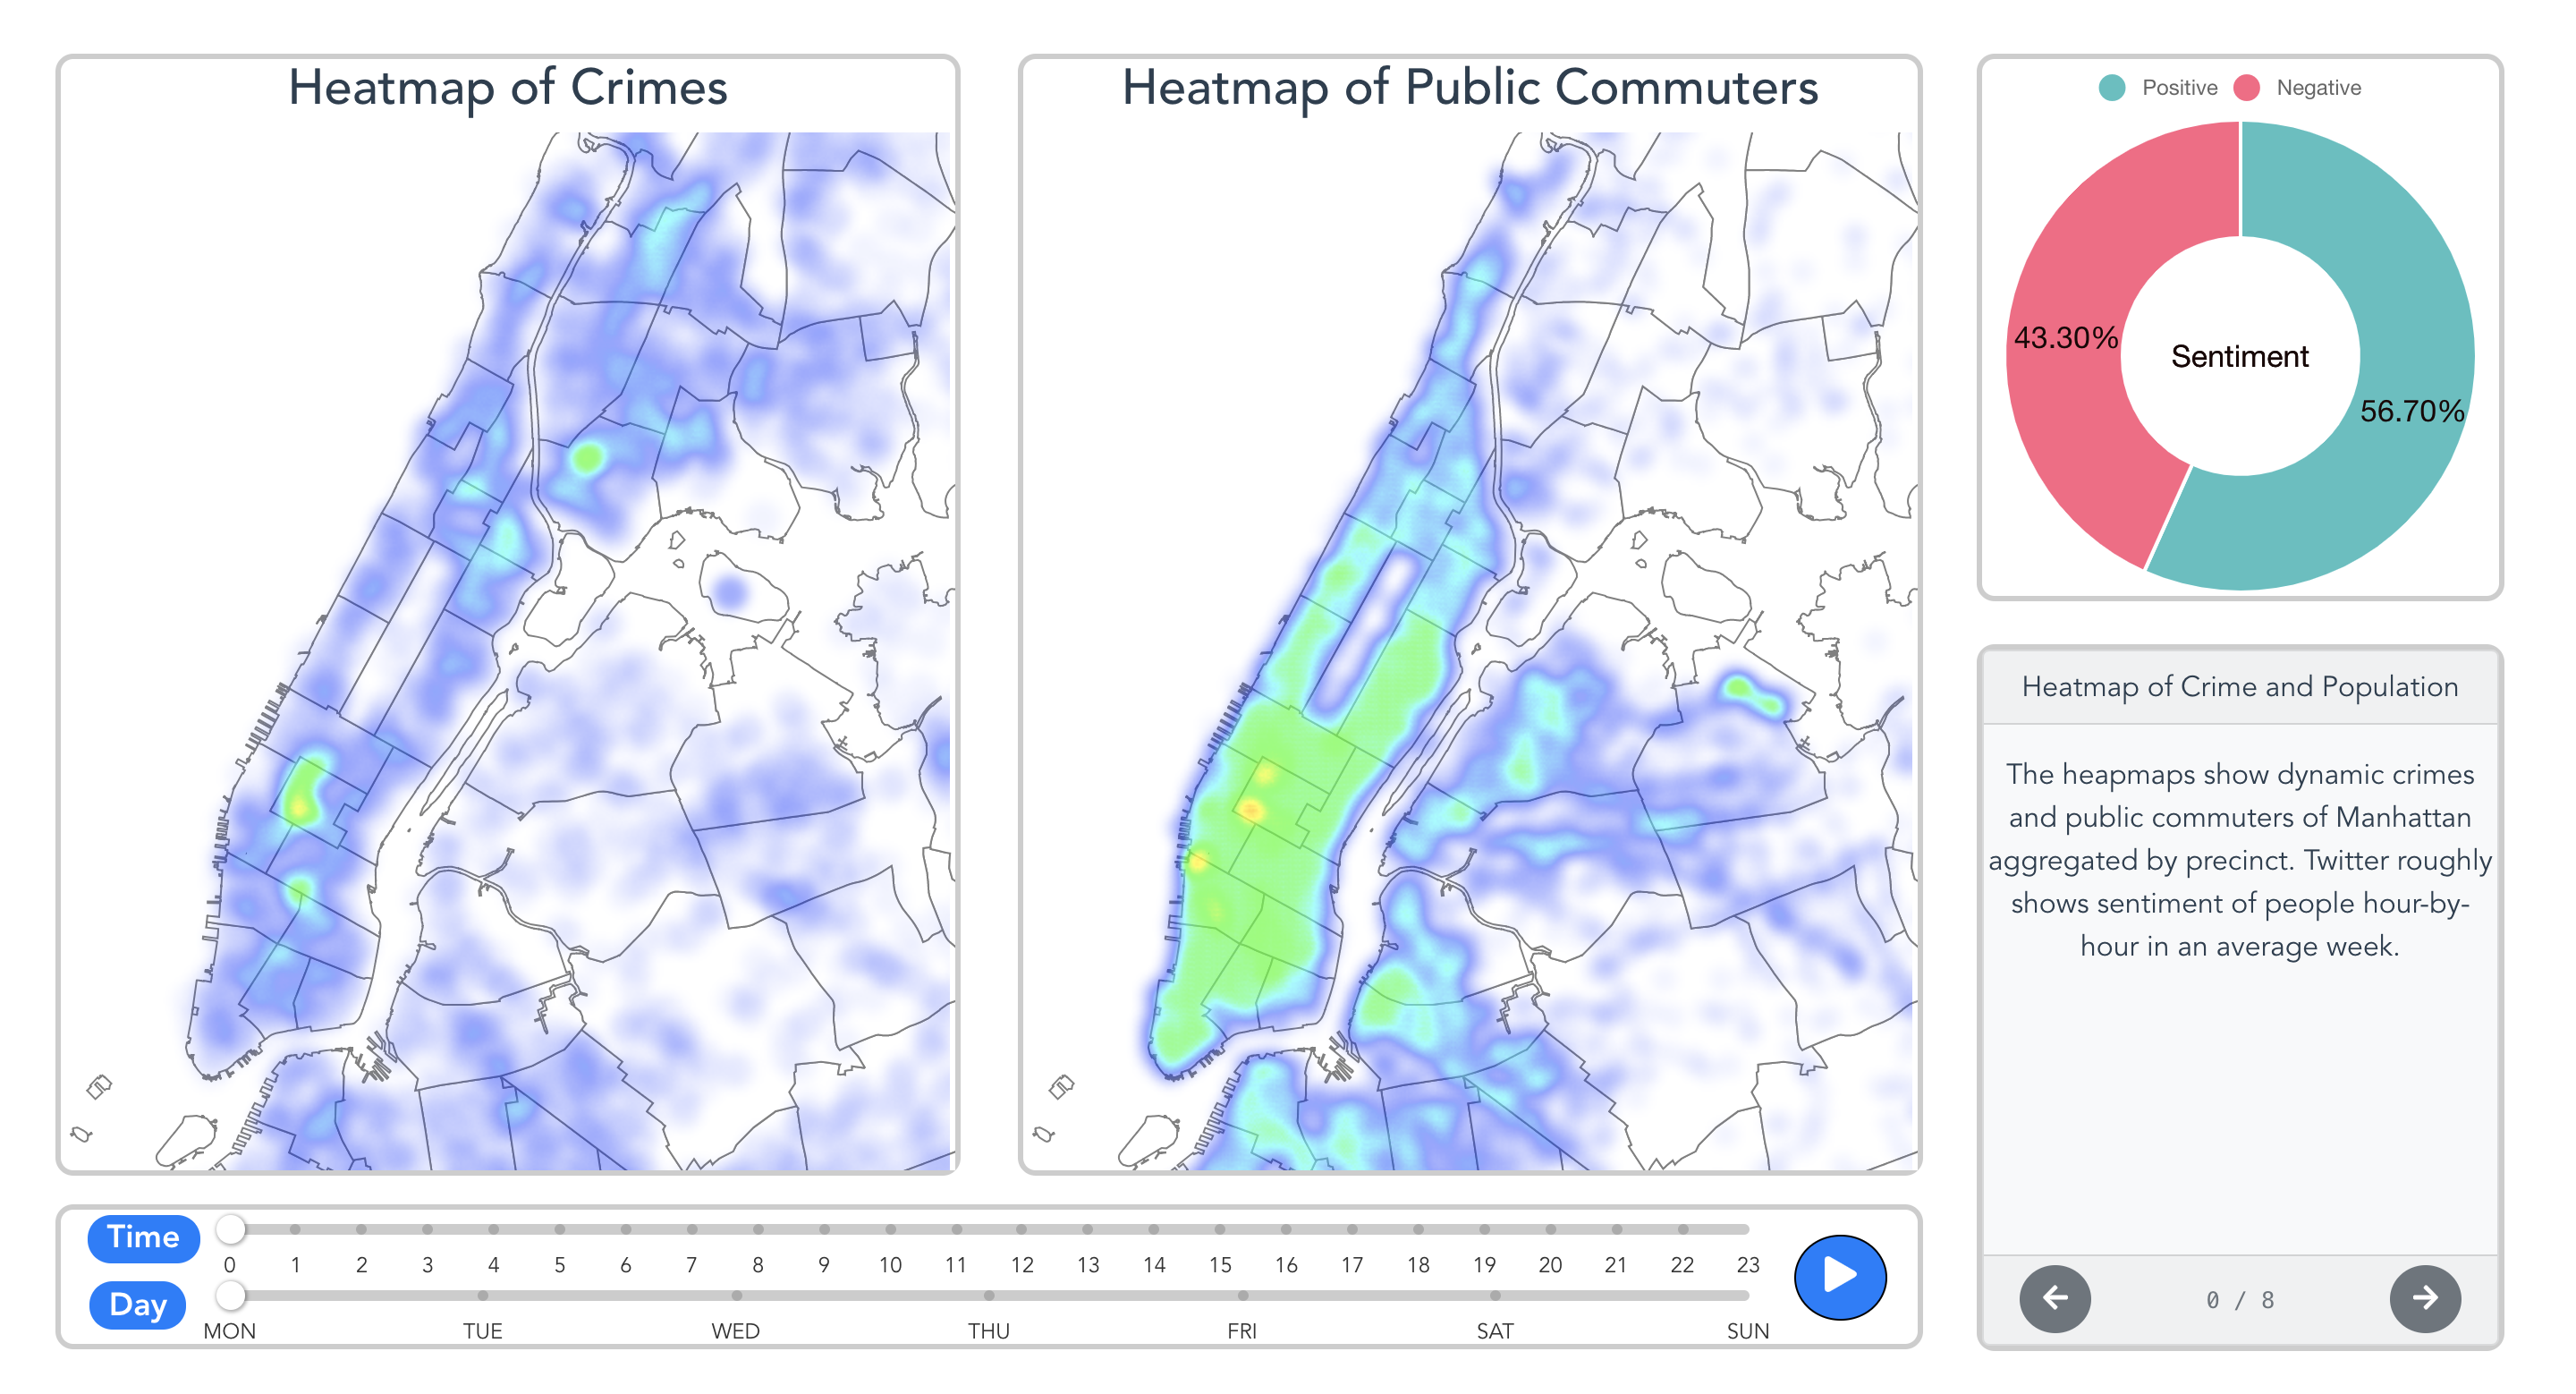
- Heatmap Chart
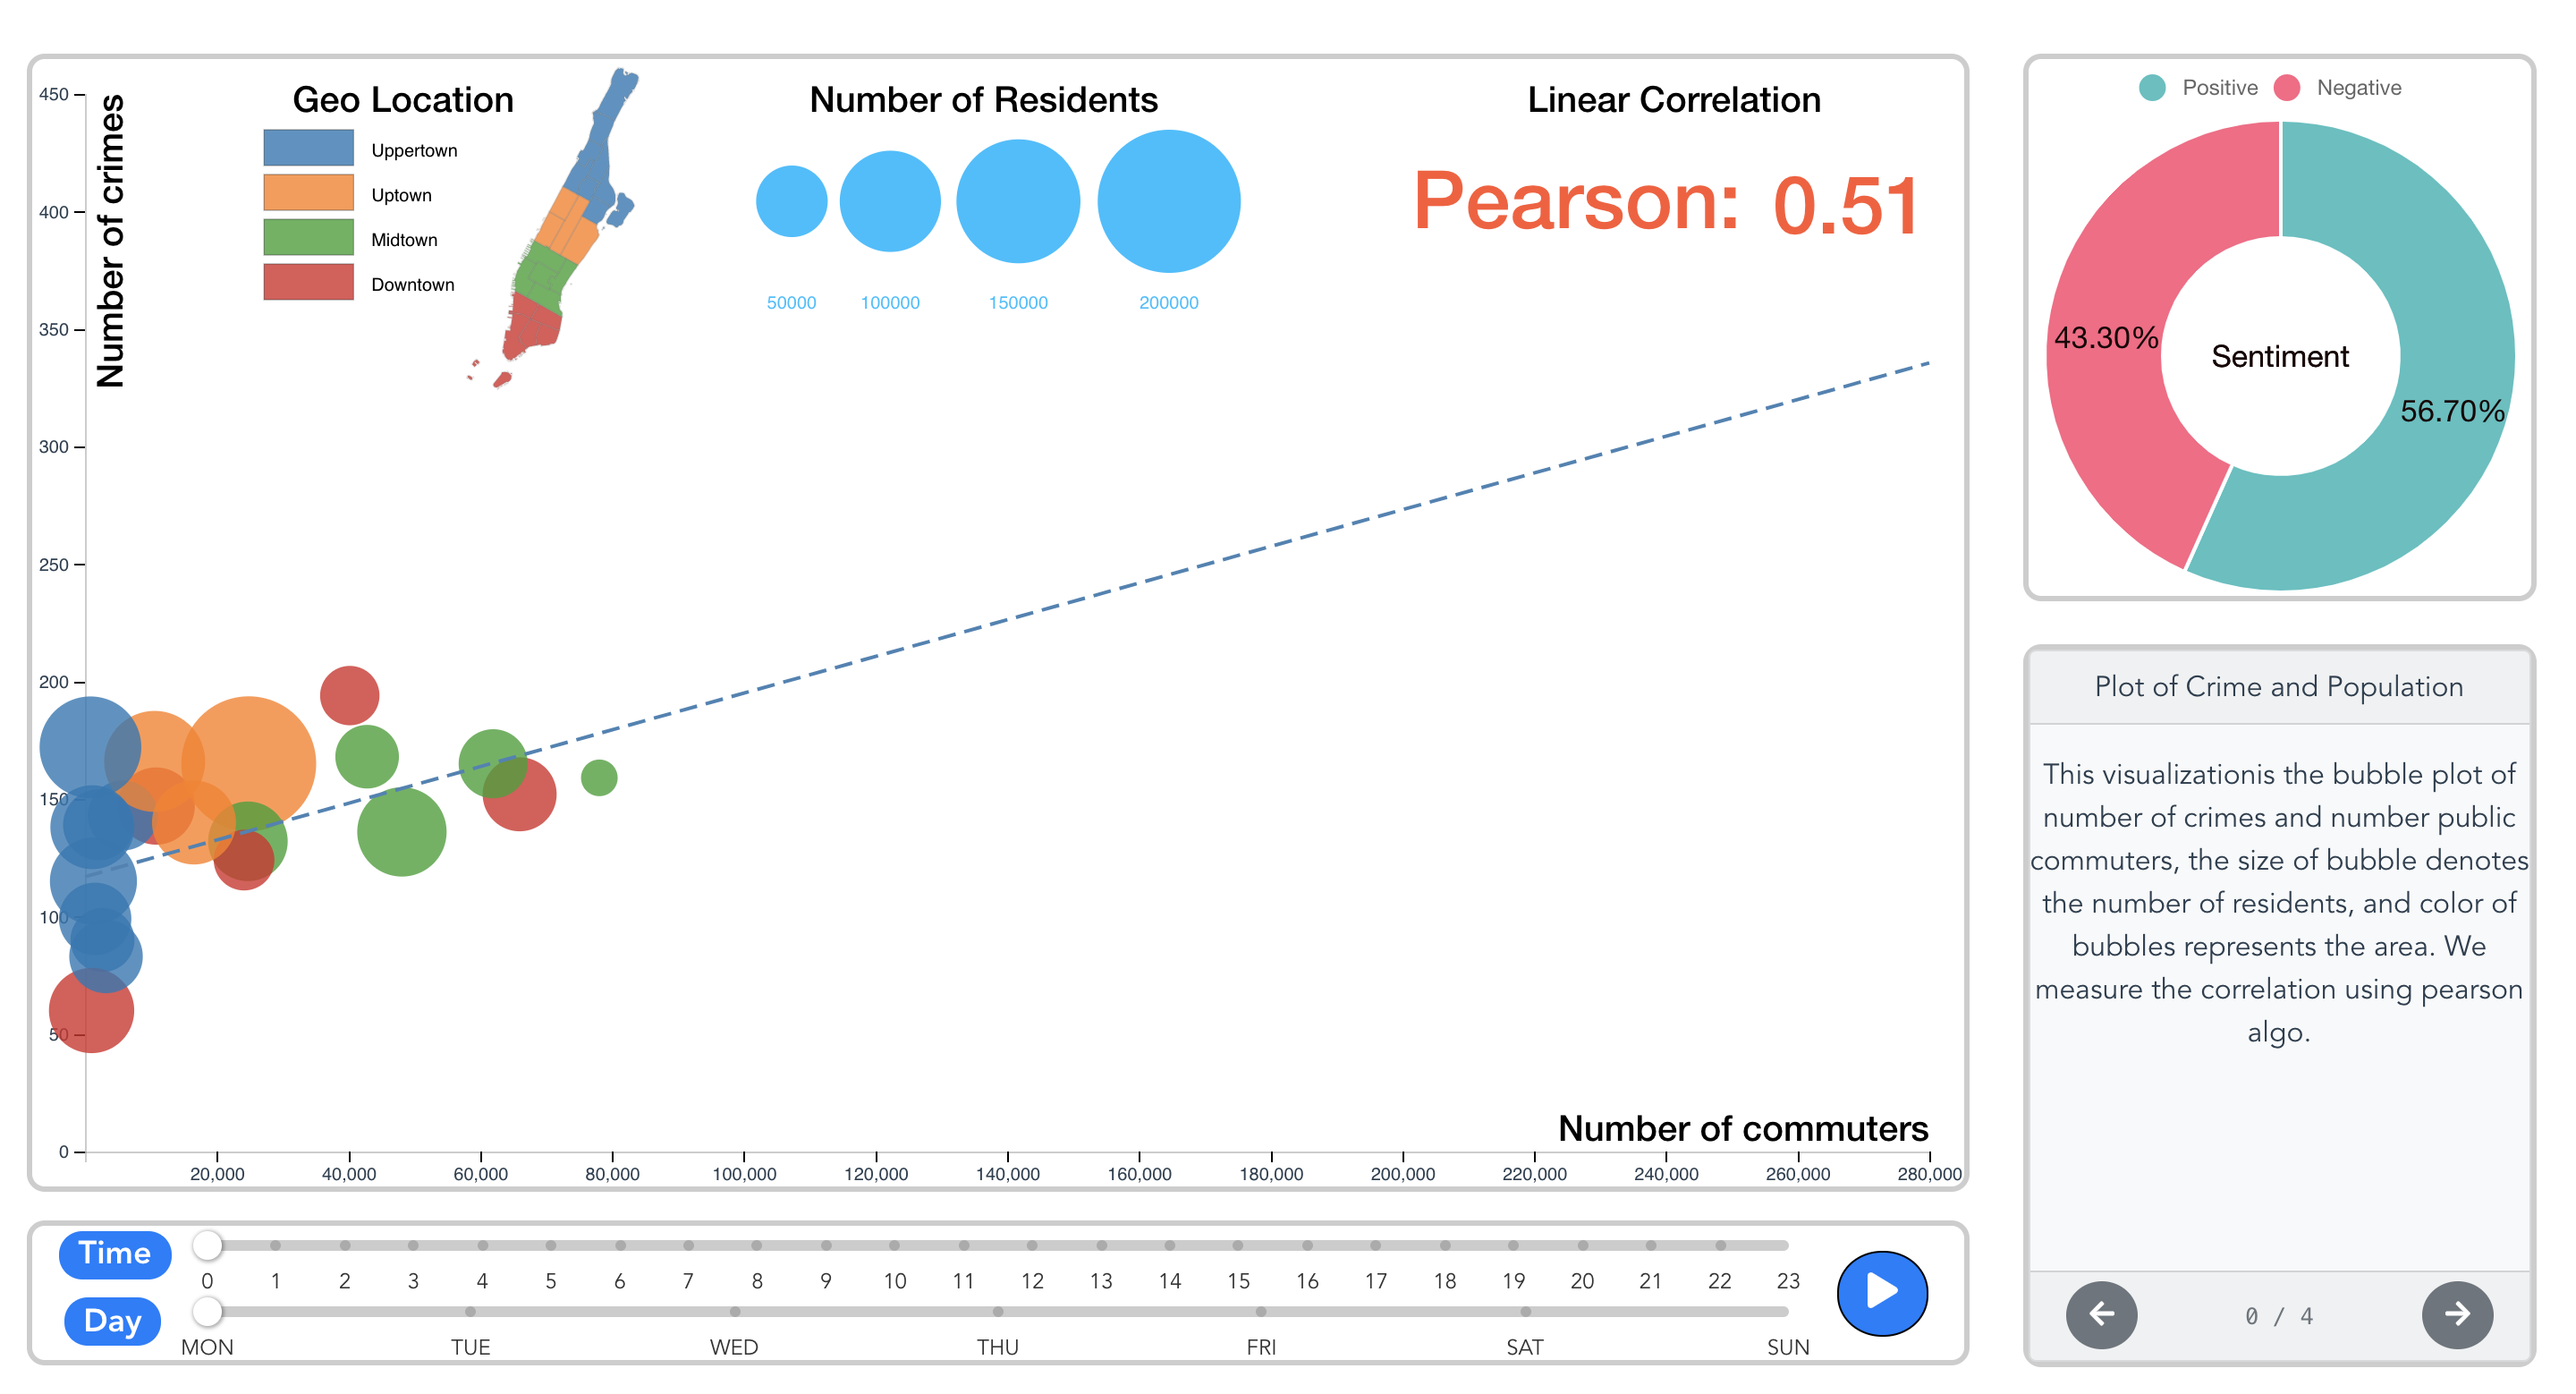
- Bubble Chart
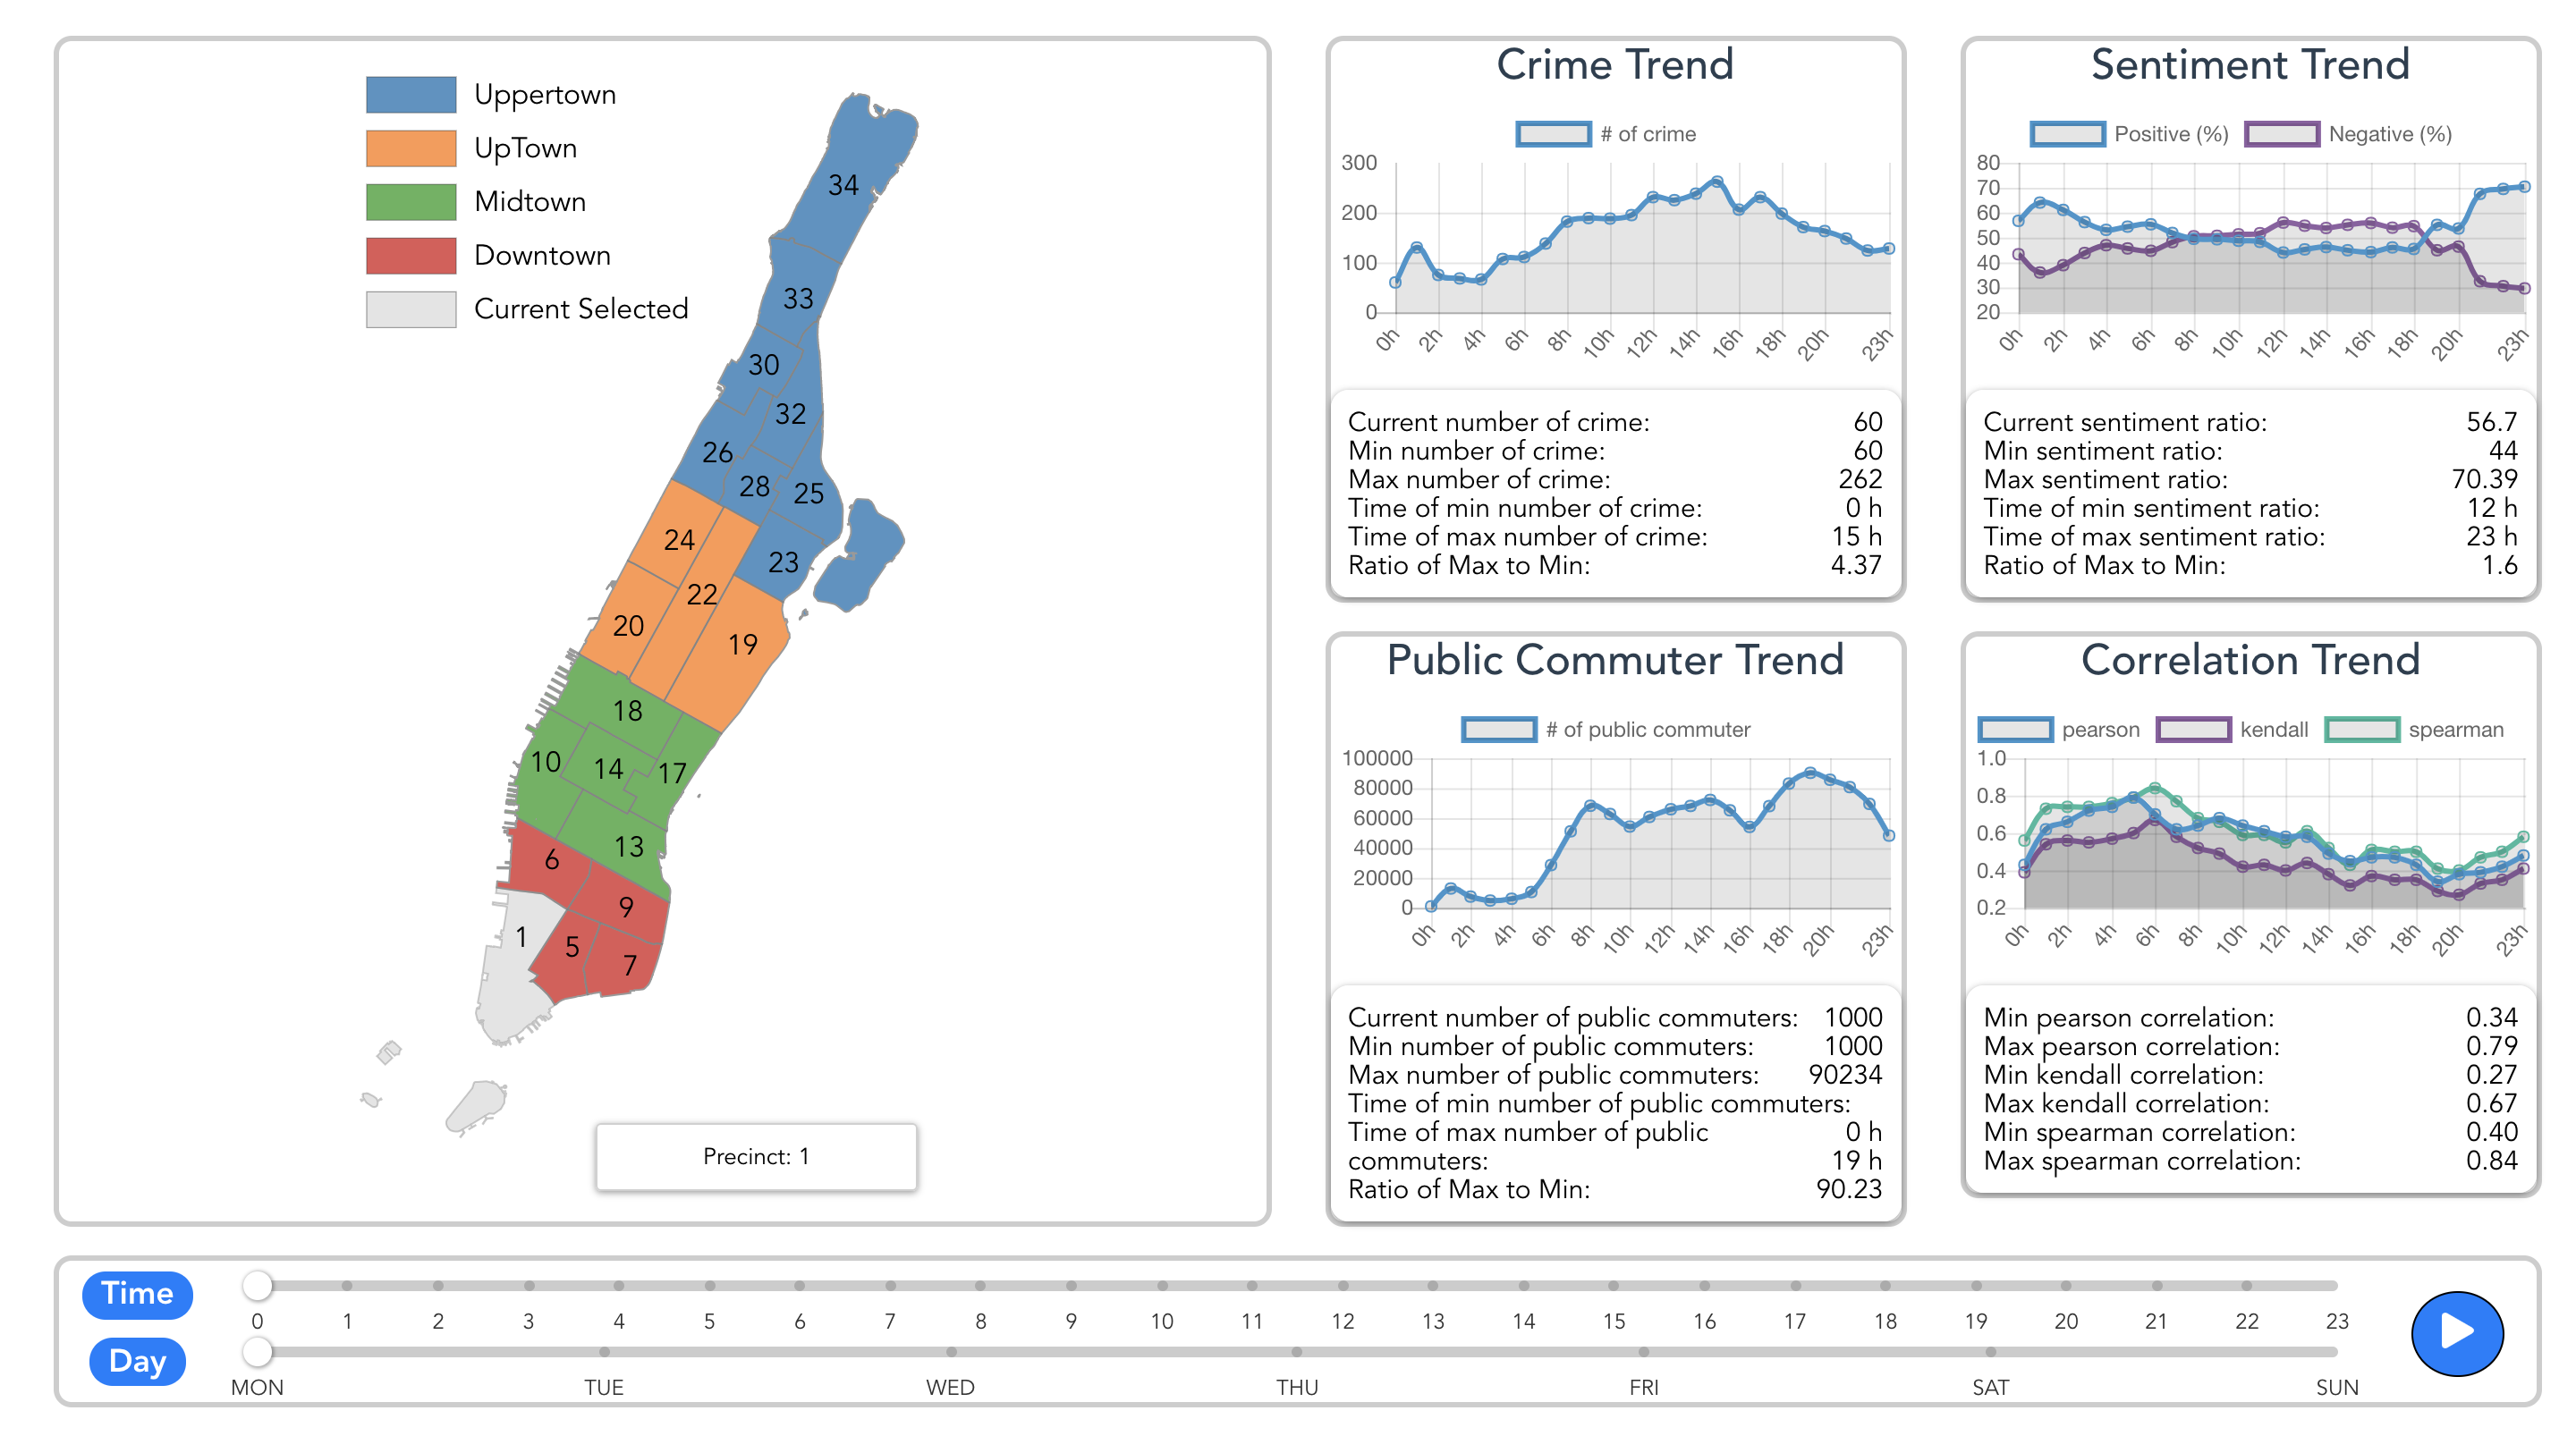
- Statistic Chart
folder: _reports/
# Clone repository
git clone [email protected]:zhichengMLE/relationship-among-crimes-public-commuters-and-sentiment-in-manhattan.git

# install dependencies
npm install

# serve with hot reload at localhost:8080
npm run dev

# build for production with minification
npm run build

# Run it in public in GCP.
HOST='0.0.0.0' PORT=8080 npm start
-
MTA (subway):
-
New York City MTA Station Location (very small)
-
Taxis: NYC 2014 Yellow Taxi Trip Data (25GB)
-
Download and extract from really large archive dataset (all month twitter information). (https://archive.org/details/twitterstream?and[]=year%3A%222014%22)
- 2014-02: https://archive.org/details/archiveteam-twitter-stream-2014-02 (33.8GB)
- 2014-03: https://archive.org/details/archiveteam-twitter-stream-2014-03 (46.2GB)
- 2014-04: https://archive.org/details/archiveteam-twitter-stream-2014-04 (45.1GB)
- 2014-05: https://archive.org/details/archiveteam-twitter-stream-2014-05 (44.7GB)
- 2014-10: https://archive.org/details/archiveteam-twitter-stream-2014-10 (47.6GB)
- 2014-11: https://archive.org/details/archiveteam-twitter-stream-2014-11 (47.5GB)
- 2014-12: https://archive.org/details/archiveteam-twitter-stream-2014-12 (48.8GB)
-
Process the data and extract twitter in New York and tweet time.
Population / Age / Sex: Decennial Census - Census 2010 - https://www1.nyc.gov/site/planning/data-maps/nyc-population/census-2010.page
Similar as what has done in this website: https://popfactfinder.planning.nyc.gov/?lastreport=census#12.79/40.77387/-73.95082
Decennial Census Every ten years the U. S. Census Bureau conducts a decennial census, primarily for purposes of congressional reapportionment. These censuses count every person in the country and collect only the most basic demographic and housing characteristics (like, age, sex, race, and housing tenure). The decennial census provides the most accurate and detailed understanding about the count and distribution of the U. S. population. It is also important to note that private information (such as names and addresses) collected through the census is protected under Title 13 of U. S. Code. To ensure census participant confidentiality, data are never published below the block-level. Consequently, census blocks are the smallest geography used in New York City Population FactFinder (PFF). Beyond census blocks, PFF also re-publishes decennial census data from 2000 and 2010 at the census tract-, Neighborhood Tabulation Area-, and Public Use Microdata Area-levels.
According wiki the following approximate definitions are used:
Upper Manhattan is the area above 96th Street. Uptown Manhattan is the area above 59th Street; Midtown Manhattan is the area between 34th Street and 59th Street. Downtown Manhattan is the area below 14th Street; Lower Manhattan is the area below Chambers Street. (We didn't sperate Downtown and Lower Manhattan)
-
Uptown and Uppertown (same in google, but different in wiki, we use the way to seperate uptown and uppertown in wiki.): https://www.google.com/maps/place/Upper+Manhattan,+New+York,+NY/@40.8305616,-73.9759374,13z/data=!3m1!4b1!4m5!3m4!1s0x89c2f6131f319d63:0x158166d40c6168ed!8m2!3d40.8240478!4d-73.9447643

-
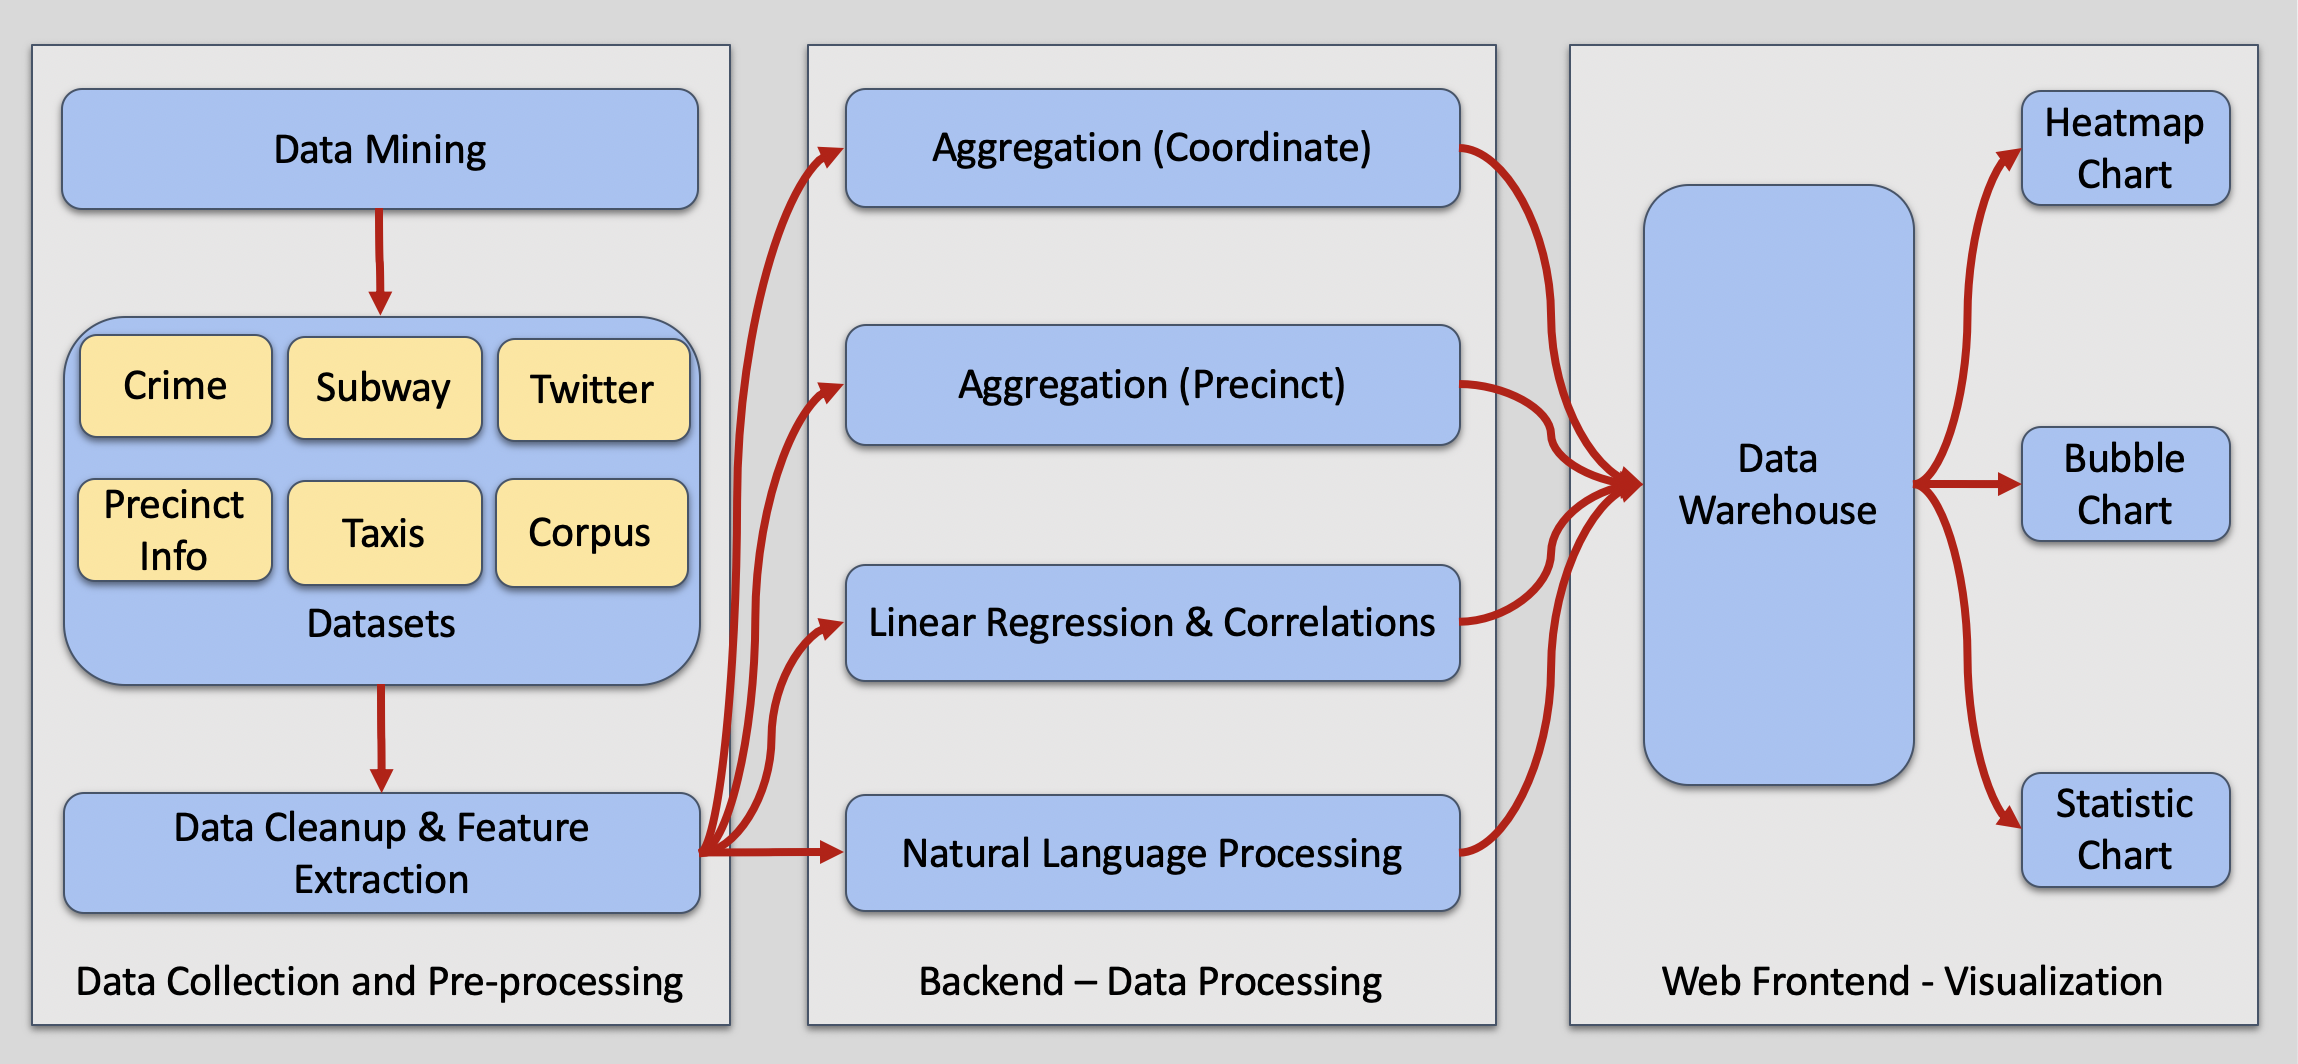
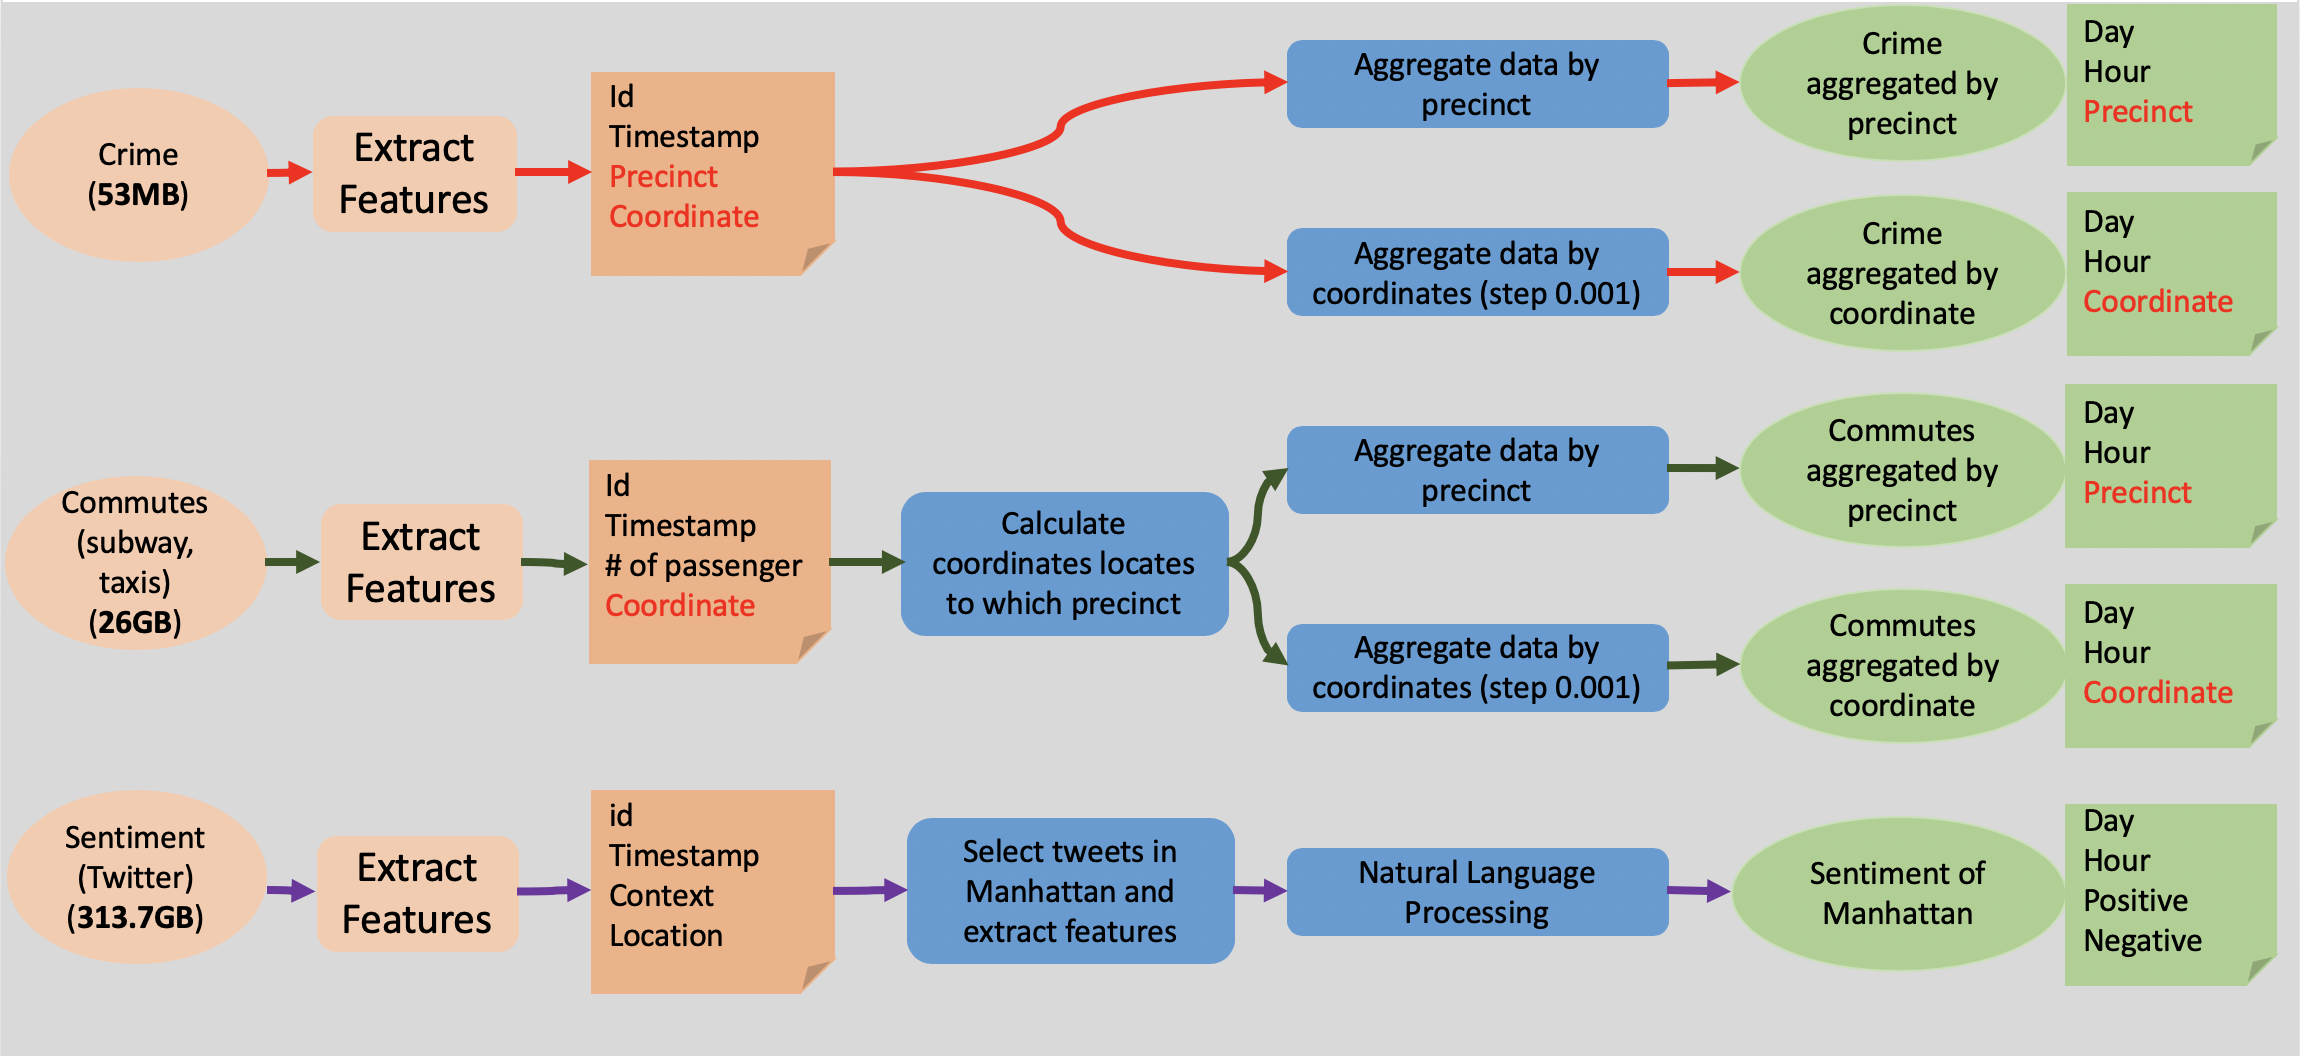
Natural Language Processing. We use NLP-based algorithm to process twitter dataset to get sentiment value. We use TextBlob which is a Python package of using \textit{NLTK} and pattern to process context.
-
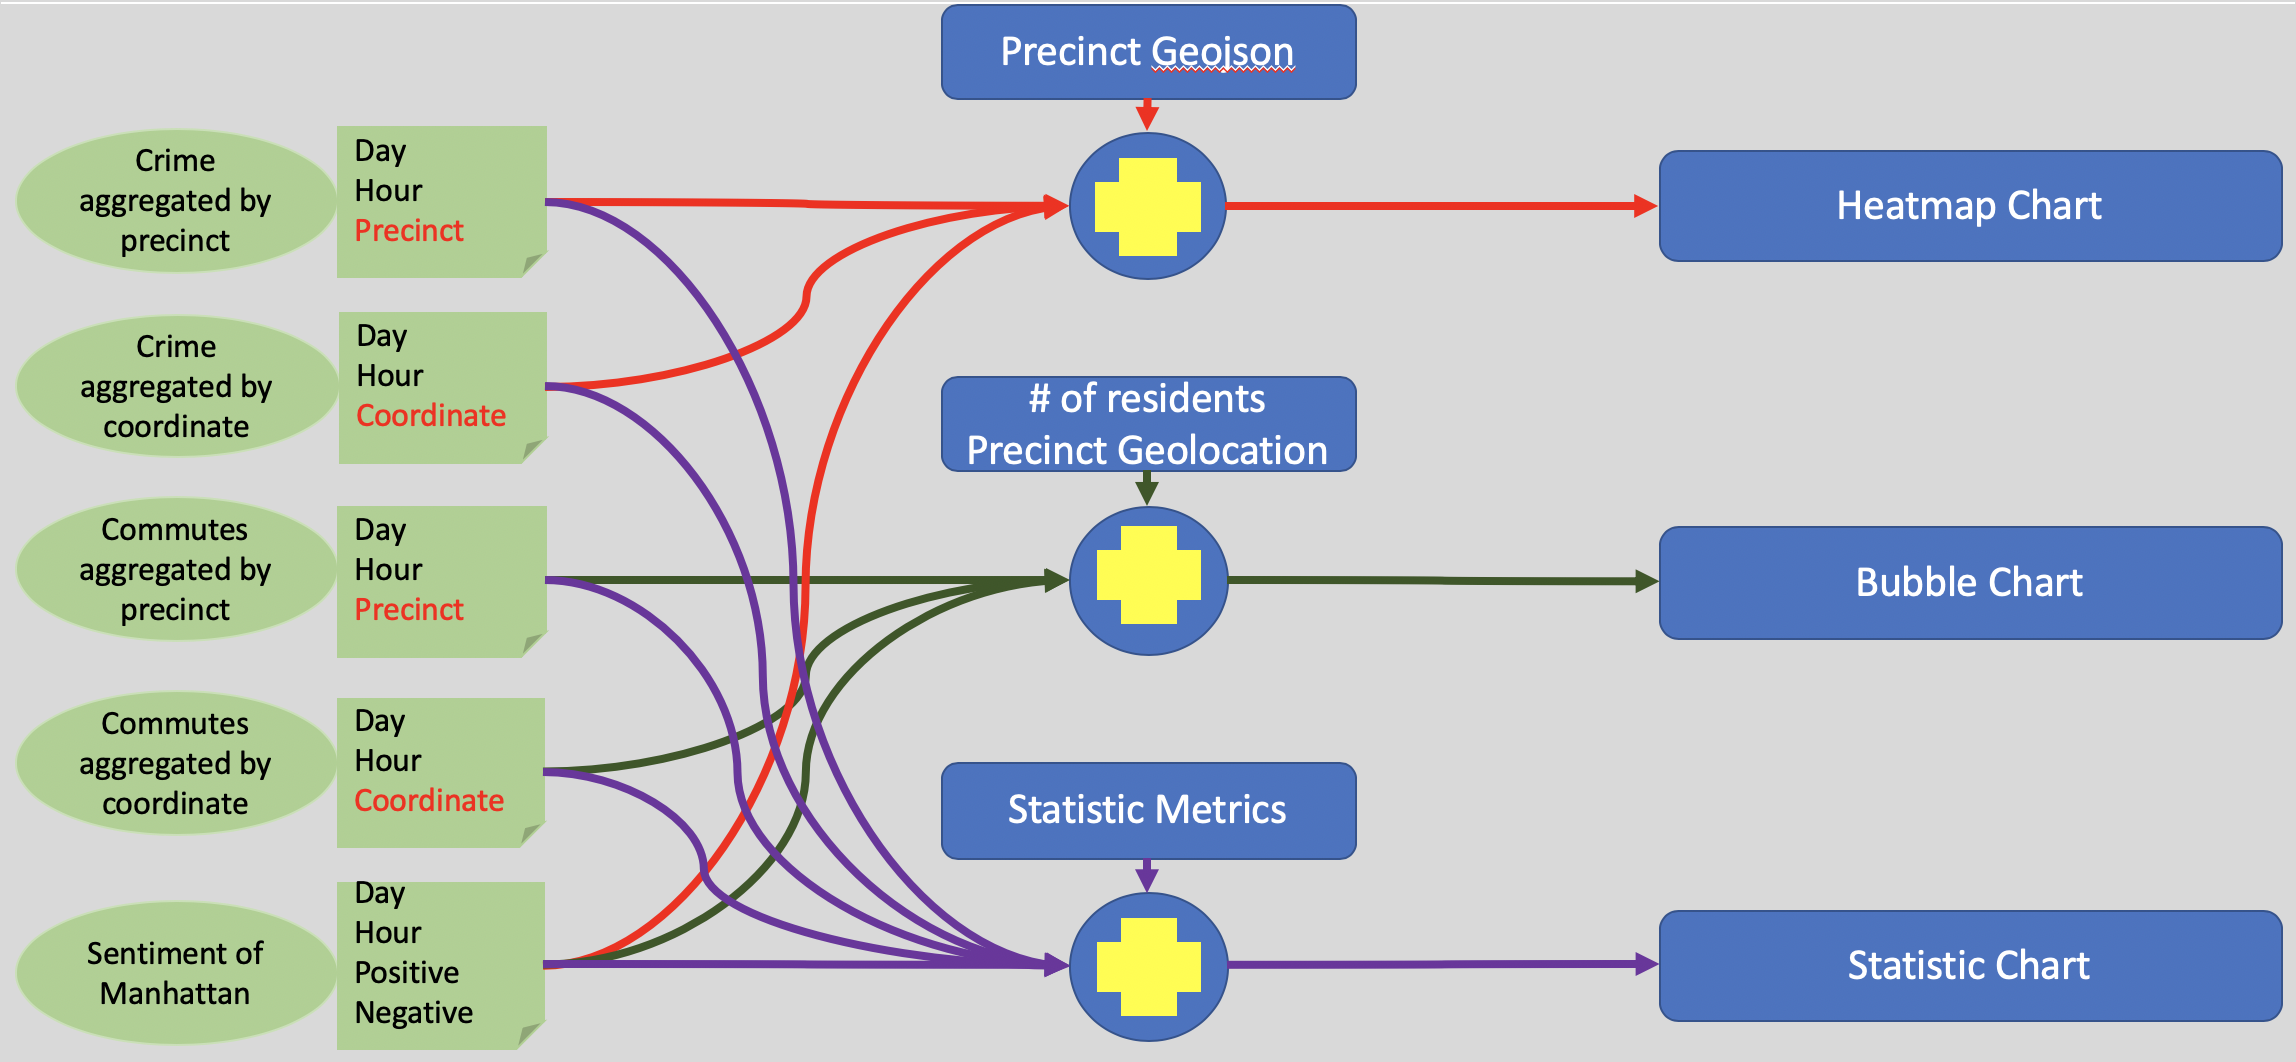
Calculate Point inside/outside of Polygon. We use this algorithm to convert coordinate to precinct number.
-
Calculate Geo Center of Polygon. We use this algorithm to put the precinct number of the map which provide better visualization effect.
-
Linear Regression. We use linear regression to fit the model in bubble chart which help to explore the linear relationship of number of crime and number of commuters.
-
Correlation Algorithms. We use three different correlation algorithm (\ie, Pearson, Kendall, and Spearman) in statistic to better evaluate the correlation of data.
-
Google Cloud Platform. In order to process really large amount of dataset, we use this to store and process data.
-
Pandas. We use this package to process large amount of data chunk by chuck in relatively fast speed.
-
Numpy. We use Numpy to boost the speed of matrix computation.
-
Shapely. Shapely is a Python package for manipulation and analysis of planar geometric objects. We use it to calculate coordinate point inside/outside precinct polygon.
-
{TextBlob. TextBlob is a Python package of using \textit{NLTK} and pattern to process context. We use it to process Twitter context and calculate sentiment polarity.
-
Vue.js. We use Vue.js to design the website because it supports the definition of component which could be reused in different pages.
-
D3.js. We use powerful function of D3.js to manipulate DOM in HTML based on data. Also, the official site of D3.js provides great example which helps us get started.
-
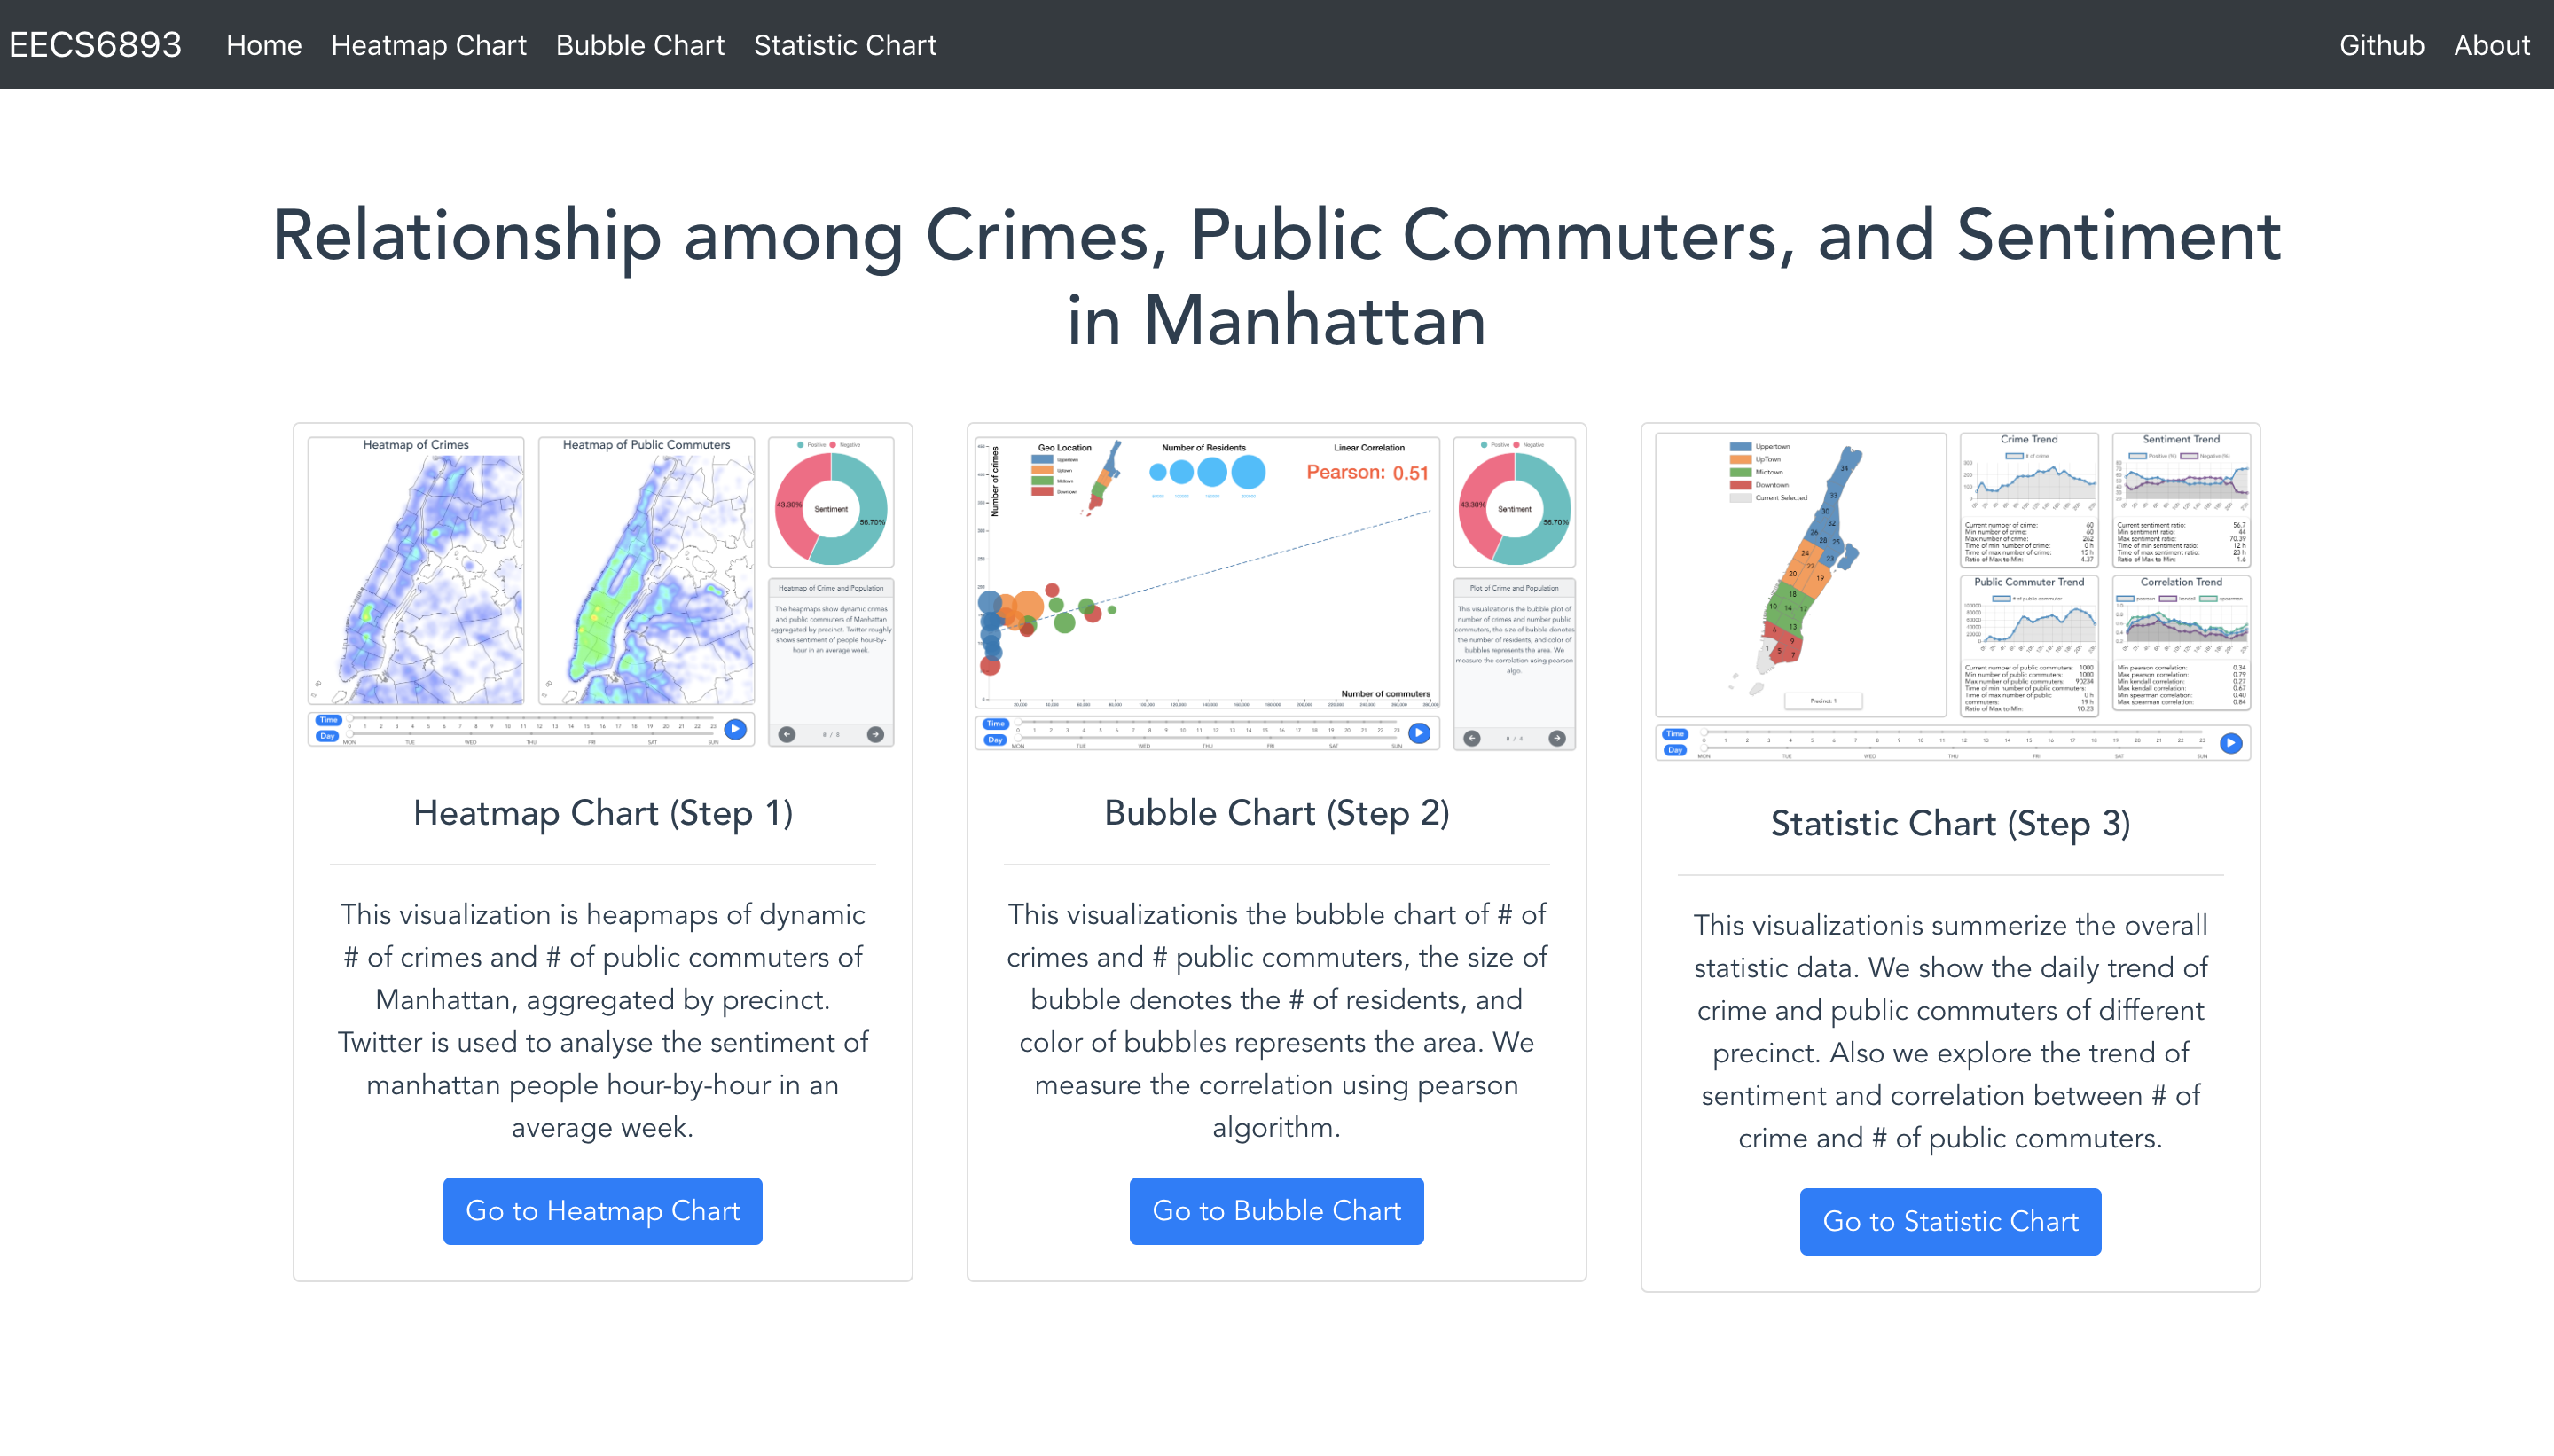
From the heatmap charts, we can see that there are more commuters and crimes in downtown and midtown, while less in the uptown and upper town.
-
From the Pearson correlation calculated, we can see that the number of crimes and commuters are basically positive correlated (about 0.5).
-
From the sentiment analysis, we can see that for the weekdays, people normally more negative during the work hours and they tend to feel more positive after work. While for the weekend, people would be more positive all the day which may result in safety awareness decreasing and lead number of crimes increase.
-
There are also some special events during in people's life. The Wednesday is the saddest day during the whole week, especially during the day time. There is very limited commute while crimes drop a little. People have the most negative mood. The weekend, including the Friday night, has the most high positive feelings.
-
During this time, crimes increase sharply while the city has a high commute population.
From the heat map charts, we notice that there are more commuters and crimes in downtown and midtown, while less in the uptown and upper town. From the Pearson correlation calculated, we can see that the number of crimes and com- muters are basically positive correlated (about 0.5). From the sentiment analysis, we found that for the weekdays, people are more negative during work hours and they tend to feel more positive after work. But for the weekend, people would be more positive all the day which may result in safety awareness decreasing and lead number of crimes increase. There are also some special events during in people’s life. The Wednesday is the saddest day during the whole week, especially during the daytime. There is very limited commute while crimes drop a little. People have the most negative mood. The weekend, including the Friday night, has the highest positive feelings. During this time, crimes increase sharply while the city has a high commuter population. We can make the conclusion that, the crimes have a tight relationship between the city commute population and people sentiment polarity. When the commute population increase, the number of crimes increase. When the sentiment is more positive, the more crimes happen.


