| Project | Status | Version | Npm | CDN | Description |
|---|---|---|---|---|---|
| ol3-echarts | |
 |
 |
support for openlayers3-4 | |
| ol-echarts | |
 |
 |
support for openlayers5+ |
ol 7.x 以后请使用 ol-echarts v4.x,ol 7.x 之前请使用 ol-echarts v3.x,原因见 issues/115
git clone https://github.com/sakitam-fdd/ol3Echarts.git
yarn run bootstrap
yarn run dev
yarn run build
yarn run karma.test注意:npm下存在两个包 ol3-echarts 和 ol-echarts 前者是在使用 openlayers 或者是
ol的cdn时使用;后者是在使用 ol 配合打包工具使用。
// old openlayers package
npm install ol3-echarts --save
import ol3Echarts from 'ol3-echarts'

// ol package
npm install ol-echarts --save
import EChartsLayer from 'ol-echarts'
cdn 引用方式只支持 旧版
openlayers和新版ol的cdn引用方式,统一使用ol3-echarts支持。
目前可通过 unpkg.com / jsdelivr 获取最新版本的资源。
// jsdelivr (jsdelivr由于缓存原因最好锁定版本号)
https://cdn.jsdelivr.net/npm/[email protected]/dist/ol3Echarts.js
https://cdn.jsdelivr.net/npm/[email protected]/dist/ol3Echarts.min.js
// npm
https://unpkg.com/ol3-echarts/dist/ol3Echarts.js
https://unpkg.com/ol3-echarts/dist/ol3Echarts.min.js<div id="map"></div>
<script src="https://cdn.jsdelivr.net/npm/openlayers/dist/ol.js"></script>
<script src="https://cdn.jsdelivr.net/npm/echarts/dist/echarts.js"></script>
<script src="https://cdn.jsdelivr.net/npm/ol3-echarts/dist/ol3Echarts.js"></script>
<script>
var Map = new ol.Map({
target: container,
layers: [
new ol.layer.Tile({
preload: 4,
source: new ol.source.OSM()
})
],
loadTilesWhileAnimating: true,
view: new ol.View({
projection: 'EPSG:4326',
center: [120.74758724751435, 30.760422266949334],
zoom: 8
})
});
var echartslayer = new ol3Echarts(echartsOption, {
source: '',
destination: '',
hideOnMoving: true,
forcedRerender: false,
forcedPrecomposeRerender: false
});
echartslayer.appendTo(Map)
</script>如果你已经对 ol 执行构建 build-legacy 那么你将能够获取一个可以通过 script 引入的 ol.js 包,这样的话你也可以使用
ol-echarts 下的 ol-echarts.js, 如果碰到鼠标事件问题,请参照 issues #45
<div id="map"></div>
<script src="https://sakitam-1255686840.cos.ap-beijing.myqcloud.com/cdn/ol/v6.1.1/ol.js"></script>
<script src="https://cdn.jsdelivr.net/npm/echarts/dist/echarts.js"></script>
<script src="https://unpkg.com/ol-echarts/dist/ol-echarts.js"></script>
<script>
  var osm = new ol.layer.Tile({
    source: new ol.source.OSM()
  });

  var map = new ol.Map({
    target: 'map',
    layers: [
      osm,
    ],
    view: new ol.View({
      center: ol.proj.fromLonLat([108.18095703125005, 34.34141675361363]),
      projection: 'EPSG:3857',
      zoom: 5
    })
  });

  var echartslayer = new EChartsLayer({
    tooltip: {
      trigger: "item",
      formatter: "{a} <br/>{b} : {c} ({d}%)"
    },
    legend: {
      orient: "vertical",
      left: "right",
      data: ["直接访问", "邮件营销", "联盟广告", "视频广告", "搜索引擎"]
    },
    series: [
      {
        name: "访问来源",
        type: "pie",
        radius: "30",
        coordinates: [110.53450137499999, 33.44104525],
        data: [
          { value: 335, name: "直接访问" },
          { value: 310, name: "邮件营销" },
          { value: 234, name: "联盟广告" },
          { value: 135, name: "视频广告" },
          { value: 1548, name: "搜索引擎" }
        ],
        itemStyle: {
          emphasis: {
            shadowBlur: 10,
            shadowOffsetX: 0,
            shadowColor: "rgba(0, 0, 0, 0.5)"
          }
        }
      },
      {
        name: "访问来源",
        type: "pie",
        radius: "30",
        coordinates: [113.53450137499999, 34.44104525],
        data: [
          { value: 335, name: "直接访问" },
          { value: 310, name: "邮件营销" },
          { value: 234, name: "联盟广告" },
          { value: 135, name: "视频广告" },
          { value: 1548, name: "搜索引擎" }
        ],
        itemStyle: {
          emphasis: {
            shadowBlur: 10,
            shadowOffsetX: 0,
            shadowColor: "rgba(0, 0, 0, 0.5)"
          }
        }
      },
      {
        name: "访问来源",
        type: "pie",
        radius: "30",
        coordinates: [110.53450137499999, 38.44104525],
        data: [
          { value: 335, name: "直接访问" },
          { value: 310, name: "邮件营销" },
          { value: 234, name: "联盟广告" },
          { value: 135, name: "视频广告" },
          { value: 1548, name: "搜索引擎" }
        ],
        itemStyle: {
          emphasis: {
            shadowBlur: 10,
            shadowOffsetX: 0,
            shadowColor: "rgba(0, 0, 0, 0.5)"
          }
        }
      }
    ]
  });

  echartslayer.appendTo(map);
</script>import * as React from 'react';
import { Map, View } from 'ol';
import TileLayer from 'ol/layer/Tile';
import XYZ from 'ol/source/XYZ';
import 'ol/ol.css';
import EChartsLayer from 'ol-echarts';
class Index extends React.Component {
constructor (props, context) {
super(props, context);
this.state = {
zoom: 14,
fov: 0,
pitch: 0,
bearing: 0
};
this.container = null;
this.map = null;
}
componentDidMount () {
this.map = new Map({
target: this.container,
view: new View({
center: [113.53450137499999, 34.44104525],
projection: 'EPSG:4326',
zoom: 5 // resolution
}),
layers: [
new TileLayer({
source: new XYZ({
url: 'http://cache1.arcgisonline.cn/arcgis/rest/services/ChinaOnline' +
'StreetPurplishBlue/MapServer/tile/{z}/{y}/{x}'
})
})
]
});
const echartslayer = new EChartsLayer(option, {
hideOnMoving: false,
hideOnZooming: false,
forcedPrecomposeRerender: true
});
echartslayer.appendTo(this.map);
window.setTimeout(() => {
echartslayer.remove();
}, 10 * 1000)
}
setRef = (x = null) => {
this.container = x;
};
render () {
return (<div ref={this.setRef} className="map-content"></div>);
}
}<div id="map"></div>
<script src="https://cdn.jsdelivr.net/npm/hmap-js/dist/hmap.js"></script>
<script src="https://cdn.jsdelivr.net/npm/echarts/dist/echarts.js"></script>
<script src="https://cdn.jsdelivr.net/npm/ol3-echarts/dist/ol3Echarts.js"></script>
<script>
var Maps = new HMap('map', {
controls: {
loading: true,
zoomSlider: true,
fullScreen: false
},
view: {
center: [113.53450137499999, 34.44104525],
projection: 'EPSG:4326',
zoom: 5, // resolution
},
baseLayers: [
{
layerName: 'vector',
isDefault: true,
layerType: 'TileXYZ',
projection: 'EPSG:3857',
tileGrid: {
tileSize: 256,
extent: [-2.0037507067161843E7, -3.0240971958386254E7, 2.0037507067161843E7, 3.0240971958386205E7],
origin: [-2.0037508342787E7, 2.0037508342787E7],
resolutions: [
156543.03392800014,
78271.51696399994,
39135.75848200009,
19567.87924099992,
9783.93962049996,
4891.96981024998,
2445.98490512499,
1222.992452562495,
611.4962262813797,
305.74811314055756,
152.87405657041106,
76.43702828507324,
38.21851414253662,
19.10925707126831,
9.554628535634155,
4.77731426794937,
2.388657133974685
]
},
layerUrl: 'http://cache1.arcgisonline.cn/arcgis/rest/services/ChinaOnlineStreetPurplishBlue/MapServer/tile/{z}/{y}/{x}'
}
]
});
var echartslayer = new ol3Echarts(echartsOption, {
source: '',
destination: '',
hideOnMoving: true,
forcedRerender: false,
forcedPrecomposeRerender: false
});
echartslayer.appendTo(Maps.getMap())
</script>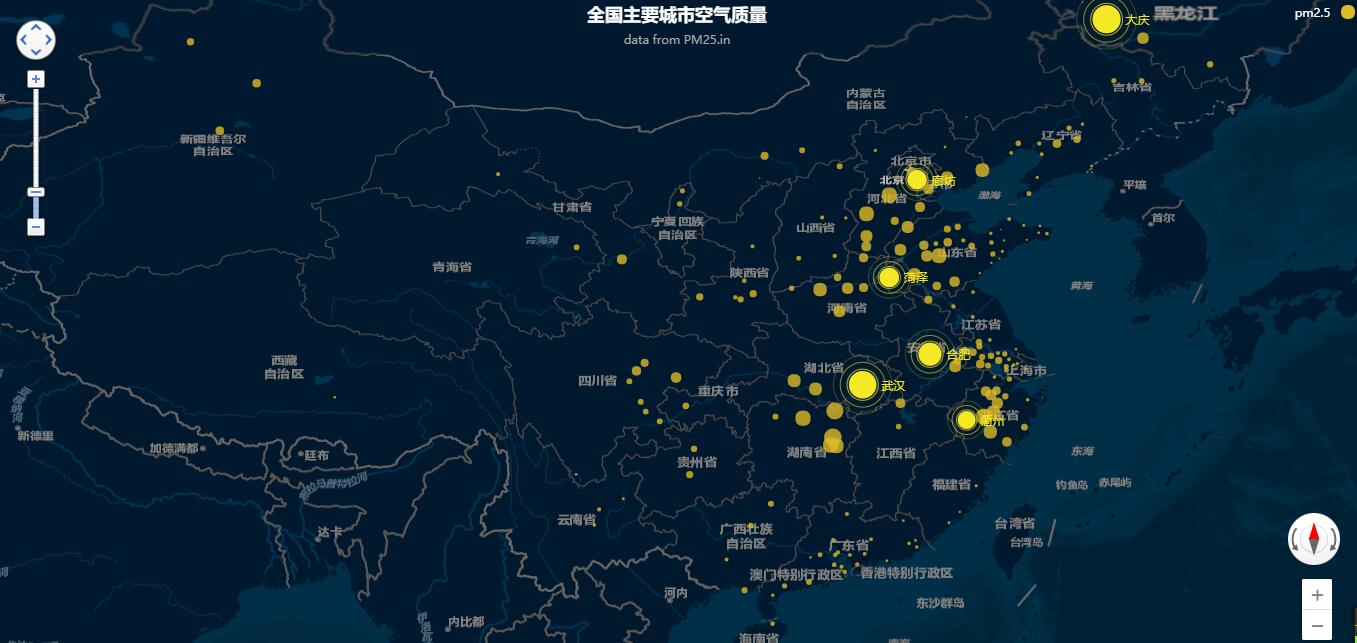
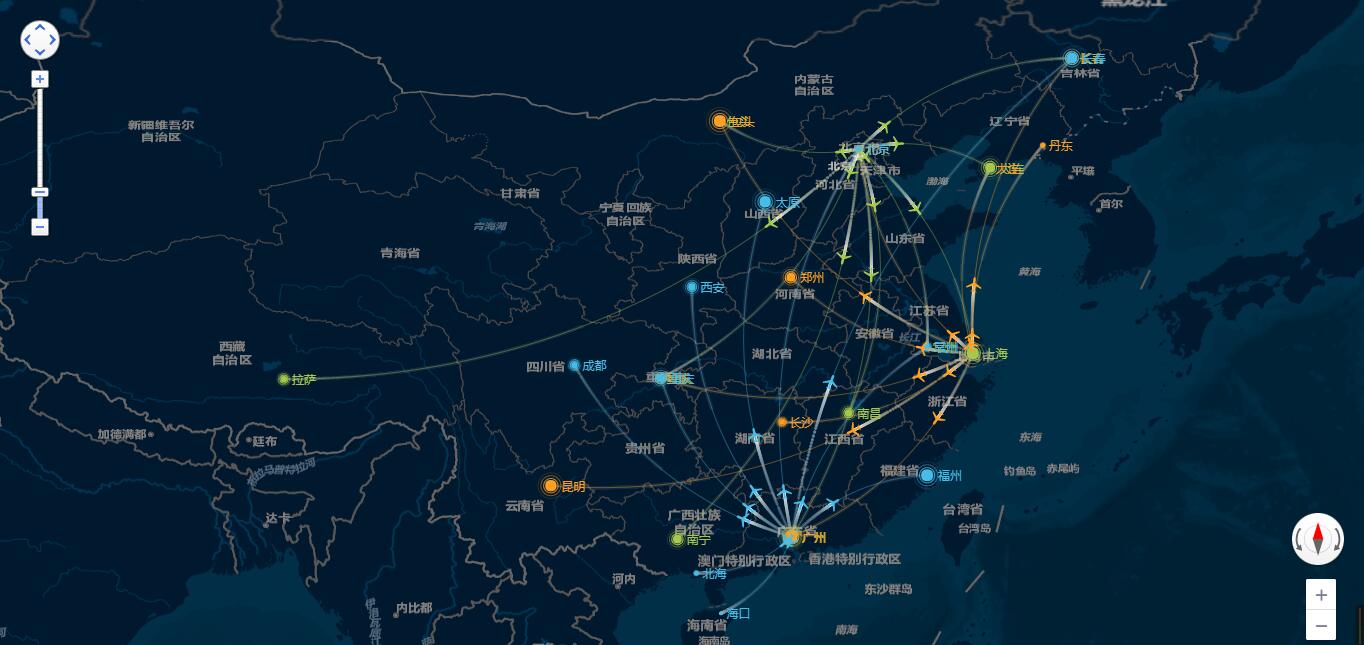

其他示例请自己挖掘

![dependabot[bot] avatar](https://avatars.githubusercontent.com/in/29110?v=4 "dependabot[bot]")