Git Product home page Git Product logo

flexdashboard's Introduction

flexdashboard

CRAN status R-CMD-check

The goal of flexdashboard is to make it easy to create interactive dashboards for R, using R Markdown.

  • Use R Markdown to publish a group of related data visualizations as a dashboard.

  • Support for a wide variety of components including htmlwidgets; base, lattice, and grid graphics; tabular data; gauges and value boxes; and text annotations.

  • Flexible and easy to specify row and column-based layouts. Components are intelligently re-sized to fill the browser and adapted for display on mobile devices.

  • Storyboard layouts for presenting sequences of visualizations and related commentary.

  • Optionally use Shiny to drive visualizations dynamically.

  • Optionally use bslib to easily customize main colors, fonts, and more.

Learn more about flexdashboard: https://pkgs.rstudio.com/flexdashboard

Examples

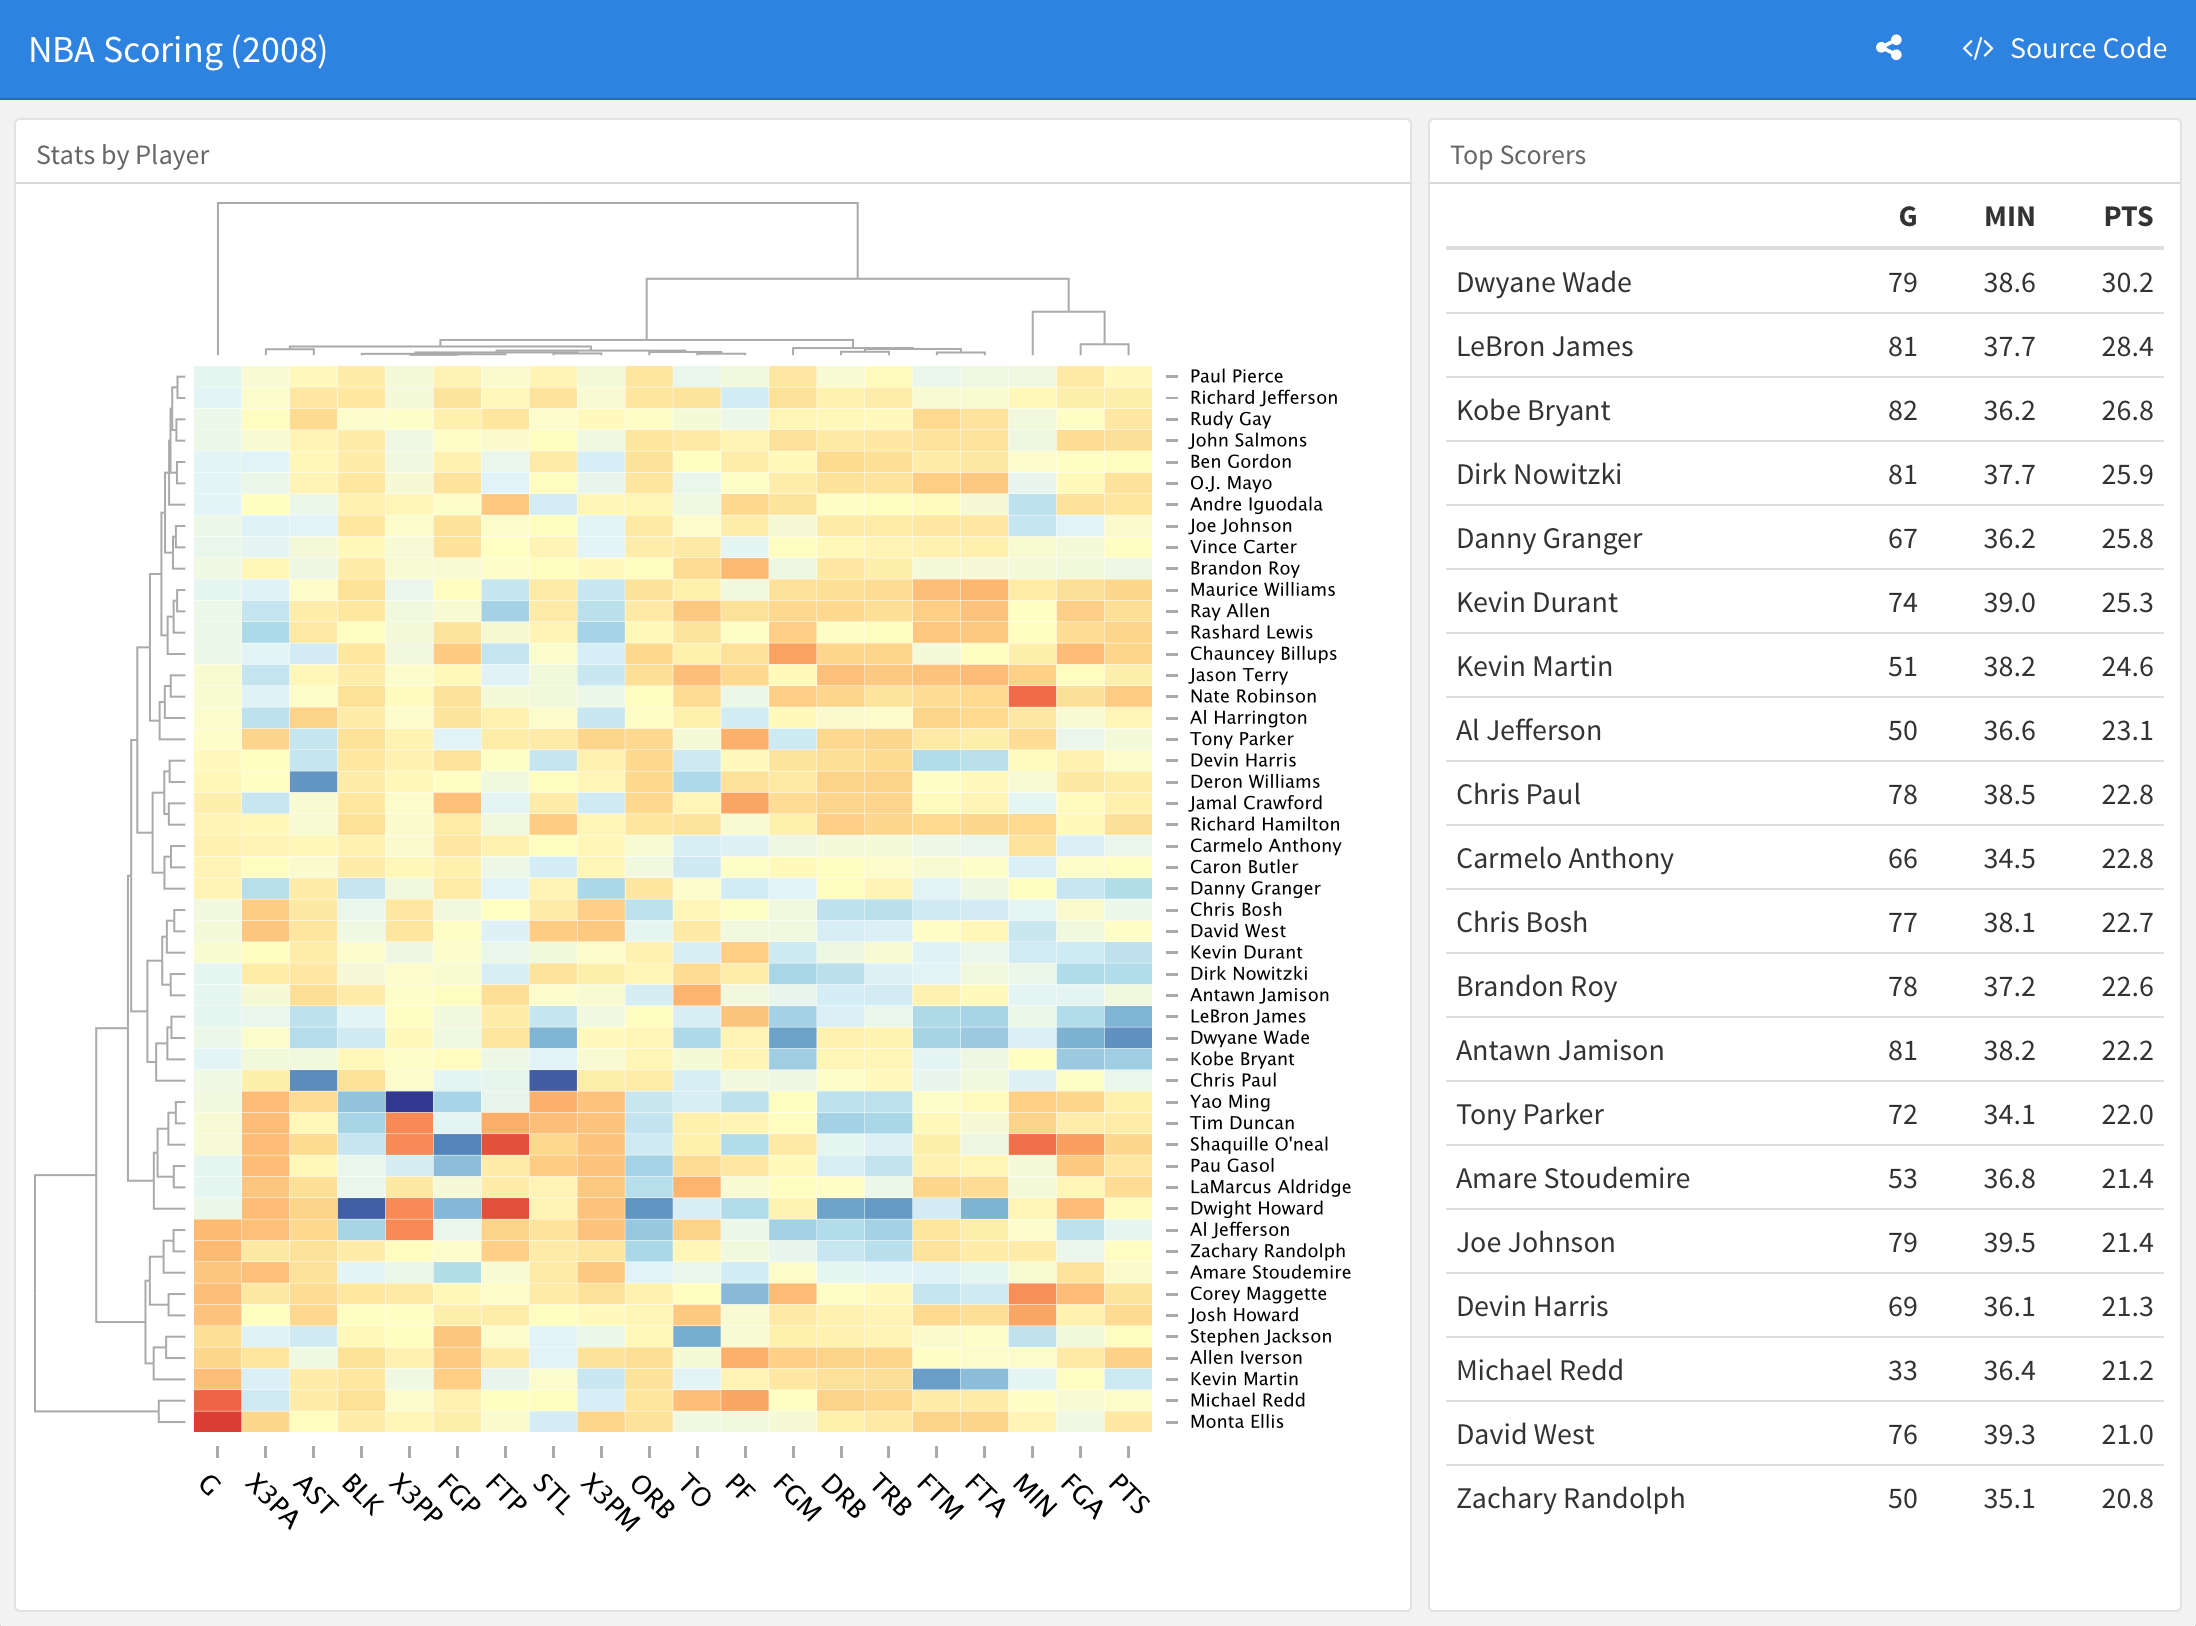
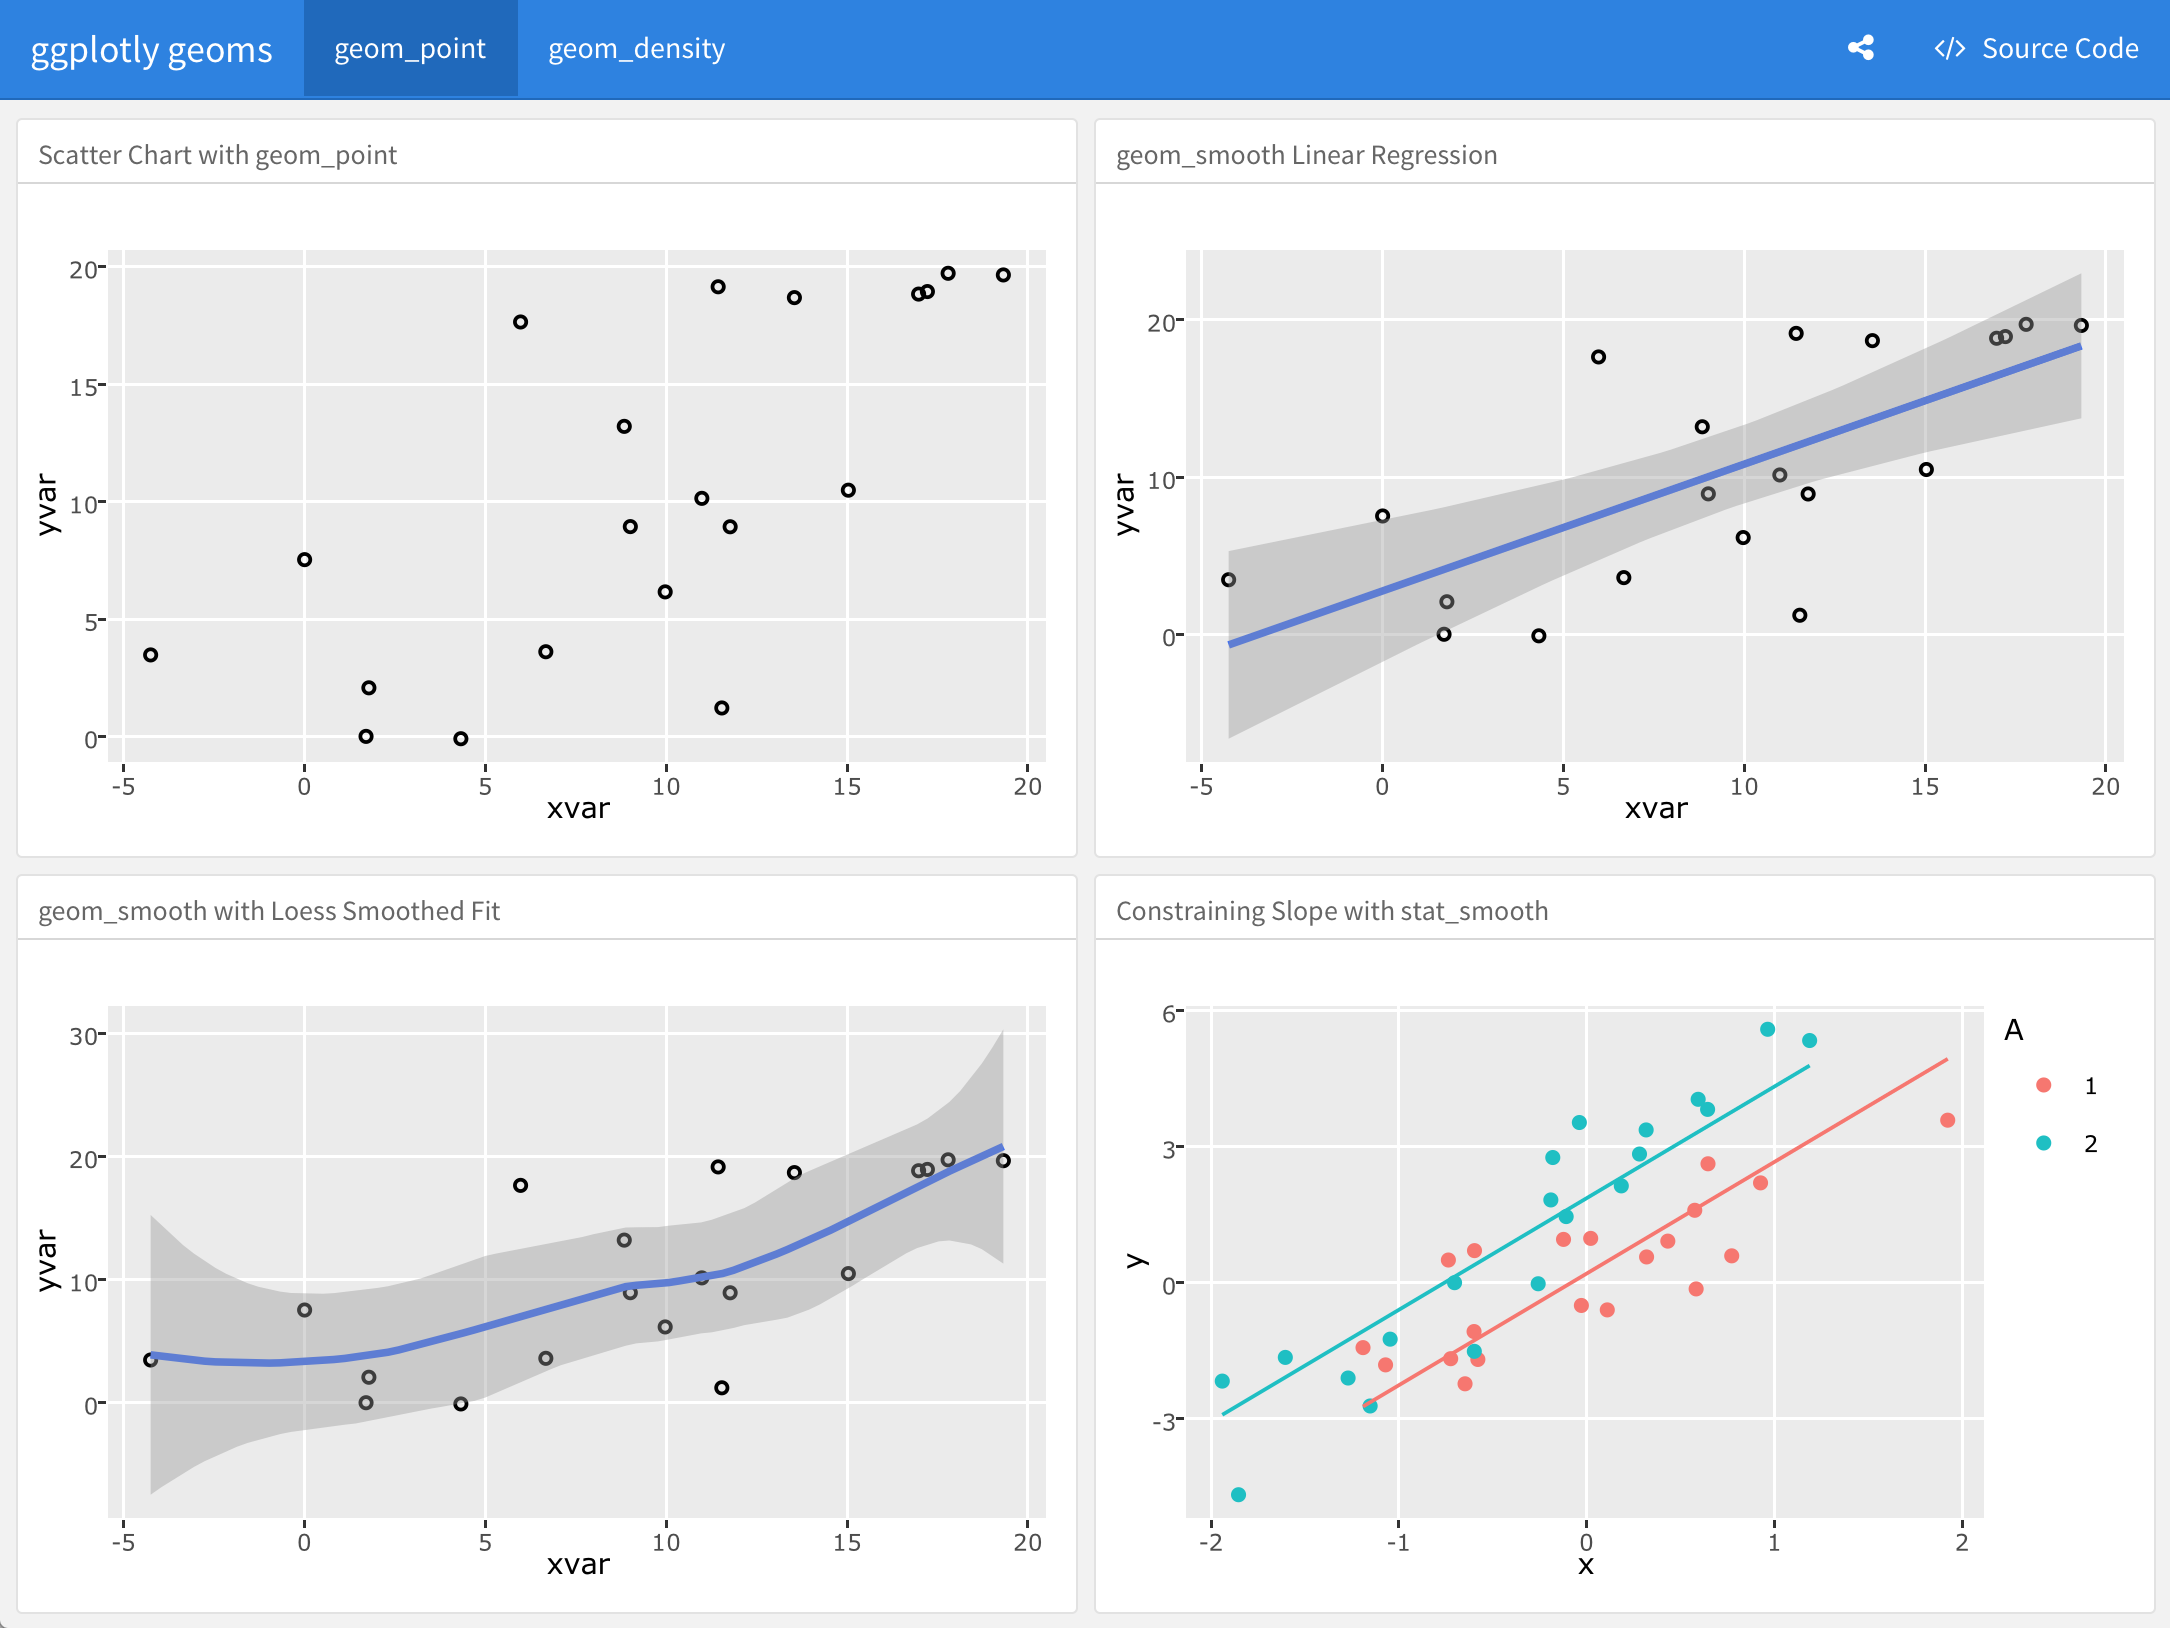
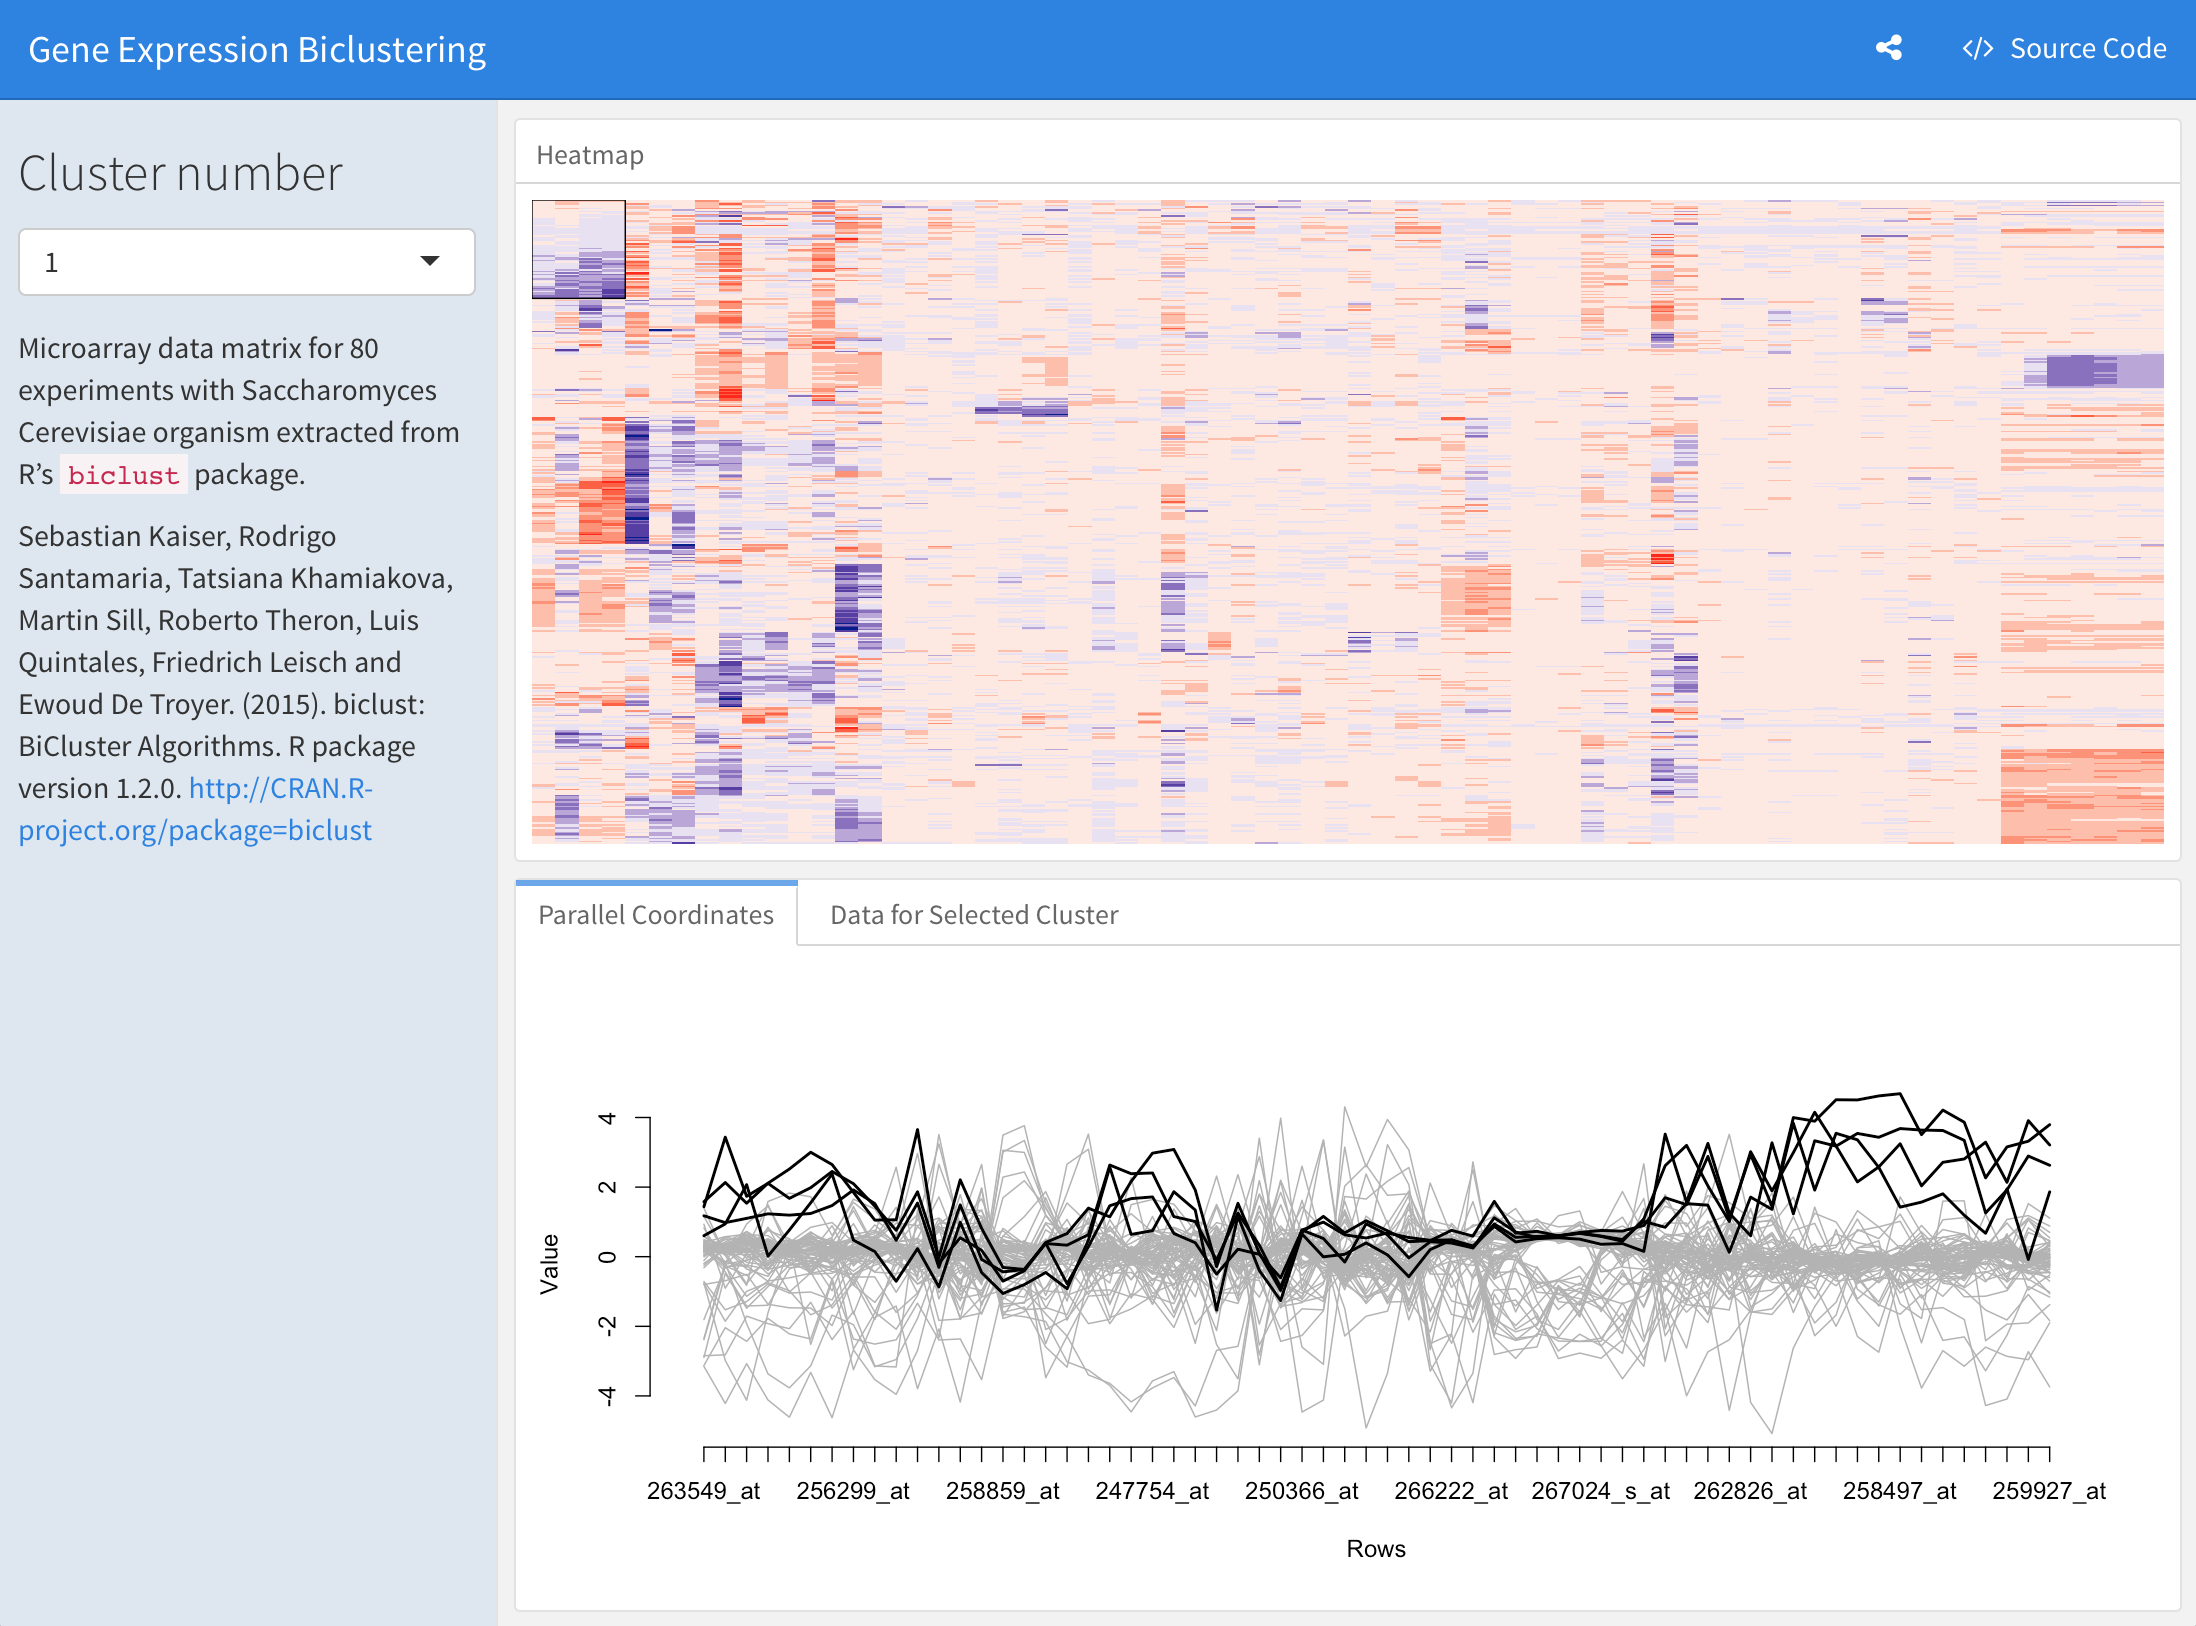
example flexdashboard with d3 heatmap  example flexdashboard using ggplotly  example flexdashboard using Shiny

View more examples here.

Installation

Install the flexdashboard package from CRAN as follows:

install.packages("flexdashboard")

If you want to use the development version of the flexdashboard package, you can install the package from GitHub via the remotes package:

remotes::install_github('rstudio/flexdashboard')

Usage

To author a flexdashboard you create an R Markdown document with the flexdashboard::flex_dashboard output format. You can do this from within RStudio using the New R Markdown dialog:

If you are not using RStudio, you can create a new flexdashboard R Markdown file from the R console. Currently there are two templates:

rmarkdown::draft("dashboard.Rmd",
                 template = "flex_dashboard_bslib",
                 package = "flexdashboard")

Getting help

There are two main places to get help with flexdashboard:

  • The Posit community is a friendly place to ask any questions about flexdashboard. Be sure to use the flexdashboard tag. Add also the shiny tag is you are using a Shiny runtime.

  • Stack Overflow is a great source of answers to common flexdashboard questions. It is also a great place to get help, once you have created a reproducible example that illustrates your problem. Use the tags [r][flexdashboard] if you ask a question. Add the tag [shiny] if you are using a Shiny runtime.

Code of Conduct

Please note that the flexdashboard project is released with a Contributor Code of Conduct. By contributing to this project, you agree to abide by its terms.

flexdashboard's People

Contributors

apreshill avatar bborgesr avatar cderv avatar cpsievert avatar dpprdan avatar emilyriederer avatar erm-eanway avatar felixmil avatar gadenbuie avatar gtritchie avatar hype8912 avatar jcheng5 avatar jjallaire avatar jmuhlich avatar jsinnett avatar randyzwitch avatar rich-iannone avatar schloerke avatar wch avatar yihui avatar yogat3ch avatar

Stargazers

 avatar  avatar  avatar  avatar  avatar  avatar  avatar  avatar  avatar  avatar  avatar  avatar  avatar  avatar  avatar  avatar  avatar  avatar  avatar  avatar  avatar  avatar  avatar  avatar  avatar  avatar  avatar  avatar  avatar  avatar  avatar  avatar  avatar  avatar  avatar  avatar  avatar  avatar  avatar  avatar  avatar  avatar  avatar  avatar  avatar  avatar  avatar  avatar  avatar  avatar  avatar  avatar  avatar  avatar  avatar  avatar  avatar  avatar  avatar  avatar  avatar  avatar  avatar  avatar  avatar  avatar  avatar  avatar  avatar  avatar  avatar  avatar  avatar  avatar  avatar  avatar  avatar  avatar  avatar  avatar  avatar  avatar  avatar  avatar  avatar  avatar  avatar  avatar  avatar  avatar  avatar  avatar  avatar  avatar  avatar  avatar  avatar  avatar  avatar  avatar

Watchers

 avatar  avatar  avatar  avatar  avatar  avatar  avatar  avatar  avatar  avatar  avatar  avatar  avatar  avatar  avatar  avatar  avatar  avatar  avatar  avatar  avatar  avatar  avatar  avatar  avatar  avatar  avatar  avatar  avatar  avatar  avatar  avatar  avatar  avatar  avatar  avatar  avatar  avatar  avatar  avatar  avatar  avatar  avatar  avatar  avatar  avatar  avatar

flexdashboard's Issues

Multiple issues with notes

Adding notes or text before and after {r} code has confusing effects. Starting with this flex doc. Im having a hard time adding rmarkdown code here. it tries to render it and mess it up. Here is the image of the code.
image 3

Which results in the following
image 1

When you add any text after the title tag it clips the x axis. Adding any text after the r code makes it a script tag. Only the last note using > is shown as a note the others are shown as blockquote. See the generated html

Using Flexdashboard 0.2 and knitr 1.13 on MRO 3.2.5

Title link not displaying correctly

The link itself is functional, but I'm seeing Google" /> right below the navbar.


---
title: "`r htmltools::tags$a(href = 'www.google.com', style = 'color: inherit; text-decoration: inherit;', 'Google')`"
output: 
  flexdashboard::flex_dashboard:
    orientation: columns
    vertical_layout: fill

---

I'm using v0.2.1.

scrolling issue with insertUI and flexdashboard

First How can one paste rmarkdown code inside github. the usual ``` are messing with the r code chucks.

With flexboard 0.2.1 (which adding scrolling of containers) using insertUI to insert a module inside a single chuck doesn't add scrolling to the chunk container.
vertical-flow: scroll is meant to scroll a page when multiple chucks are added to the page.

How can i add scrolling to the chuck itself once it's size is increased?
I have posted working code on shiny group.

Application errors only when in mobile width (storyboard)

Hello-

I built an application in order to learn flexdashboard. My app is viewable here.

The app functions normally in a computer browser, but only the first chart is viewable when on mobile, and several errors pop. You can see the behavior by loading the app in a computer browser (it works great), and then lower the page's width until it shifts into mobile mode (everything but the first chart breaks).

I've even included the {.no-mobile} tag on all sections but the first one, and it doesn't seem to matter.

This is my first ever issue submission, please excuse any protocol I may not have followed.

Paul

Create pages hidden from navbar

The flexdashboard package is incredibly useful and already many of the features I would have requested have appeared over the last few weeks. My challenge now is to provide an easy to navigate dashboard that has multiple levels of detail. One way to do this would be to have multiple tabsets on a page, which only really works for me if I can arrange them in a 2x2 layout or something of the sort (already addressed in another issue). Another approach would be to have a side navigation bar that provides links to more detailed pages -- but in this case I'd want those pages not to show up in the navbar menus, as they would clutter things too much (unless there's an additional level of hierarchy available in the menu). If there were a way to create a page that didn't appear in the menu and thus was accessible only by link, that would be helpful.

Inlined script tags never run in runtime:shiny documents

When using runtime:shiny together with flex dashboard, is it possible to call JavaScript functions using the session$sendCustomMessage() system? I tried the following simple code and it seemed to work in a regular rmarkdown doc with Shiny, but when I add the flexdashboard output it doesn't work anymore.

tags$script("Shiny.addCustomMessageHandler('mymsg', function(msg){ alert(msg); })")
textInput("text", "Message", "hello")
actionButton("submit", "Submit")

observeEvent(input$submit, {
  session$sendCustomMessage('mymsg', input$text)
})

I also noticed that the usual "knit" button that changes to "Run document" when using runtime:shiny changes back to "knit" when using dashflexboard.

A great resource

Thank you very much for this wonderful package.

My Rmd code generates two tables which are a little too long for one slide.

I searched in vain for a solution to have the tables properly shown in Slidify without success.

When I brought the code into flexdashboard, the problem was instantly solved as it provides a convenient scrolling layout.

Besides, having the tables available through a set of two tabs is also an elegant solution.

Great work!

value-box: conditional change of color

A classical feature of value-box is a change of color if the value is below or above a threshold. Could this be implemented in flesh_dashboard?

Thanks for your tremendous work!

Erwan

optimize padding for various types of htmlwidget

e.g. leaflet and DT might want zero padding but dygraphs & d3heatmap might want the standard 8px

We might be able to get away with zero padding everywhere. If we can't then we need a way to probe widgets dynamically for their sizingPolicy.

Shiny inputs cause all screens to run on load

If you add any input to a flexdashboard, then lazy loading of screens is broken - run the following and you'll see 'rendering Screen 2' on load. Comment out the selectInput and it goes away.

`---
title: "Test FlexDashboard"
output:
flexdashboard::flex_dashboard:
orientation: columns
horizontal_layout: fill

runtime: shiny

Screen 1

selectInput('a', label = 'A', choices = c('a','b'))
renderText({
  print('rendering Screen 1')
  'Screen 1'
})

Screen 2

renderText({
  print('rendering Screen 2')
  'Screen 2'
})

`

License

Hi,

I've just taken a look at your license, i'm wondering if this is released under any specific license for open source use, or is it not permitted for open use at all.

Cheers

Change default width for small screens

Accordingly with the flexdashboard documentation: "For mobile phones (any screen less than or equal to 768 pixels wide) flexdashboard uses special layout behavior."

I would like to know how I can change the specification e set a small number in order to flexdashboard uses the special layout behavior only os screens with width less than the specified number. For example, it makes differences when one wants to use valueboxes side-by-side in a screen of 750px.

My current solution is to copy the entire var "FlexDashboard" (javascript) and change manually this specification, but the final document has the same functions specified twice. Is there a more ellegant solution?

Thanks for this great package!

Flexdashboard / RColorBrewer / parcoords rendering

The combination of RColorBrewer with parcoords and (new) page leads to a blank parcoords chart - sometimes. It's hard to reproduce because it is so irregular (regular enough to pull your hairs out). If it occurs then the rendered result opens at page 3 instead of page 1. When going to page 1, this is what you see:

selection_005

Test script:


---
title: "Untitled"
output: 
  flexdashboard::flex_dashboard:
    orientation: rows
    vertical_layout: scroll

---

```{r setup, include=FALSE}
# install.packages("pacman")
pacman::p_load_gh("timelyportfolio/parcoords", "jbkunst/highcharter", "rstudio/d3heatmap")
pacman::p_load(ggplot2, RColorBrewer)

Page 1
==========================

Column
-----------------------------------------------------------------------

### Chart A
data( mtcars )
parcoords( mtcars )
Page 2
======================================

Column
-----------------------------------------------------------------------

### Chart B
d3heatmap(mtcars, scale = "column", colors = "Blues")
Page 3
===================================

Column
----------------------------------------------------------------

### Chart C
data(economics, package = "ggplot2")

hc_add_series_times_values(hc = highchart(),
                           dates = economics$date,
                           values = economics$psavert, 
                           name = "Personal Savings Rate")
sessionInfo()
R version 3.2.2 (2015-08-14)
Platform: x86_64-pc-linux-gnu (64-bit)
Running under: Ubuntu 14.04.3 LTS

locale:
[1] LC_CTYPE=en_US.UTF-8       LC_NUMERIC=C               LC_TIME=en_US.UTF-8        LC_COLLATE=en_US.UTF-8     LC_MONETARY=en_US.UTF-8    LC_MESSAGES=en_US.UTF-8    LC_PAPER=en_US.UTF-8    
[8] LC_NAME=C                  LC_ADDRESS=C               LC_TELEPHONE=C             LC_MEASUREMENT=en_US.UTF-8 LC_IDENTIFICATION=C       

attached base packages:
[1] stats     graphics  grDevices utils     datasets  methods   base     

loaded via a namespace (and not attached):
[1] htmltools_0.3.5     tools_3.2.2         flexdashboard_0.1.0 yaml_2.1.13         Rcpp_0.12.4         rmarkdown_0.9.6     jsonlite_0.9.20     digest_0.6.9       

Unable to add vertical scroll on Inputs {.sidebar}

I am designing a Flexdashboard UI with 17 user inputs, most of them are textbox one is a checkbox and an actionbutton. I can only see 10 textbox when I run the script I cannot see the rest and i cannot find any documentation that describes how to add vertical scroll on Input {.sidebar}. Here's my code below.


---
title: "Untitled"
output: 
  flexdashboard::flex_dashboard:
    orientation: columns
    vertical_layout: scroll

---

    ```{r setup, include=FALSE}
     library(flexdashboard)
     ```


  Inputs {.sidebar}
-----------------------------------------------------------------------

  ```{r}
library(shiny)
library(shinyjs)


shinyjs::useShinyjs()
#tags$hr(),
shinyjs::disabled(textInput("id", "Id", "0"))
textInput("X1", "X1", "")
textInput("X2", "X2", "")
textInput("X3", "X3", "")
textInput("X4", "X4", "")
textInput("X5", "X5", "")
textInput("X6", "X6", "")
textInput("X7", "X7", "")
textInput("X8", "X8", "")
textInput("X9", "X9", "")
textInput("X10", "X10", "")
textInput("X11", "X11", "")
textInput("X12", "X12", "")

textInput("X13", "X13", "")
textInput("X14", "X14", "")
textInput("X15", "X15", "")
textInput("X16", "X16", "")

checkboxInput("X17", "X17", FALSE)


#action buttons
actionButton("submit", "Submit Changes")


Narrowing flexdashboard window causes one graph to overwrite all others

If you knit this script and narrow the window horizontally enough, it will cause the final graph to appear over all the others.


---
title: "Testing flexdashboard issues"
output:
 flexdashboard::flex_dashboard

---

```{r, results="asis"}
library(ggplot2)
level1MarkdownHeader <- "\n==================\n"

for(i in 1:3){
  cat("\n\nHeading")
  cat(level1MarkdownHeader)
  for(j in 1:2){
    x <- qplot(y = 1:10, x = rnorm(10), colour = I(colours()[sample(1:655, 1)]))
    print(x)
  }
}

Error in setwd(dir = new) : cannot change working directory

When trying to install flexdashboard I get the following error (have tried on both R-native and R-Studio and it gives the same error):

devtools::install_github("rstudio/flexdashboard")
Downloading GitHub repo rstudio/flexdashboard@master
from URL https://api.github.com/repos/rstudio/flexdashboard/zipball/master
Installing flexdashboard
"C:/PROGRA1/R/R-331.0/bin/x64/R" --no-site-file --no-environ --no-save --no-restore --quiet CMD INSTALL
"C:/Users/Me/AppData/Local/Temp/Rtmp8A47WH/devtools13f0bb4452a/rstudio-flexdashboard-8f0458a"
--library="C:/Users/Me/Documents/R/win-library/3.3" --install-tests
Error in setwd(dir = new) : cannot change working directory

I have updatede to v 3.3.0 but it also had the same error running 3.2.5

version
_
platform x86_64-w64-mingw32
arch x86_64
os mingw32
system x86_64, mingw32
status
major 3
minor 3.0
year 2016
month 05
day 03
svn rev 70573
language R
version.string R version 3.3.0 (2016-05-03)
nickname Supposedly Educational

Hosting or Publishing a Flexdashboard .rmd file

I have a basic test1.rmd file. I am wondering what is the equivalent of

runApp(shinyApp(ui, server), host = "0.0.0.0")

in Flexdashboard ?

When I open this test1.rmd app in a browser the default address in the browser ishttp://mylocal_ip:8021/test1.rmd

Error on running flex dashboard

When I try to run one of the examples from the website, I'm getting the following error:

Error in append(extra_dependencies, list(html_dependency_jquery(), html_dependency_stickytableheaders())) : 
  could not find function "html_dependency_jquery"

Am I missing something?

Fully dynamic control the number of pages, charts

Currently, we define pages and charts beforehand.

But sometime, we need the number pages/charts dynamically, for example when a report for products when each product will be presented in a page and the product list could be changed all the time.

My thought is that i write an script to output a Rmd file and then render that file. Could we do it directly just by using only Rmd file without writing additional script?

Kind regards.

Non-responsive sizing with highcharts and different browsers

I create a dashboard with two highcharts in columns and tabsets. When knitting and looking thru the Rstudio visualizer the charts look okay.

But when taking the html file and opening in a browser (chrome and explorer) the highcharts are not responsive to the new size. The tabs are unresponsive in both Rstudio and chrome.

Here are some pictures to ilustrate (the second tab chart does not recognize size limits).

original r
new r
Is this something that should be added to the highcharts code? Is it a bug or is there a work-around?

cannot disable Mathjax

using mathjax :NULL in yaml doesn't disable mathjax when using shiny runtime.
Also author: Name shows the name next to the title. Is this by design

valueBox not appearing

I'm missing something here

```{r }
renderValueBox({

  records <- data()
  print(records) #31
   valueBox(records, caption = "Records", icon="fa-thumbs-down")
 })

just renders the number 31 as simple text

flexdashaboard fail to load customize js.

I am trying to load my customize javascript code in 10+ way, but I fail to do that.
Here is what I was trying:
{r} HTML("<script src=\"init.js\"></script>") source("init.R") # init.R including some script to load js includeScript('init.js') \

or adding dependencies option in yaml,like this:

dependencies:
script:
- init.js

or writing HTML("<script src="init.js"></script>") directly out of R block.

above all, I couldn't insert my js, I found the problem is flexdashboard convert all this thing into some secret code when I check out the source file by chrome.

Flexdashboard on shiny - not running

Hi,

I have a flexdashboard that works via rmarkdown::run() but not shiny on the same server - the loading spinner shows but times out. After ages it shows 'Error: subscript out of bounds' on the browser doc.
No logs appear in /var/logs/shiny-server or errors to the js console. Nothing else in the directory, and I've tried with an empty newly generated flexdashboard.

Any ideas?

Error when running on Shiny Server

The first time I run the dashboard on Shiny Server, it loaded fine.

After that, I run it again and the browser return an error:

Error: path[1]="/tmp/RtmphD1pY3/widgetbinding6ec63c0b998c": No such file or directory

How could I fixed the issue?

How to compile a flexdashboard html file from R console?

Is it possible to do it?

I tried:

knit("index.Rmd", output = "index.html")

But the output file is not what I expected.

Thank you in advance

Edit:
I figured out that this line is what I needed:

library(rmarkdown)
render("index.Rmd")

Can't scroll down when using DT's renderDataTable

Hello, I have created a very simple app that outputs data using DT::renderDataTable. My app is here:
https://beta.rstudioconnect.com/cullan/freshii/

Problem: For example, if you select "Average prices paid at each store" and Show 25 entries per row, I would not be able to scroll down and view the rest of the table, is there a fix to this?

My code is:


---
title: "fresh"
date: "June 11, 2016"
output: 
  flexdashboard::flex_dashboard
runtime: shiny

---

```{r setup, include=FALSE}
# Load packages here
library(flexdashboard)
library(plyr)
library(dplyr)
library(DT)

getData <- function() {
  df <- read.csv("Fresh_Data.csv")

  # Remove errors
  df <- df[df$Price_Per_Unit != "#DIV/0!",]
  df <- df[complete.cases(df),]
  df <- df[df$Date!="Total",]
  df$Unit <- "OZ"

  # Unfactoring
  df$Amount_in_Pack <- as.numeric(as.character(df$Amount_in_Pack))
  df$Price_Per_Unit <- as.numeric(as.character(df$Price_Per_Unit))
  df$Cases <- as.numeric(as.character(df$Cases))
  df$Price <- as.numeric(as.character(df$Price))
  df$Total_Paid <- as.numeric(as.character(df$Total_Paid))
  df$Date <- (as.Date(df$Date, format = "%m/%d/%Y"))

  return(df)
}

getStores <- function() {
  df <- getData()
  df <- unique(droplevels(df[,"Unit_0me", drop=F]))
  rownames(df) <- NULL
  df <- as.character(df[,1])
  return(df)
}

getProducts <- function() {
  df <- getData()
  df <- unique(droplevels(df[,"Product_0me", drop=F]))
  rownames(df) <- NULL
  df <- as.character(df[,1])
  return(df)
}

# Function to filter by store and summarize by product
bystore <- function (storename, data){
  data <- data %>% filter(Unit_0me == storename) %>% group_by(Product_0me) %>% summarize(averageprice = mean(Price_Per_Unit, na.rm=TRUE),unit = names(which.max(table(Unit))))
  return(data)
}

# Function to filter by product and summarize by date
bydate <- function (productname, data){
  data <- data %>% filter(Product_0me == productname) %>% group_by(Date) %>% summarize(averageprice = mean(Price_Per_Unit, na.rm=TRUE), quantity = sum(Amount_in_Pack), unit = names(which.max(table(Unit))))
   return(data)
}

# Function to filter by product and summarize by store
bystore2 <- function (product, data){
  data <- data %>% filter(Product_0me == product) %>% group_by(Unit_0me) %>% summarize(averageprice = mean(Price_Per_Unit, na.rm=TRUE), quantity = sum(Amount_in_Pack), unit = names(which.max(table(Unit))))
   return(data)
}

# Function to see average prices payed at each store

avgstore <- function (data){
  data <- data %>% group_by(Unit_0me) %>% summarize(averageprice = mean(Price_Per_Unit, na.rm=TRUE), quantity = sum(Amount_in_Pack), unit = names(which.max(table(Unit))))
  return(data)
}

Inputs {.sidebar data-width=300}
-----------------------------------------------------------------------

Below are the inputs you can use to dynamically update the app.

```{r}
selectInput("filterFunction", label="Function:", choices=c("Filter by store / Summarize by product",
                                                     "Filter by product / Summarize by date",
                                                     "Filter by product / Summarize by store",
                                                     "Average prices paid at each store"), 
            selected="Filter by store / Summarize by product")

   conditionalPanel(
      condition = "input.filterFunction == 'Filter by store / Summarize by product'",
      selectInput("store", label="Select store:", choices=getStores(), selected="FRESHII #882 DUBLIN")
   )

   conditionalPanel(
      condition = "input.filterFunction == 'Filter by product / Summarize by store' || 
                   input.filterFunction == 'Filter by product / Summarize by date'",
      selectInput("product", label="Select product :", choices=getProducts(), selected="MANGO")
   )

   conditionalPanel(
      condition = "input.filterFunction == 'Average prices paid at each store'"
   )
Column
----

### Summarized Data

```{r}
dataset <- reactive({
  if(input$filterFunction == "Filter by store / Summarize by product")
    data <- bystore(input$store, getData())
  else if(input$filterFunction == "Filter by product / Summarize by date")
    data <- bydate(input$product, getData())
  else if(input$filterFunction == "Filter by product / Summarize by store")
    data <- bystore2(input$product, getData())
  else if(input$filterFunction == "Average prices paid at each store")
    data <- avgstore(getData())
  return(data)
})

DT::renderDataTable(dataset())

htmlwidgets unreliable

I have a flexdashboard that contains a large number of html widgets - dygraphs, datatables, gauges and d3heatmaps. Whenever I knit the code, the number of html widgets that actually render in the output ranges from all, to less than half (the dygrpahs being the most reliable, and the dashboard gauges the least). This is the same code, with the same data simply run 30 seconds later. Is this because I'm trying to create too many at once (all in its > 100 across 40 pages)? If so is there any plan to make it easier to output multiple html files with a common menu?

corrupting DT:renderDataTable functions

Before installing the flexdashboardpackage I was able to execuate this example from the DT library documentation just fine without any issues,

library(shiny)
shinyApp(
  ui = fluidPage(DT::dataTableOutput('tbl')),
  server = function(input, output) {
    output$tbl = DT::renderDataTable(
      iris, options = list(lengthChange = FALSE)
    )
  }
)

After installing the flexdashboardpackage when i run the same code above the output from the renderDataTable function is corrupted. The datatable does not render accurately and all I see is one line with column names as shown below and I am unable to see the actual contents of the datatable.

test1

Also renderDataTable does not work while producing Flexdashboard apps using RMarkdown.

Some pages disappear when including images

I have a strange bug I think that I can't replicate fully, but perhaps its hitting some kind of hard limit of HTML rendering?

I have the below .Rmd that renders ok if I don't include the rest of the R code, but in the full version (of about 400 lines) then including the images I have left in the debug version removes the last two pages in the top menu bar, which is mysterious :)

Screenshots

Hopefully some explanatory screenshots below - the first shows if I include the images in the full app the top menu pages is only 3 pages

screen shot 2016-05-31 at 14 25 56

When I remove the images, I get all the pages back:

screen shot 2016-05-31 at 14 26 46

Example:

(I can't format the Rmd below as it uses ``` ? but edit this post to view the code as is. )

This example renders fine, which made me think its some kind of limit that is causing the issue. (I'm sorry I can't include the original)

The R blocks include ggplot and plotly graphs to output - could they be conflicting somehow with the layout?

---

title: "Bug content"
output: 
  flexdashboard::flex_dashboard:
    orientation: columns
    vertical_layout: fill
## runtime: shiny

``` r setup, include=FALSE
# Load packages and initialize data here
library(flexdashboard)
library(googleAnalyticsR)
library(shiny)
library(plotly)

```
# Trends {data-icon="fa-line-chart"}
## Column {.sidebar}
### Settings

``` r

## R code

```
## Column {.tabset .tabset-fade}
### Trends

``` r


```

``` r

```
### Animation

``` r, include=FALSE

```

When all the code is in place, including these two lines means the "Funnel" and "Content" pages are removed from top menu.

![](gganimatr2.gif)
![](gganimatr1.gif)
### Something else

Blah
# Campaign Mix {data-icon="fa-line-chart"}
## Column {.sidebar}
### Settings

``` r


```
## Row {data-height=650}
### Multi Channel Mix

``` r

```
## Row {data-height=350}
### Sunburst

``` r


```
### Medium Mix

``` r


```
# Geographic {data-icon="fa-globe"}
## Column {.sidebar}
### Settings

``` r


```
## Column
### Table

``` r


```
## Column
### Globe

Click and Zoom with mouse

``` r


```
### Map

``` r


```
# Funnel {data-icon="fa-filter"}

This page is removed from menu bar when the images above are included(??)
## Column {.sidebar}
### Settings

``` r


```
## Row {.tabset .tabset-fade}
### All Goals

``` r


```
### Goal 1

``` r


```
### Goal 2

``` r


```
### Goal 3

``` r


```
# Content {data-icon="fa-book"}

This page is removed from menu bar when the images above are included(??)
## Column {.sidebar}
### Settings

``` r


```
## Column
### Plot

``` r


```
### Funnel

``` r


```

Unable to render a gvis object

Hello,

Thank you much for putting together this great package! I'm having some issues with rendering gvis objects in flexdashbaord. Here's a minimal example:


title: "Sample"
output:
flexdashboard::flex_dashboard:
orientation: columns

vertical_layout: fill

library(flexdashboard)
library(googleVis)
library(dplyr)

df <- iris %>% group_by(Species) %>% mutate(meanSLength = mean(Sepal.Length))

Column {data-width=650}

Sample column chart in googleVis

renderGvis(

  gvisBarChart(df, "Species", "meanSLength")

)

Above renderGvis I do specify results='asis', message=FALSE, echo=FALSE. Still, I get the following back:

screen shot 2016-05-21 at 10 46 16 pm

This happens in both the RStudio preview window and the browser.

Any help would be much appreciated!

Thanks!

Scrolling

If I have a large amount of graphs in one column it stacks them and tries to squeeze them into one window (cannot scroll down). This makes them impossible to read. It would be nice to be able to scroll down and keep the charts the original size.

Generate more than one html when more than one page

For a bigger project (more than 10 pages with heavy content and many plots) it would help when RStudio would knit more than one html output file. So that the navbar would display the page names and reference the corresponding html files (like). Now multipages only references into the html file (see). The loading times for one big html file are very high. Any hints to address this problem?

flexdashboard not rendering reactive data object via DT::renderDataTable

This problem is specific to flexdashboard.

I have developed some shiny UI in which a reactive data object is used as the data argument inside of renderDataTable function. This works fine in a Shiny environment, however if I try this UI within Flexdashboard, I cannot see the contents of my data object. If I switch from DT::renderDataTable to just DT::DataTable everything works fine. So this is making me think that there is some issue with Flexdashboard trying to render reactive data objects. Here's a minimal reproducible example

           ```
            ---
           title: "Flex Dashboard"
           output: 
           flexdashboard::flex_dashboard:
           orientation: columns
          vertical_layout: fill
          runtime: shiny
         ---

        ```{r setup, include=FALSE}
           library(rmarkdown); library(knitr); library(DT)
        ```

      ```{r}
              DT::renderDataTable({iris},
              options = list(
              pageLength = 5,
              initComplete = I("function(settings, json) {alert('Done.');}")
            )
       )
      ```

**Output : Empty**,  now replacing `DT::renderDataTable` with `DT::DataTable` 


      ```
      ---
      title: "Flex Dashboard"
      output: 
      flexdashboard::flex_dashboard:
      orientation: columns
      vertical_layout: fill
      runtime: shiny
      ---

      ```{r setup, include=FALSE}
        library(rmarkdown); library(knitr); library(DT)
      ```

      ```{r}
                 DT::datatable(iris,
                 options = list(
                  pageLength = 5,
                  initComplete = I("function(settings, json) {alert('Done.');}")
                )
             )
     ```

test1

Recommend Projects

  • React photo React

    A declarative, efficient, and flexible JavaScript library for building user interfaces.

  • Vue.js photo Vue.js

    🖖 Vue.js is a progressive, incrementally-adoptable JavaScript framework for building UI on the web.

  • Typescript photo Typescript

    TypeScript is a superset of JavaScript that compiles to clean JavaScript output.

  • TensorFlow photo TensorFlow

    An Open Source Machine Learning Framework for Everyone

  • Django photo Django

    The Web framework for perfectionists with deadlines.

  • D3 photo D3

    Bring data to life with SVG, Canvas and HTML. 📊📈🎉

Recommend Topics

  • javascript

    JavaScript (JS) is a lightweight interpreted programming language with first-class functions.

  • web

    Some thing interesting about web. New door for the world.

  • server

    A server is a program made to process requests and deliver data to clients.

  • Machine learning

    Machine learning is a way of modeling and interpreting data that allows a piece of software to respond intelligently.

  • Game

    Some thing interesting about game, make everyone happy.

Recommend Org

  • Facebook photo Facebook

    We are working to build community through open source technology. NB: members must have two-factor auth.

  • Microsoft photo Microsoft

    Open source projects and samples from Microsoft.

  • Google photo Google

    Google ❤️ Open Source for everyone.

  • D3 photo D3

    Data-Driven Documents codes.