Git Product home page Git Product logo

recharts.org's Introduction

Recharts

storybook Build Status codecov npm version npm downloads MIT License

Introduction

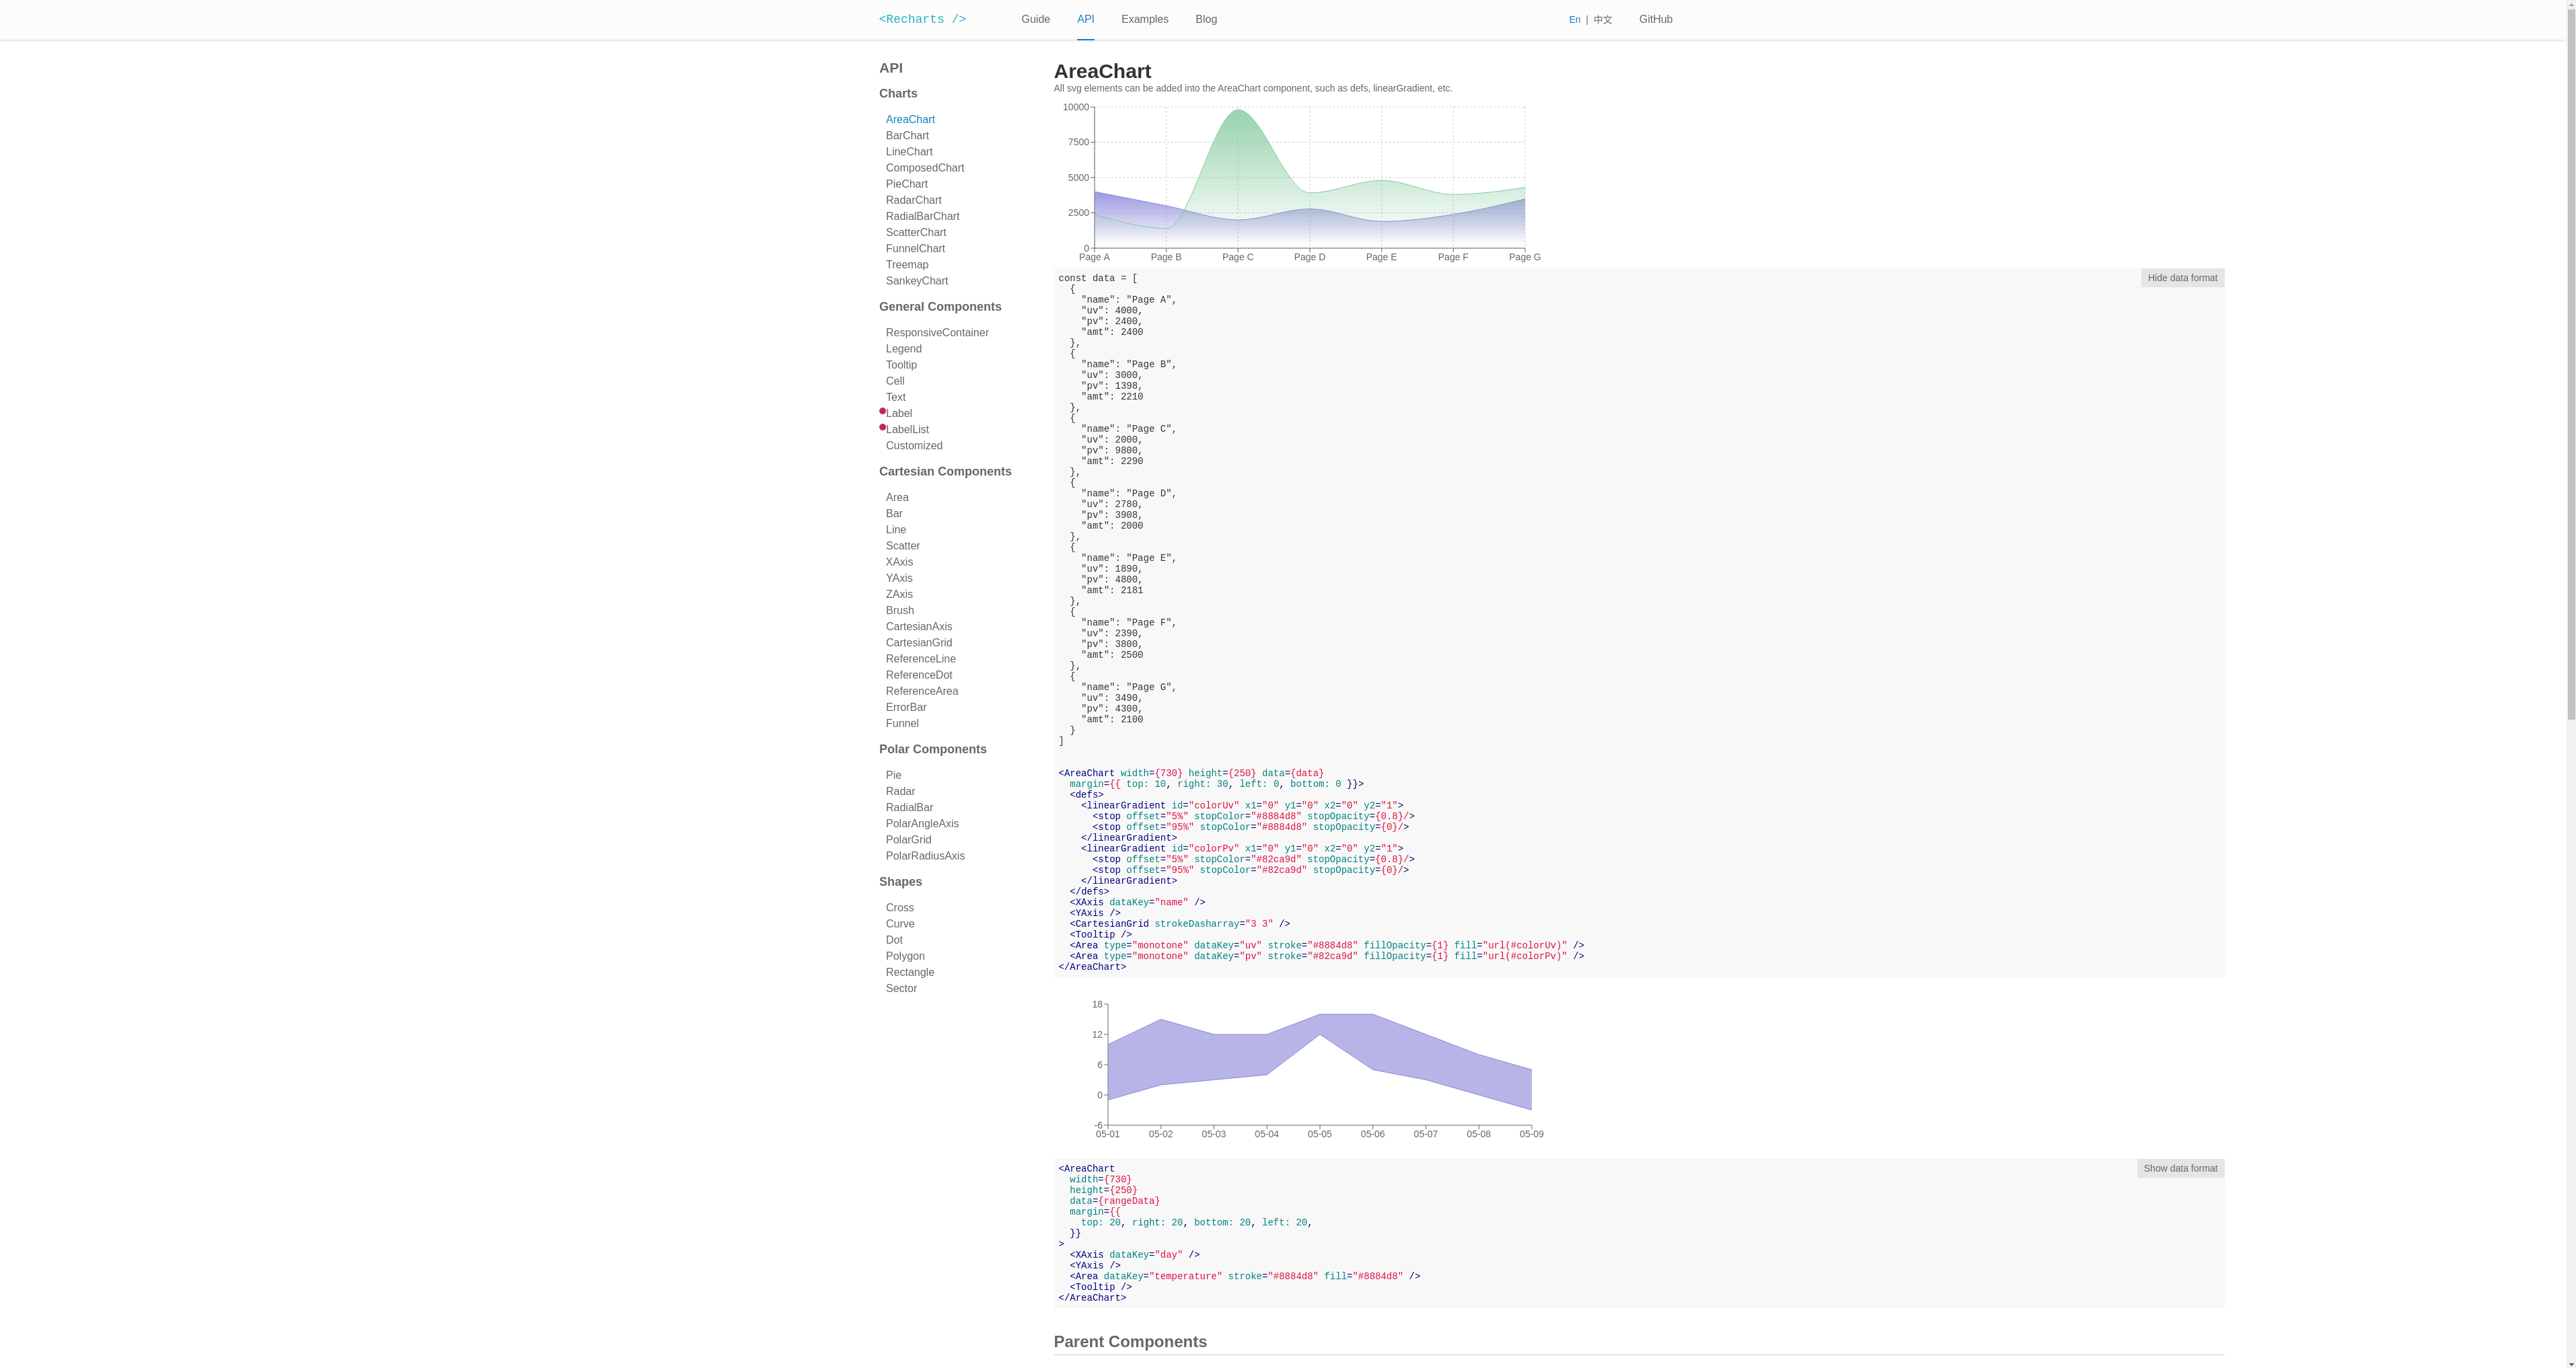
Recharts is a Redefined chart library built with React and D3.

The main purpose of this library is to help you to write charts in React applications without any pain. Main principles of Recharts are:

  1. Simply deploy with React components.
  2. Native SVG support, lightweight depending only on some D3 submodules.
  3. Declarative components, components of charts are purely presentational.

Documentation at recharts.org and our storybook (WIP)

Please see the wiki for FAQ.

All development is done on the master branch. The current latest release and storybook documentation reflects what is on the release branch.

Examples

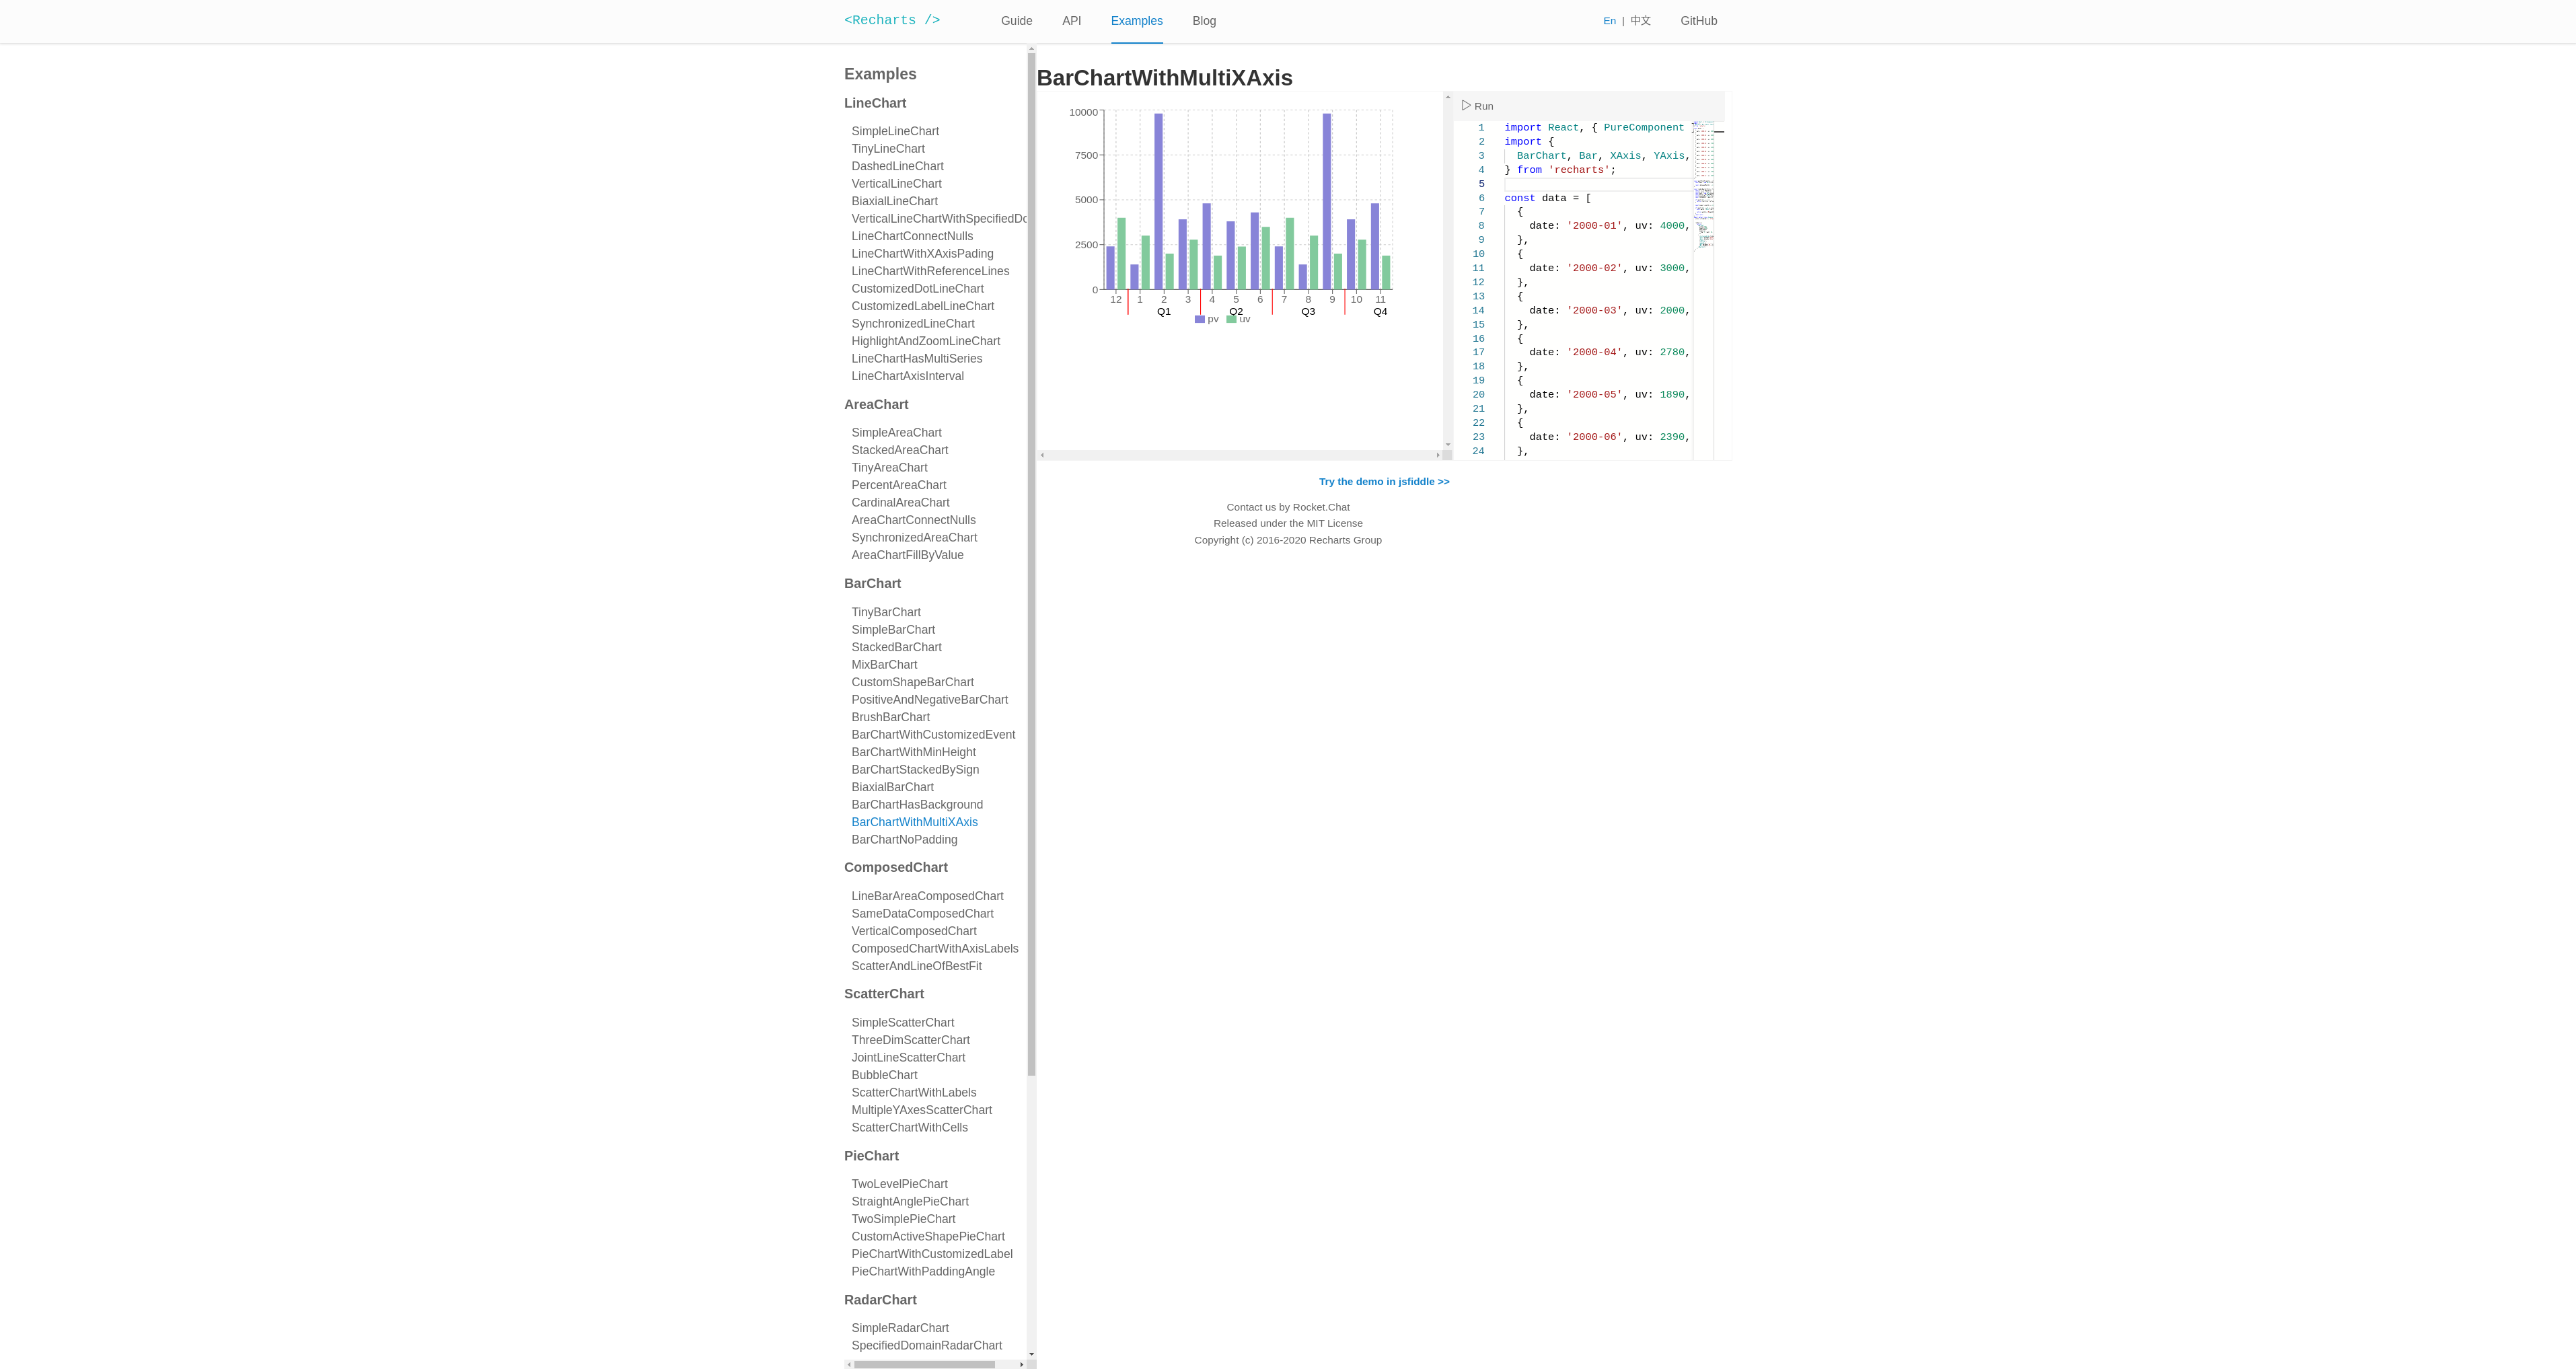
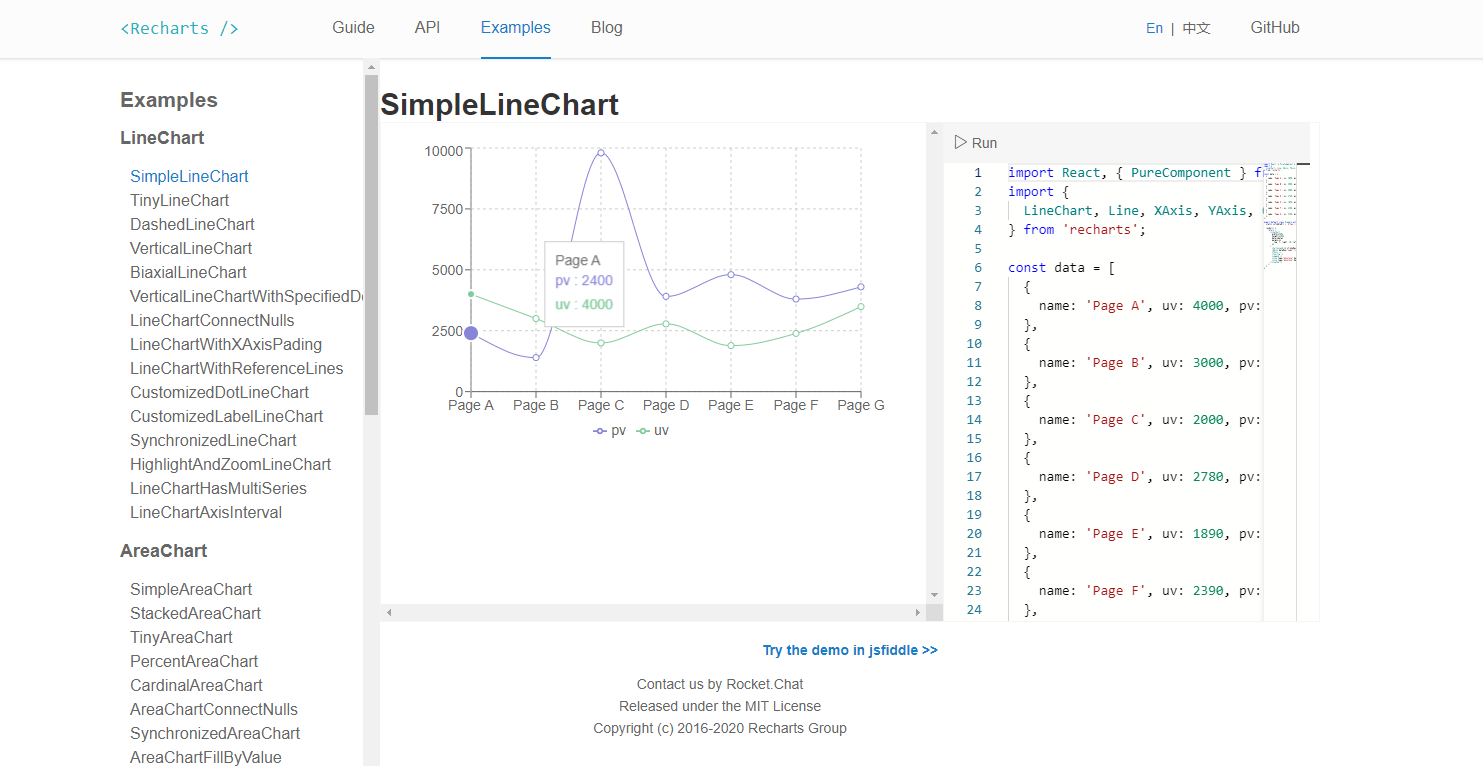
<LineChart width={400} height={400} data={data} margin={{ top: 5, right: 20, left: 10, bottom: 5 }}>
  <XAxis dataKey="name" />
  <Tooltip />
  <CartesianGrid stroke="#f5f5f5" />
  <Line type="monotone" dataKey="uv" stroke="#ff7300" yAxisId={0} />
  <Line type="monotone" dataKey="pv" stroke="#387908" yAxisId={1} />
</LineChart>

All the components of Recharts are clearly separated. The lineChart is composed of x axis, tooltip, grid, and line items, and each of them is an independent React Component. The clear separation and composition of components is one of the principle Recharts follows.

Installation

npm

NPM is the easiest and fastest way to get started using Recharts. It is also the recommended installation method when building single-page applications (SPAs). It pairs nicely with a CommonJS module bundler such as Webpack.

# latest stable
$ npm install recharts

umd

The UMD build is also available on unpkg.com:

<script src="https://unpkg.com/react/umd/react.production.min.js"></script>
<script src="https://unpkg.com/react-dom/umd/react-dom.production.min.js"></script>
<script src="https://unpkg.com/recharts/umd/Recharts.min.js"></script>

Then you can find the library on window.Recharts.

dev build

$ git clone https://github.com/recharts/recharts.git
$ cd recharts
$ npm install
$ npm run build

Demo

To examine the demos in your local build, execute:

$ npm run[-script] demo

and then browse to http://localhost:3000.

Storybook

We are in the process of unifying documentation and examples in storybook. To run it locally, execute

$ npm run[-script] storybook

and then browse to http://localhost:6006.

Releases

Releases are automated via GH Actions - when a new release is created in GH, CI will trigger that:

  1. Runs a build
  2. Runs tests
  3. Runs npm publish

Version increments and tagging are not automated at this time.

Release testing

Until we can automate more, it should be preferred to test as close to the results of npm publish as we possibly can. This ensures we don't publish unintended breaking changes. One way to do that is using yalc - npm i -g yalc.

  1. Make your changes in recharts
  2. yalc publish in recharts
  3. yalc add recharts in your test package (ex: in a vite or webpack reach app with recharts installed, imported, and your recent changes used)
  4. npm install
  5. Test a local run, a build, etc.

Module Formats

  • babel-plugin-recharts A simple transform to cherry-pick Recharts modules so you don’t have to. Note: this plugin is out of date and may not work with 2.x

Thanks

Chromatic

Thanks to Chromatic for providing the visual testing platform that helps us review UI changes and catch visual regressions.

License

MIT

Copyright (c) 2015-2024 Recharts Group.

recharts.org's People

Contributors

adrianmcli avatar arcthur avatar bcongdon avatar birimbau avatar brousalis avatar charpeni avatar christianrank avatar ckifer avatar dependabot[bot] avatar evilucifero avatar fanny avatar fullchee avatar gaurav5430 avatar hueitan avatar ianvs avatar jacktasia avatar jashanbhullar avatar jayseeg avatar jochenberger avatar lukask-proxora avatar mthmulders avatar nowke avatar petetnt avatar simek avatar thepianodentist avatar tommilligan-plutoflume avatar tongyy avatar xile611 avatar yilun-sun avatar zimonitrome avatar

Stargazers

 avatar  avatar  avatar  avatar  avatar  avatar  avatar  avatar  avatar  avatar  avatar  avatar  avatar  avatar  avatar  avatar  avatar  avatar  avatar  avatar  avatar  avatar  avatar  avatar  avatar  avatar  avatar  avatar  avatar  avatar  avatar  avatar  avatar  avatar  avatar  avatar  avatar  avatar

Watchers

 avatar  avatar  avatar  avatar  avatar  avatar  avatar  avatar  avatar

recharts.org's Issues

strokeWidth for Area

Add documentation for strokeWidth for the Area. Something like this would work:


strokeWidth Number optional

The width of the stroke for the plot lines in pixels. The higher the number, the thicker the line.

DEFAULT: false
FORMAT:

<Area strokeWidth={1} />
<Area strokeWidth={2} />
<Area strokeWidth={5.3} />

Sidebar scroll bug in Firefox

I'm using Firefox 62.0.3 and I can't scroll to the bottom of sidebar on the API and Examples pages.

Example 1
screenshot_2018-10-05 polarangleaxis recharts

Example 2
screenshot_2018-10-05 arearesponsivecontainer recharts

Code windows in "Examples" section are too small.

The window that displays example code has a maximum size of 30 characters wide by 24 lines tall. This is very small, and too small to be very useful for anyone looking at the longer examples without having to copy and paste the code to an external text editor.

Screenshot of code window from "Examples" section:
Selection_2020053016:29:42

Using Chrome 81 on Ubuntu 18.04 on a 4K monitor with the default zoom level, the code window only was only capable of using about 1.33% of the total area inside the browser viewport.

One possible remedy would be to display the code under the example window, similar to the API example code windows (as shown below).

Screenshot of code window from "API" section for comparison:
Selection_2020053017:00:58

Provide complete examples

The examples in the documentation guide and API don't tell the user what exactly the data should look like, and it doesn't even correspond between the data parameter description, and the JSX markup provided.

The "Getting Started" guide has the following code:

import { LineChart, Line } from 'recharts';

<LineChart width={400} height={400} data={data}>
  <Line type="monotone" dataKey="uv" stroke="#8884d8" />
</LineChart>

Without saying what data should look like.

And the BarCharts example in the API has the following code:

<BarChart width={730} height={250} data={data}>
  <XAxis dataKey="name" />
  <YAxis />
  <CartesianGrid strokeDasharray="3 3" />
  <Tooltip />
  <Legend />
  <Bar dataKey="pv" fill="#8884d8" />
  <Bar dataKey="uv" fill="#82ca9d" />
</BarChart>

Where the description for the data parameter is missing any mention of pv or uv:

dataArray
The source data, in which each element is an object.
FORMAT:
[{ name: 'a', value: 12 }]
[{ name: 'a', value: [5, 12] }]

The examples should correspond to the parameter description, and the data variable should be provided in every example.

Make Code Examples Responsive

When navigating to any of the code examples, the code section is cut off and you have to use sideways scroll bars. Although there is plenty of real-estate to expand out into on my 1920x1080 monitor. It would be nice to have the code examples responsive.

image

http://recharts.org/en-US/api/Customized blank page: `Cannot read property 'desc' of undefined`

navigating to http://recharts.org/en-US/api/Customized yeilds:

Screenshot_20191002_142730

a blank white page with the following errors:

backend.js:6 TypeError: Cannot read property 'desc' of undefined
    at i.value (APIView.js:232)
    at lo (react-dom.production.min.js:163)
    at so (react-dom.production.min.js:162)
    at ho (react-dom.production.min.js:169)
    at Qo (react-dom.production.min.js:204)
    at Ko (react-dom.production.min.js:205)
    at ka (react-dom.production.min.js:220)
    at Da (react-dom.production.min.js:219)
    at Fa (react-dom.production.min.js:231)
    at En (react-dom.production.min.js:85)
r @ backend.js:6
_o @ react-dom.production.min.js:179
Lo.n.callback @ react-dom.production.min.js:190
di @ react-dom.production.min.js:128
ci @ react-dom.production.min.js:128
ja @ react-dom.production.min.js:229
ka @ react-dom.production.min.js:220
Da @ react-dom.production.min.js:219
Fa @ react-dom.production.min.js:231
En @ react-dom.production.min.js:85
APIView.js:232 Uncaught TypeError: Cannot read property 'desc' of undefined
    at i.value (APIView.js:232)
    at lo (react-dom.production.min.js:163)
    at so (react-dom.production.min.js:162)
    at ho (react-dom.production.min.js:169)
    at Qo (react-dom.production.min.js:204)
    at Ko (react-dom.production.min.js:205)
    at ka (react-dom.production.min.js:220)
    at Da (react-dom.production.min.js:219)
    at Fa (react-dom.production.min.js:231)
    at En (react-dom.production.min.js:85)

[Suggestion] Add strokeWidth properties for Line

Hi, I used this Library for the website and then,
I really appreciate that there are many properties for each component πŸ‘

But, When I used the Line component and I wanted to change the width of lines,
there is no explanation. So, I had to confirm the source code.

It is troublesome, I think it is better to add this explanation like the following.
(Maybe, many people want to change the default width of the line !!)


strokeWidth : Number optional

The width of the stroke for the plot lines in pixels. The higher the number, the thicker the line.

DEFAULT: 1
FORMAT:

<Line strokeWidth={1} />
<Line strokeWidth={2} />
<Line strokeWidth={5.3} />

I tried to submit the PR by adding this explanation, but I can't write the chinese.
https://github.com/recharts/recharts.org/blob/master/src/docs/api/Line.js
So, I gave up submitting this PR πŸ™‡ .

ReferenceArea documentation does not mention shape prop

ReferenceArea allows easy replacement of Rectangle inside using shape prop. Unfortunately we only discovered this after two days of coding when we checked the source πŸ˜…

I'd send a pull request but unfortunately I don't know Chinese :(

jsfiddle does not support React 15+

The examples hosted on jsfiddle have seen compiler problems, e.g.:

recharts/recharts#2375

Also, it may be worthwhile to move all the code examples into a source repo belonging to recharts, in case those code boxes go offline. I recommend not using storybook, but rather whatever tool can do this as simply as possible.

Treemap JSFiddle examples use 'ratio' prop

I copied some code from your JSFiddle example (I'm using typescript). Typescript complains about the ratio prop. Although it works on JSFiddle, the prop documented in the API is aspectRatio not ratio.

Typescript would not compile until I updated my example code to use aspectRatio.

JSFiddle examples:
https://jsfiddle.net/alidingling/u702a3Lx/ (Simple)
https://jsfiddle.net/alidingling/Ldvvz2ak/ (Customised content)

Treemap API:
http://recharts.org/en-US/api/Treemap#aspectRatio

[Documentation] strokeDasharray is wrong in Line documentation

The strokeDasharray prop in the [https://github.com/recharts/recharts.org/blob/master/src/docs/api/Line.js#L359](Line component documentation) is incorrect. It's listed as strokeDashArray but the actual prop appears to be strokeDashArray.

Expected
The documentation should match the actual prop

Actual
The casing of the prop in the documentation does not match the casing of the prop in the source code

Bar label does not support position property anymore.

recharts: 2.0.4

http://recharts.org/en-US/api/Bar#label

No overload matches this call.
  Overload 1 of 2, '(props: Props | Readonly<Props>): Bar', gave the following error.
    Type '{ position: string; }' is not assignable to type 'boolean | ReactElement<SVGElement, string | ((props: any) => ReactElement<any, string | ... | (new (props: any) => Component<any, any, any>)>) | (new (props: any) => Component<...>)> | ((props: any) => SVGElement) | { ...; }'.
      Object literal may only specify known properties, and 'position' does not exist in type 'ReactElement<SVGElement, string | ((props: any) => ReactElement<any, string | ... | (new (props: any) => Component<any, any, any>)>) | (new (props: any) => Component<...>)> | ((props: any) => SVGElement) | { ...; }'.
  Overload 2 of 2, '(props: Props, context: any): Bar', gave the following error.
    Type '{ position: string; }' is not assignable to type 'boolean | ReactElement<SVGElement, string | ((props: any) => ReactElement<any, string | ... | (new (props: any) => Component<any, any, any>)>) | (new (props: any) => Component<...>)> | ((props: any) => SVGElement) | { ...; }'.
      Object literal may only specify known properties, and 'position' does not exist in type 'ReactElement<SVGElement, string | ((props: any) => ReactElement<any, string | ... | (new (props: any) => Component<any, any, any>)>) | (new (props: any) => Component<...>)> | ((props: any) => SVGElement) | { ...; }'.  TS2769

    28 |           <BarChart data={data} margin={{ top: 20, bottom: 5 }}>
    29 |             <XAxis dataKey="name" />
  > 30 |             <Bar dataKey="value" fill="#8884d8" label={{ position: 'top' }}>
       |                                                          ^
    31 |               {data.map((entry, index) => (
    32 |                 <Cell key={`cell-${index}`} fill={entry.color} />
    33 |               ))}

http://recharts.org/en-US/examples/CustomShapeBarChart

has the following example:

<Bar dataKey="female" fill="#8884d8" shape={<TriangleBar />} label={{ position: 'top' }}>

Minor typo in English string for Line.js docs

First off, thank you for producing a really nice charting library for React!

I think a minor change that could make the English documentation a little better is some rewording in Line.js.

The English string for the Line.js docs is currently: 'en-US': 'The dot is shown when muser enter a line chart and this chart has tooltip. If false set, no active dot will not be drawn. If true set, active dot will be drawn which have the props calculated internally. If object set, active dot will be drawn which have the props mergered by the internal calculated props and the option. If ReactElement set, the option can be the custom active dot element.If set a function, the function will be called to render customized active dot.'.

This contains some minor typos and I'd like to propose rewording it to:
'en-US': 'The active dot is shown when a user enters a line chart and this chart has tooltip. If set to false, no active dot will be drawn. If set to true, active dot will be drawn with the props calculated internally. If passed an object, active dot will be drawn, and the internally calculated props will be merged with the key value pairs of the passed object. If passed a ReactElement, the option can be the custom active dot element. If passed a function, the function will be called to render a customized active dot.'

I can submit a pull request which will also include this change. Thank you!

Build issues with current website

I found some bugs:

Site is down

Nothing is being rendered into <div id="app"></div>

Website not available

Failed to load resource: the server responded with a status of 404 (Not Found) app.js:1

One of the image return 404

Last image for companies that use rechars returns 404. It's not a good idea to use images generated by GitHub to cache the results.

color and formatter are undocumented in tooltip payload

The color and formatter props are undocumented in the tooltip payload section. These props are very useful when creating a custom tooltip and should be documented.

I've been having a lengthy discussion with the definitely typed team about adding these attributes. They understandably are hesitant to add undocumented types. Since the underlying code base makes use of these types, and they are useful when creating a custom tooltip, they should be documented.

See the PR on definitely typed here
I also opened an issue on the recharts main repo here

I have opened PR #47 to correct this

Area component misses documentation in dataKey property as a function

What problem does this feature solve?
At the moment the Area component has the dataKey property which can be a number, a string or an functions. However in the documentation (https://recharts.org/en-US/api/Area#dataKey) it just refers number or string.
This should be fixed in order to avoid confusion and unnecessary searches online (Until the user finds this #383)

What does the proposed API look like?
Documentation should be added in order to inform the user of the API that this property also accepts functions.

Volunteer for documentation update

Hi, I would like to help with updating the documentation and the examples. I have been experimenting with this library and feel that it can gain a lot more usage and contribution if documentation and examples are maintained. Can you help me get started? I have opened a few issues/PRs already but there seems to be no activity in this repo.

Bugs with Example "HighlightAndZoomLineChart"

  • I have searched the issues of this repository and believe that this is not a duplicate.

Reproduction link

http://recharts.org/en-US/examples/HighlightAndZoomLineChart * Fixed the URL, had the wrong one to start with

Steps to reproduce

Click "Run", or open the JSFiddle page.

What is expected?

When you click and drag on the graph, it will zoom.

What is actually happening?

The zoom works when the first page is loaded, but when you click "Run" it breaks (might indicate that the code that's initially loaded isn't the same as the code in the pane on the right?). Also, the JSFiddle version doesn't work at all.

Environment Info
Recharts v2.0.0-beta.1
React 15.6.2 (the version on your website)
System macOS
Browser Firefox

The code in the JSFiddle and the example page is different

Stable version

Currently recharts is in version - v1.0.0-beta.10
Can you please let us know when will we have the stable version released?

Recommend Projects

  • React photo React

    A declarative, efficient, and flexible JavaScript library for building user interfaces.

  • Vue.js photo Vue.js

    πŸ–– Vue.js is a progressive, incrementally-adoptable JavaScript framework for building UI on the web.

  • Typescript photo Typescript

    TypeScript is a superset of JavaScript that compiles to clean JavaScript output.

  • TensorFlow photo TensorFlow

    An Open Source Machine Learning Framework for Everyone

  • Django photo Django

    The Web framework for perfectionists with deadlines.

  • D3 photo D3

    Bring data to life with SVG, Canvas and HTML. πŸ“ŠπŸ“ˆπŸŽ‰

Recommend Topics

  • javascript

    JavaScript (JS) is a lightweight interpreted programming language with first-class functions.

  • web

    Some thing interesting about web. New door for the world.

  • server

    A server is a program made to process requests and deliver data to clients.

  • Machine learning

    Machine learning is a way of modeling and interpreting data that allows a piece of software to respond intelligently.

  • Game

    Some thing interesting about game, make everyone happy.

Recommend Org

  • Facebook photo Facebook

    We are working to build community through open source technology. NB: members must have two-factor auth.

  • Microsoft photo Microsoft

    Open source projects and samples from Microsoft.

  • Google photo Google

    Google ❀️ Open Source for everyone.

  • D3 photo D3

    Data-Driven Documents codes.