randyzwitch / echarts.jl Goto Github PK
View Code? Open in Web Editor NEWJulia package for the Apache ECharts v4 visualization library
Home Page: https://randyzwitch.com/ECharts.jl/
License: Other
Julia package for the Apache ECharts v4 visualization library
Home Page: https://randyzwitch.com/ECharts.jl/
License: Other
![dependabot[bot] avatar](https://avatars.githubusercontent.com/in/29110?v=4 "dependabot[bot]")
![femtocleaner[bot] avatar](https://avatars.githubusercontent.com/in/4123?v=4 "femtocleaner[bot]")


80% on codecov isn't bad, but it'd be great to have higher coverage.
theme and its usesClean up DataZoom toolbox type, others
I followed the WebIO installation instructions and the following commands still do not work.
using ECharts
x = ["Monday","Tuesday","Wednesday","Thursday","Friday","Saturday","Sunday"]
y = [11, 11, 15, 13, 12, 13, 10]
b = bar(x, y)
Color, rounding, etc.
I am using jupyter lab now since it seems to be working very well and is the anticipated next gen jupyter as far as i can tell. However, I don't get the output using that. apparently One has do enable javascript somehow through extentions or I guess it can be built in the package? not sure.
Have you had a look at this? I know plotlyjs.jl has similar issues
See if this is reasonably possible, since the types are all basically used in the same way
Add assertions for arrays having same dimensions, other necessities not covered through method signatures
Instead of having all different data structures, move to common Dataset structure for simplicity. Reuse JSON.json(x::DataFrame) as much as possible to avoid writing custom parsers
Completed:
To do:
I am having trouble following the documentation for the Sankey diagram. I have previously used an online tool to construct these diagrams, but I am unsure how to translate that to here.
For example, the following "code"
Application [1] Other
Application [3] Declined
Application [2] No Response
Application [1] Interview
Interview [1] Unsuccessful
Interview [0] Successful
Produces this outcome:
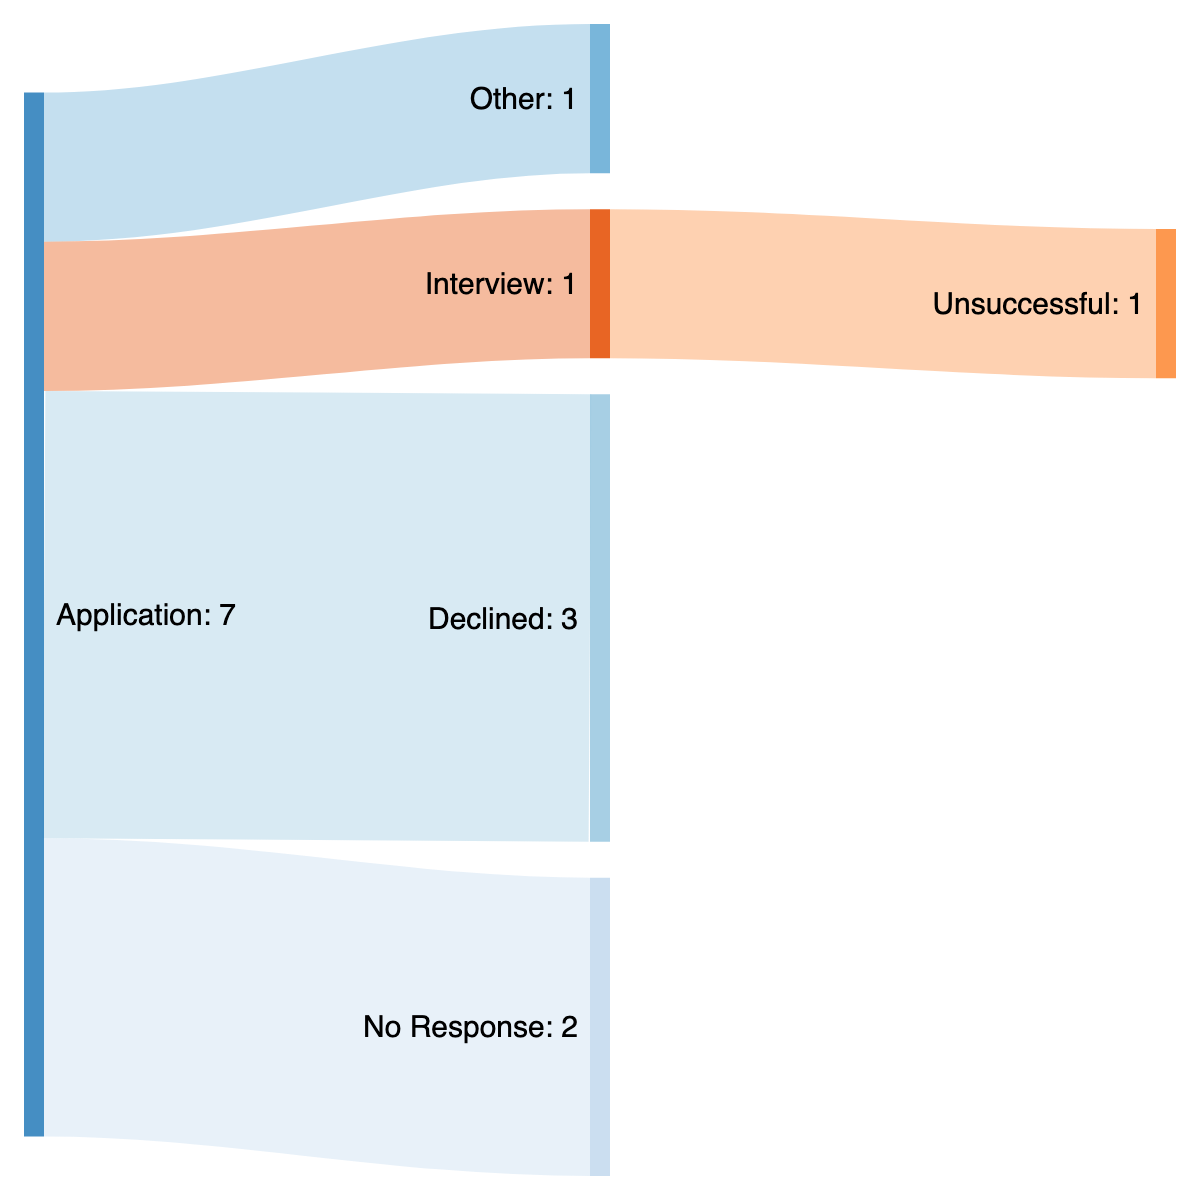
Can you help me translate this into Julia? Sorry about the question, by the way. And thank you for making this package.
Add methods for writing JSON to file, writing whole HTML page, GIF/PNG, etc.
Wrap StatsBase functions, to make calling histogram work without having to call fit()
I tried to add it to Julia in Atom, but get the following message:
Pkg.add("ECharts")
ERROR: resolve is unable to satisfy package requirements.
The problem was detected when trying to find a feasible version
for package Graphs.
However, this only means that package Graphs is involved in an
unsatisfiable or difficult dependency relation, and the root of
the problem may be elsewhere.
As of today, need JuliaWeb/Mux.jl#86 and JuliaWeb/WebSockets.jl#145 for ECharts to pop up a Blink window
box brittle with outliers, i.e. box logic hard coded into flip!

on ECharts.jl v0.4.0 and Windows 10
Pick a default like 2 or 3 decimals, to avoid massive floating point being displayed
One of the downsides of the JSFunction type is that it deviates from JSON standard. Thus, the code works if you splat it into an HTML page, but you can't read the JSON from an endpoint.
Factor out the usage as much as possible, so that external JSON files can be read.
lineargradient and radialgradient as Dict or typesWhile using ECharts throws Error as follows:
julia> using ECharts
[ Info: Precompiling ECharts [top-level]
ERROR: LoadError: ArgumentError: Package FixedPointNumbers [53c48c17-4a7d-5ca2-90c5-79b7896eea93] is required but does not seem to be installed:
Pkg.instantiate() to install all recorded dependencies.Environment:
CentOS7.4 64bit
Julia Version:
julia-1.1.0
Dependend Packages Installed:
FixedPointNumbers
Colors
NoveltyColors
ColorBrewer
Parameters
OrderedCollections
JSON
samplinglargeRDatasets only used for testing, but is causing Travis to fail because of unrelated RDatasets issues. Remove dependency to avoid future issues, make package more lightweight
Clean up DataZoom slider type, figure out DataZoom inside type, etc.
With #54 making tooltips default, make sure settings for tooltip actually work/make sense for each chart type
@sdmcallister review for accessibility (screen reader compatibility.
Simplify method signatures as possible to remove enumerating every type instead of using Real
Hi! First of all, thanks for this package! I've just noticed that the last ECharts version is 5.2.0; maybe it could be great to update it on this package. Best regards!
Make a function/macro to parse a JSON specification directly into an ECharts object, so that plotting can occur from copying examples
defaulttheme functionnewtheme function to inherit from existing themeLook at corrplot in R, evaluate what features would be useful (sort, removing 1.00 from diagonal, etc.)
Missing value treatment could depend on decisions made JuliaStats/StatsBase.jl#343
Add docstrings for inline documentation
I am getting errors running corplot example. Due to DataFrames.jl using df[!,:colname] syntax instead of df[:colname]
└ @ ECharts C:\Users\RTX2080\.julia\packages\ECharts\jt1U8\src\plots\corrplot.jl:57
┌ Warning: `getindex(df::DataFrame, col_ind::ColumnIndex)` is deprecated, use `df[!, col_ind]` instead.
│   caller = #corrplot#355(::Int64, ::String, ::Bool, ::Int64, ::Int64, ::Base.Iterators.Pairs{Union{},Union{},Tuple{},NamedTuple{(),Tuple{}}}, ::typeof(corrplot), ::Array{Float64,2}) at corrplot.jl:58
└ @ ECharts C:\Users\RTX2080\.julia\packages\ECharts\jt1U8\src\plots\corrplot.jl:58
┌ Warning: `setindex!(df::DataFrame, v::AbstractVector, col_ind::ColumnIndex)` is deprecated, use `begin
│     df[!, col_ind] = v
│     df
│ end` instead.
│   caller = #corrplot#355(::Int64, ::String, ::Bool, ::Int64, ::Int64, ::Base.Iterators.Pairs{Union{},Union{},Tuple{},NamedTuple{(),Tuple{}}}, ::typeof(corrplot), ::Array{Float64,2}) at corrplot.jl:58
└ @ ECharts C:\Users\RTX2080\.julia\packages\ECharts\jt1U8\src\plots\corrplot.jl:58
┌ Warning: `getindex(df::DataFrame, col_ind::ColumnIndex)` is deprecated, use `df[!, col_ind]` instead.
│   caller = #corrplot#355(::Int64, ::String, ::Bool, ::Int64, ::Int64, ::Base.Iterators.Pairs{Union{},Union{},Tuple{},NamedTuple{(),Tuple{}}}, ::typeof(corrplot), ::Array{Float64,2}) at corrplot.jl:67
└ @ ECharts C:\Users\RTX2080\.julia\packages\ECharts\jt1U8\src\plots\corrplot.jl:67
Add drop shadows for 3D effect
Use Blink, pop up HTML page?
ECharts 4 is backwards compatible, but update types and charts to newest spec
When I try a simple example with Julia 1.5 beta1.0, ECharts hangs.
Add in to ECharts type (or global?), then pass value:
var chart = echarts.init(containerDom, null, {renderer: 'canvas'});
var chart = echarts.init(containerDom, null, {renderer: 'svg'});
There are three known security vulnerabilities in JavaScript dependencies specified in this repository:
docs/Gemfile.lock specifies ffi version 1.9.21. There is a known vulnerability in this version: CVE-2018-1000201. The recommendation is to upgrade to ffi version 1.9.24.
docs/Gemfile.lock specifies rubyzip version 1.2.1. There is a known vulnerability in this version: CVE-2018-1000544. The recommendation is to upgrade to rubyzip version 1.2.2.
docs/Gemfile.lock specifies jekyll version 3.6.2. There is a known vulnerability in this version: CVE-2018-17567. The recommendation is to upgrade to jekyll version 3.6.3.
Can we update Gemfile.lock to specify appropriately recent versions of these dependencies?
cc: @randyzwitch
The default is to sort, but some cool effects can happen if you don't. Add keyword to methods for funnel, with the default as sorted.
Thinking about creating a global for settings such as size, theme, display type, etc.
Related to #69? Updated packages for ECharts 0.4, Jupyter doesn't work
This issue is used to trigger TagBot; feel free to unsubscribe.
If you haven't already, you should update your TagBot.yml to include issue comment triggers.
Please see this post on Discourse for instructions and more details.
If you'd like for me to do this for you, comment TagBot fix on this issue.
I'll open a PR within a few hours, please be patient!
Not sure what benefits this might add to the package, but auto-updating dependencies and bundling javascript could be useful
https://medium.com/the-node-js-collection/modern-javascript-explained-for-dinosaurs-f695e9747b70
Add a black and white theme for academic like printing
A declarative, efficient, and flexible JavaScript library for building user interfaces.
🖖 Vue.js is a progressive, incrementally-adoptable JavaScript framework for building UI on the web.
TypeScript is a superset of JavaScript that compiles to clean JavaScript output.
An Open Source Machine Learning Framework for Everyone
The Web framework for perfectionists with deadlines.
A PHP framework for web artisans
Bring data to life with SVG, Canvas and HTML. 📊📈🎉
JavaScript (JS) is a lightweight interpreted programming language with first-class functions.
Some thing interesting about web. New door for the world.
A server is a program made to process requests and deliver data to clients.
Machine learning is a way of modeling and interpreting data that allows a piece of software to respond intelligently.
Some thing interesting about visualization, use data art
Some thing interesting about game, make everyone happy.
We are working to build community through open source technology. NB: members must have two-factor auth.
Open source projects and samples from Microsoft.
Google ❤️ Open Source for everyone.
Alibaba Open Source for everyone
Data-Driven Documents codes.
China tencent open source team.