GEM-FISH is a program that calculates 3D chromosome models through integrating both Hi-C and FISH data with the prior biophysical knowledge about 3D polymers. GEM-FISH was tested on Matlab R2014b and Matlab R2015b
Ahmed Abbas, Xuan He, Bin Zhou, Guangxiang Zhu, Zishan Ma, Jun-Tao Gao, Michael Q Zhang, and Jianyang Zeng. "Integrating Hi-C and FISH data for modeling 3D organizations of chromosomes". Submitted (April-2018)
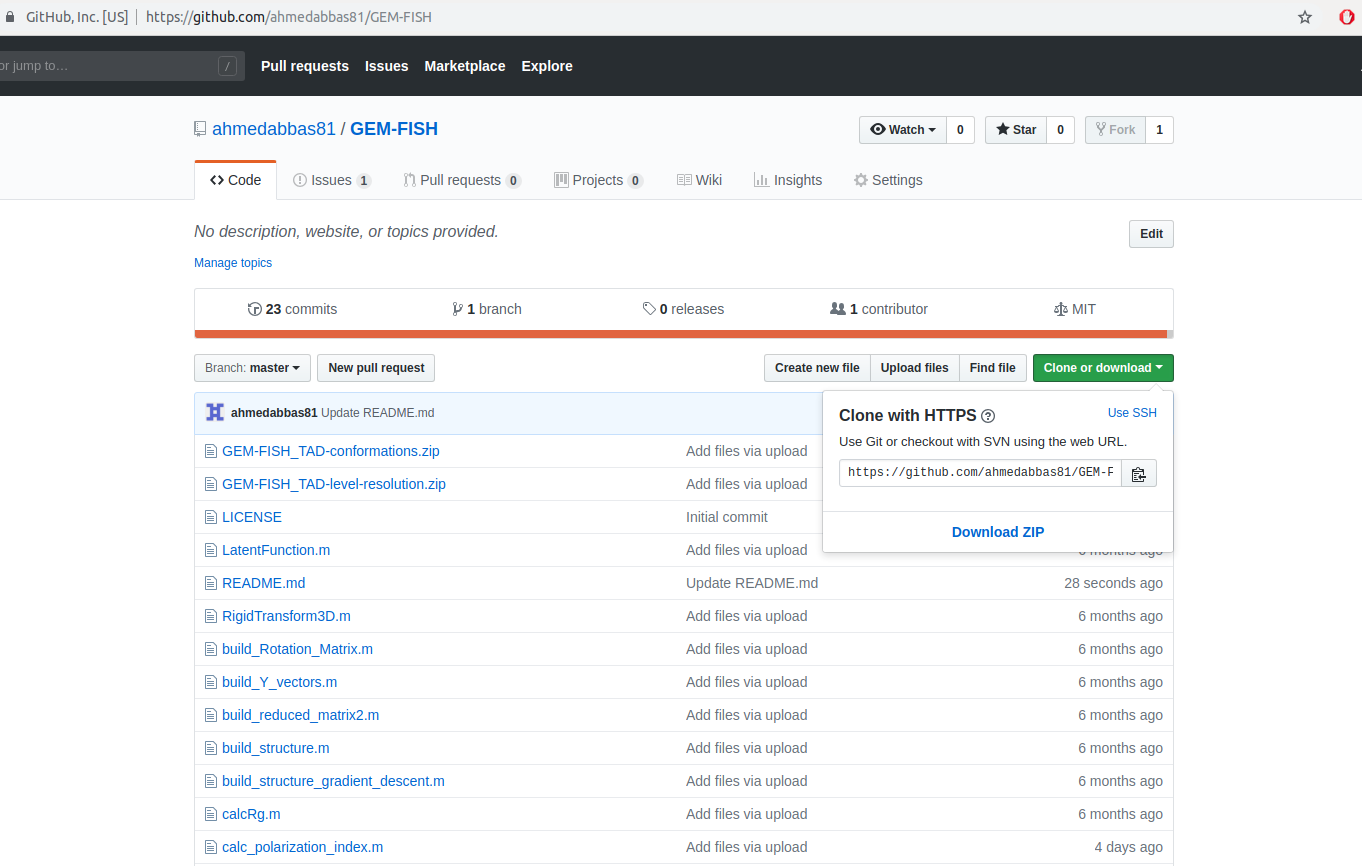
1- Download the source code of GEM-FISH (i.e., the file GEM-FISH-master.zip) by clicking the button "Download ZIP" as in the image.
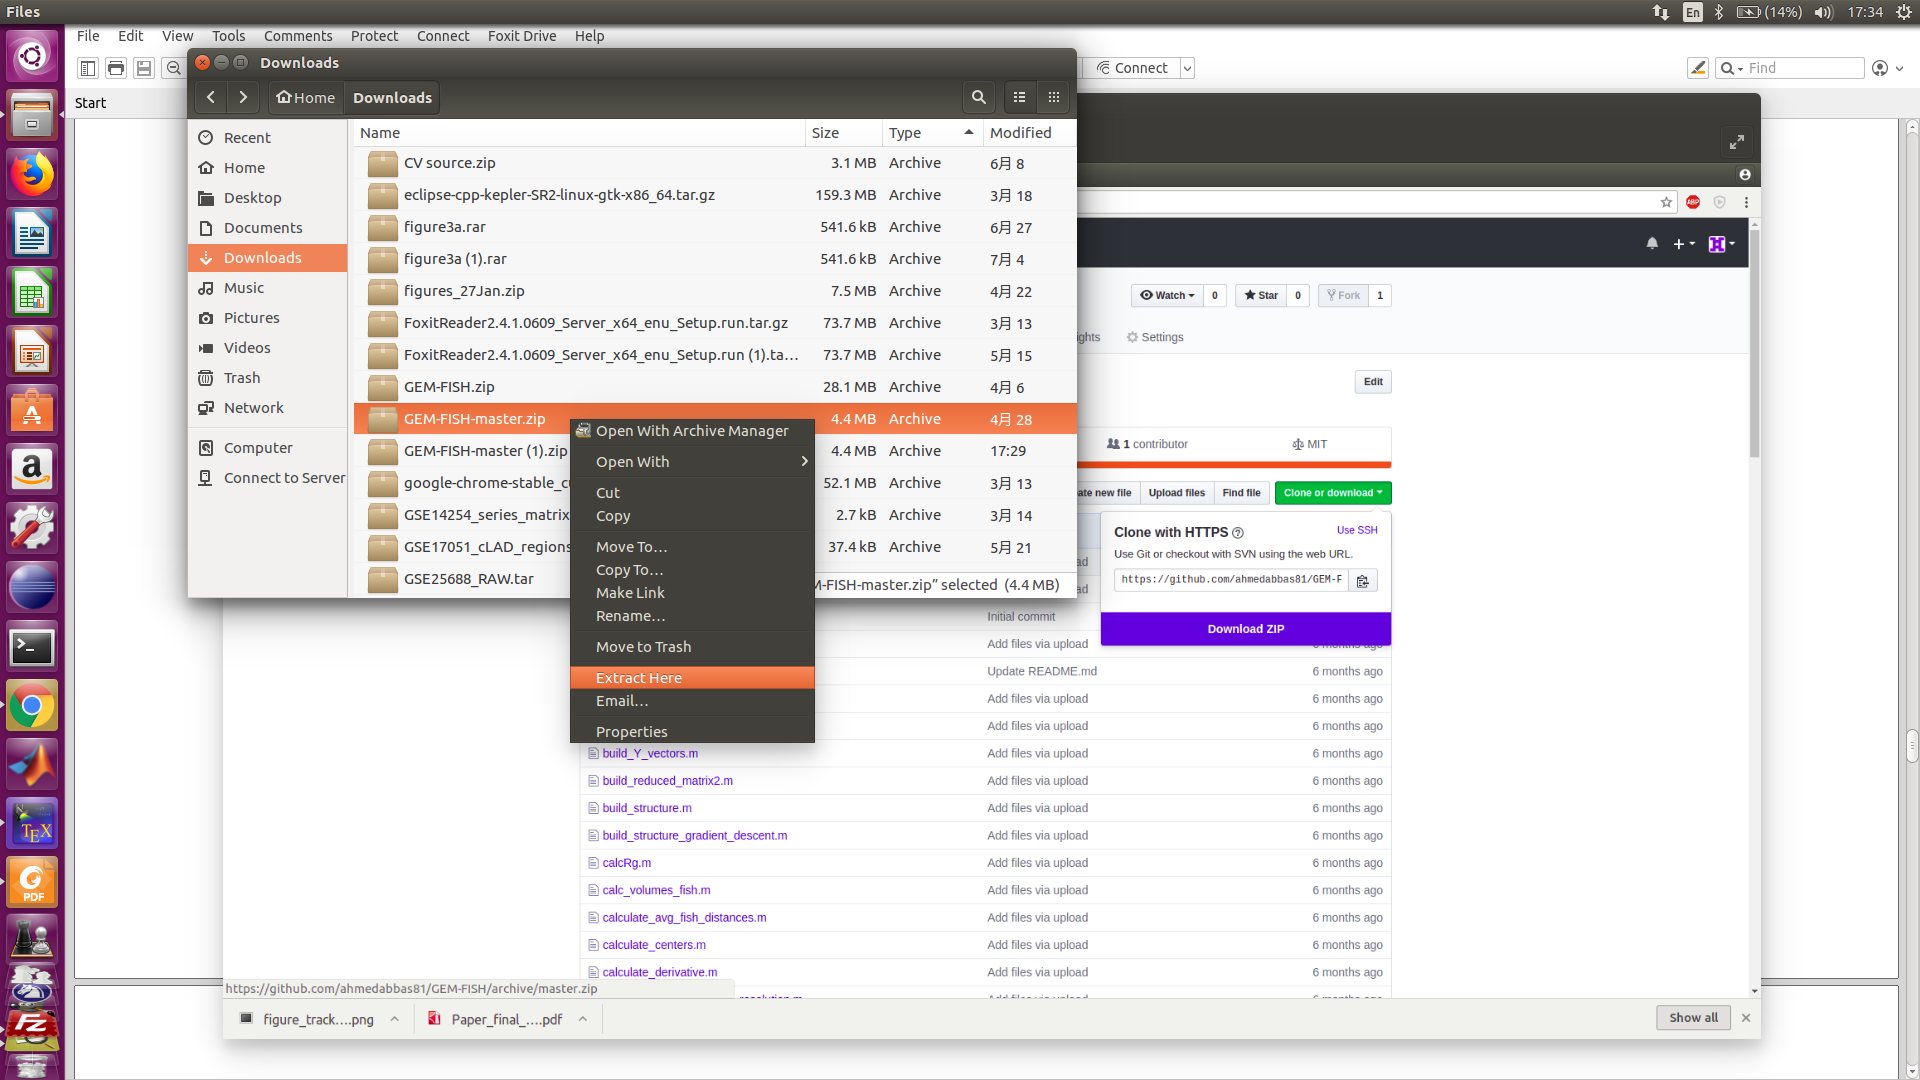
2- Extract the file GEM-FISH-master.zip
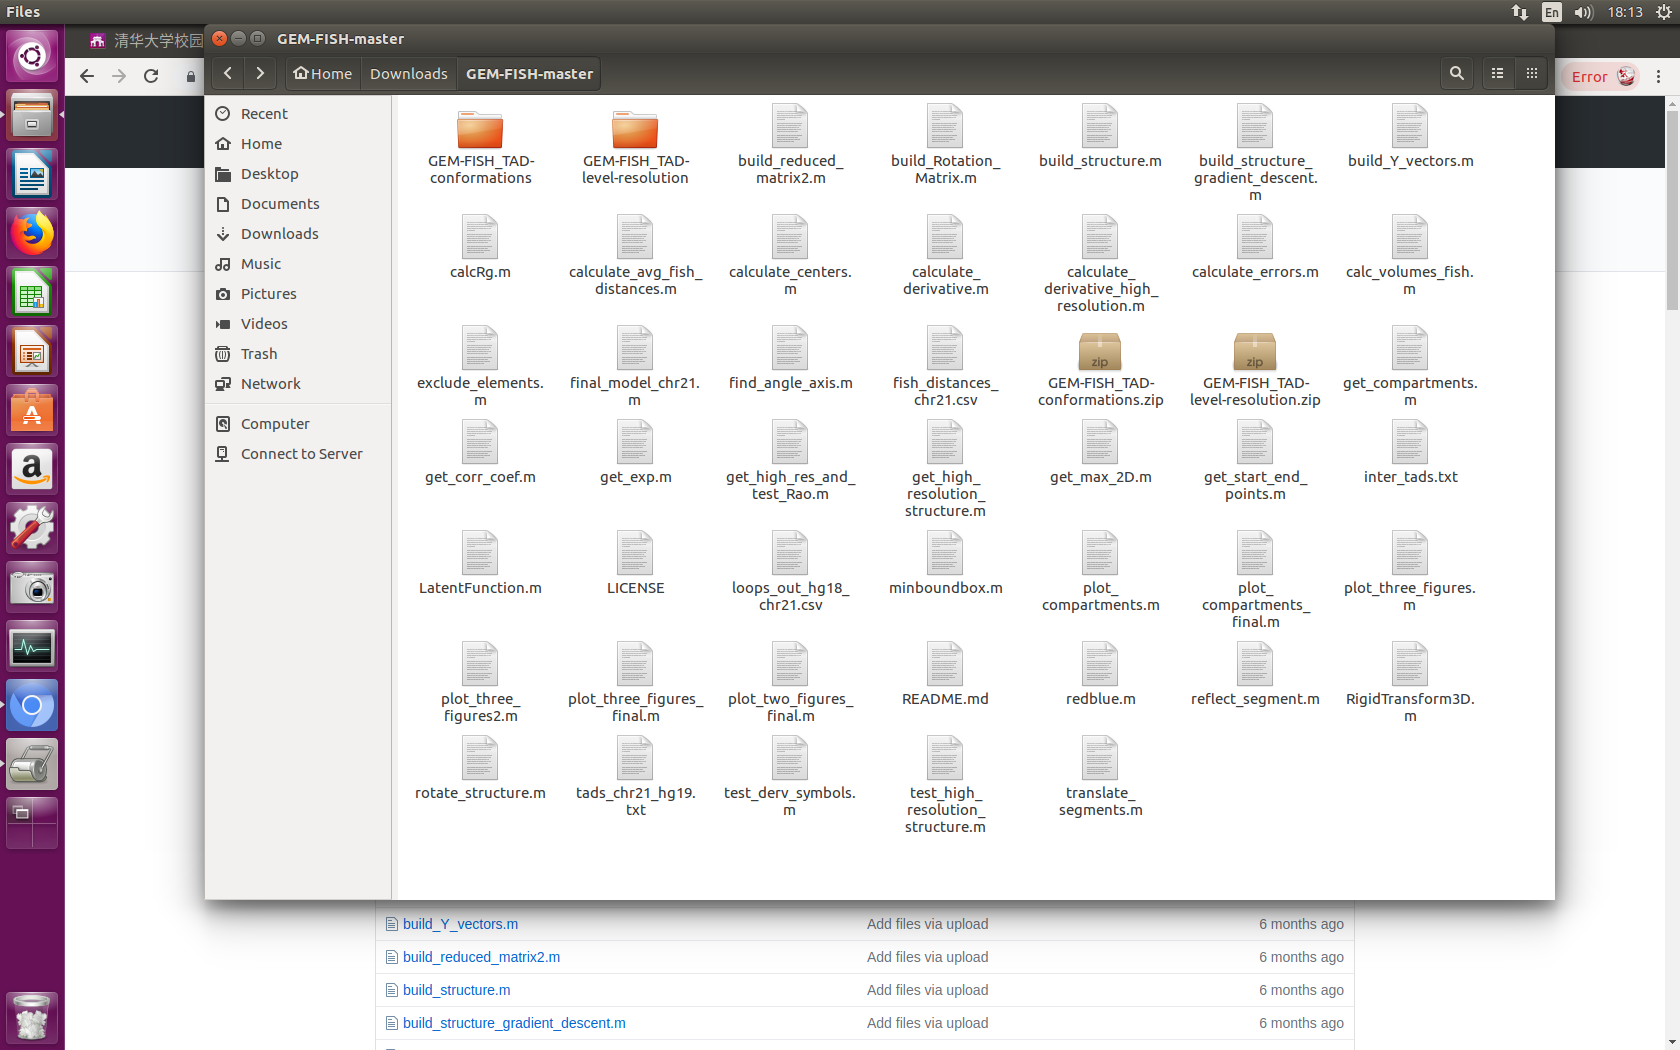
3- The extracted folder GEM-FISH-master has two zip files and a group of '.m' files. The first zip file: GEM-FISH_TAD-level-resolution.zip, has the Matlab scripts to calculate the TAD-level resolution 3D model of a chromosome. The second zip file: GEM-FISH_TAD-conformations.zip has the Matlab scripts to calculate the intra-TAD 3D structure of each individual TAD in the chromosome. The '.m' files in the folder are for the integrating the intra-TAD 3D models to the TAD-level resolution 3D model to produce the final high-resolution 3D model of the chromosome.
4- Extract the two zip files "GEM-FISH_TAD-conformations.zip" and "GEM-FISH_TAD-level-resolution.zip" in the folder GEM-FISH-master. The GEM-FISH-master contents should be as in the picture,
a- Go into the folder GEM-FISH_TAD-level-resolution
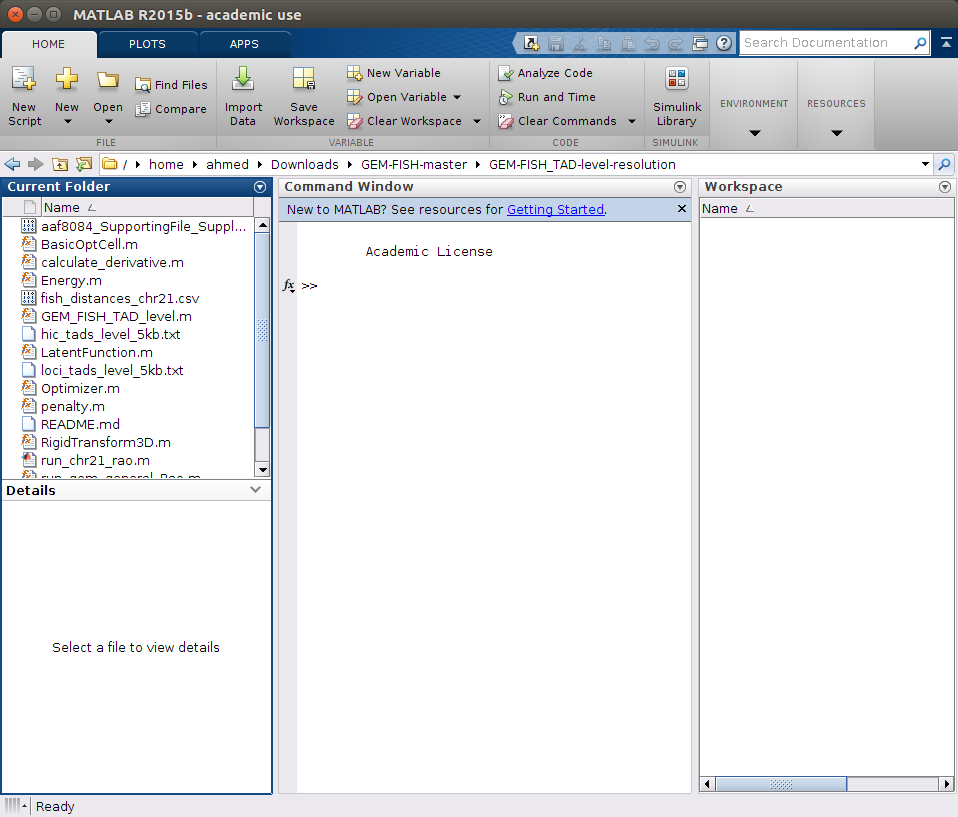
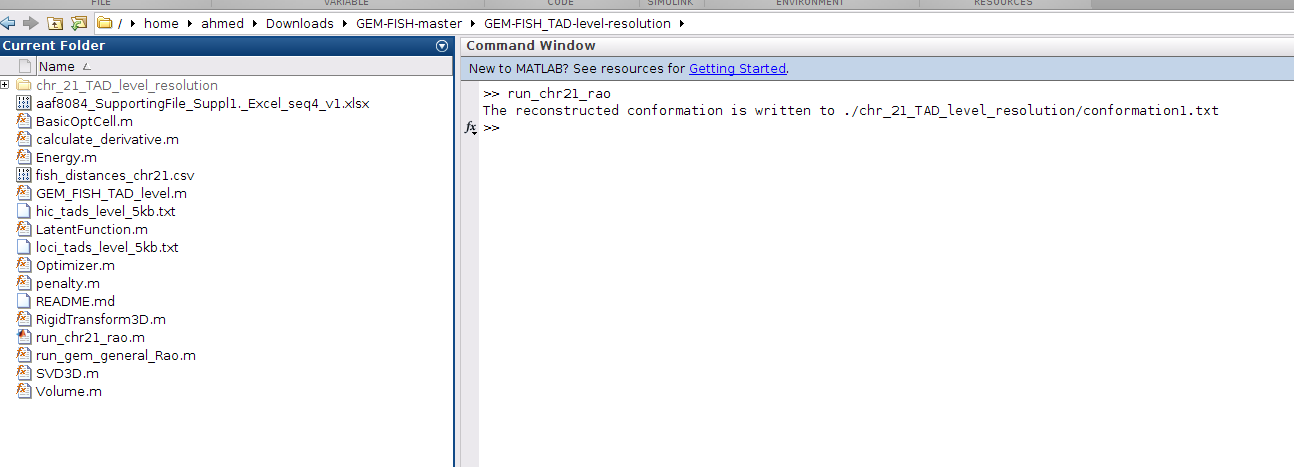
b- Run the m-file 'run_chr21_rao.m' as in the picture below.

c- This will calculate the TAD-level-resolution 3D structure for an example chromosome (Chr21) in a file called "conformation1.txt", and will save it in a newly created folder "chr_21_TAD_level_resolution", as in the picture.
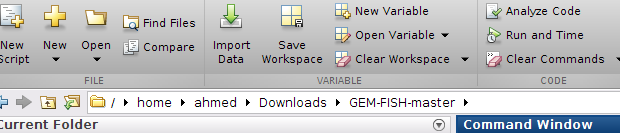
a- Return back to the parent folder "GEM-FISH-master", as in the picture,
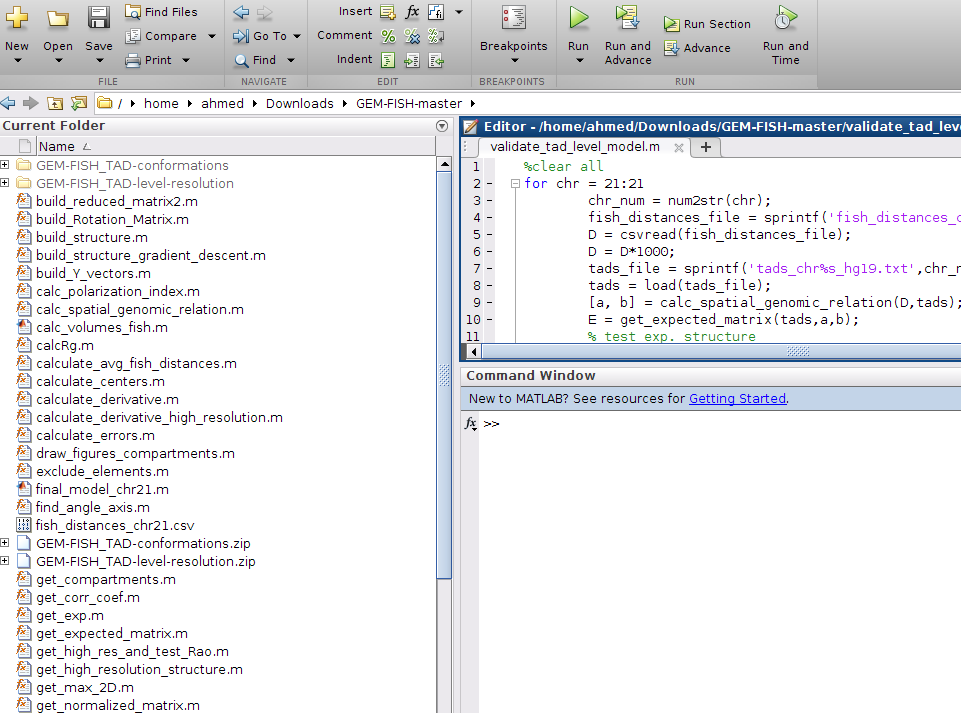
b- Run the script: "validate_tad_level_model.m" to calculate the average relative error, number of correctly assigned TADs to A/B compartments, and the asphericity value of the reconstructed 3D model, as in picture:
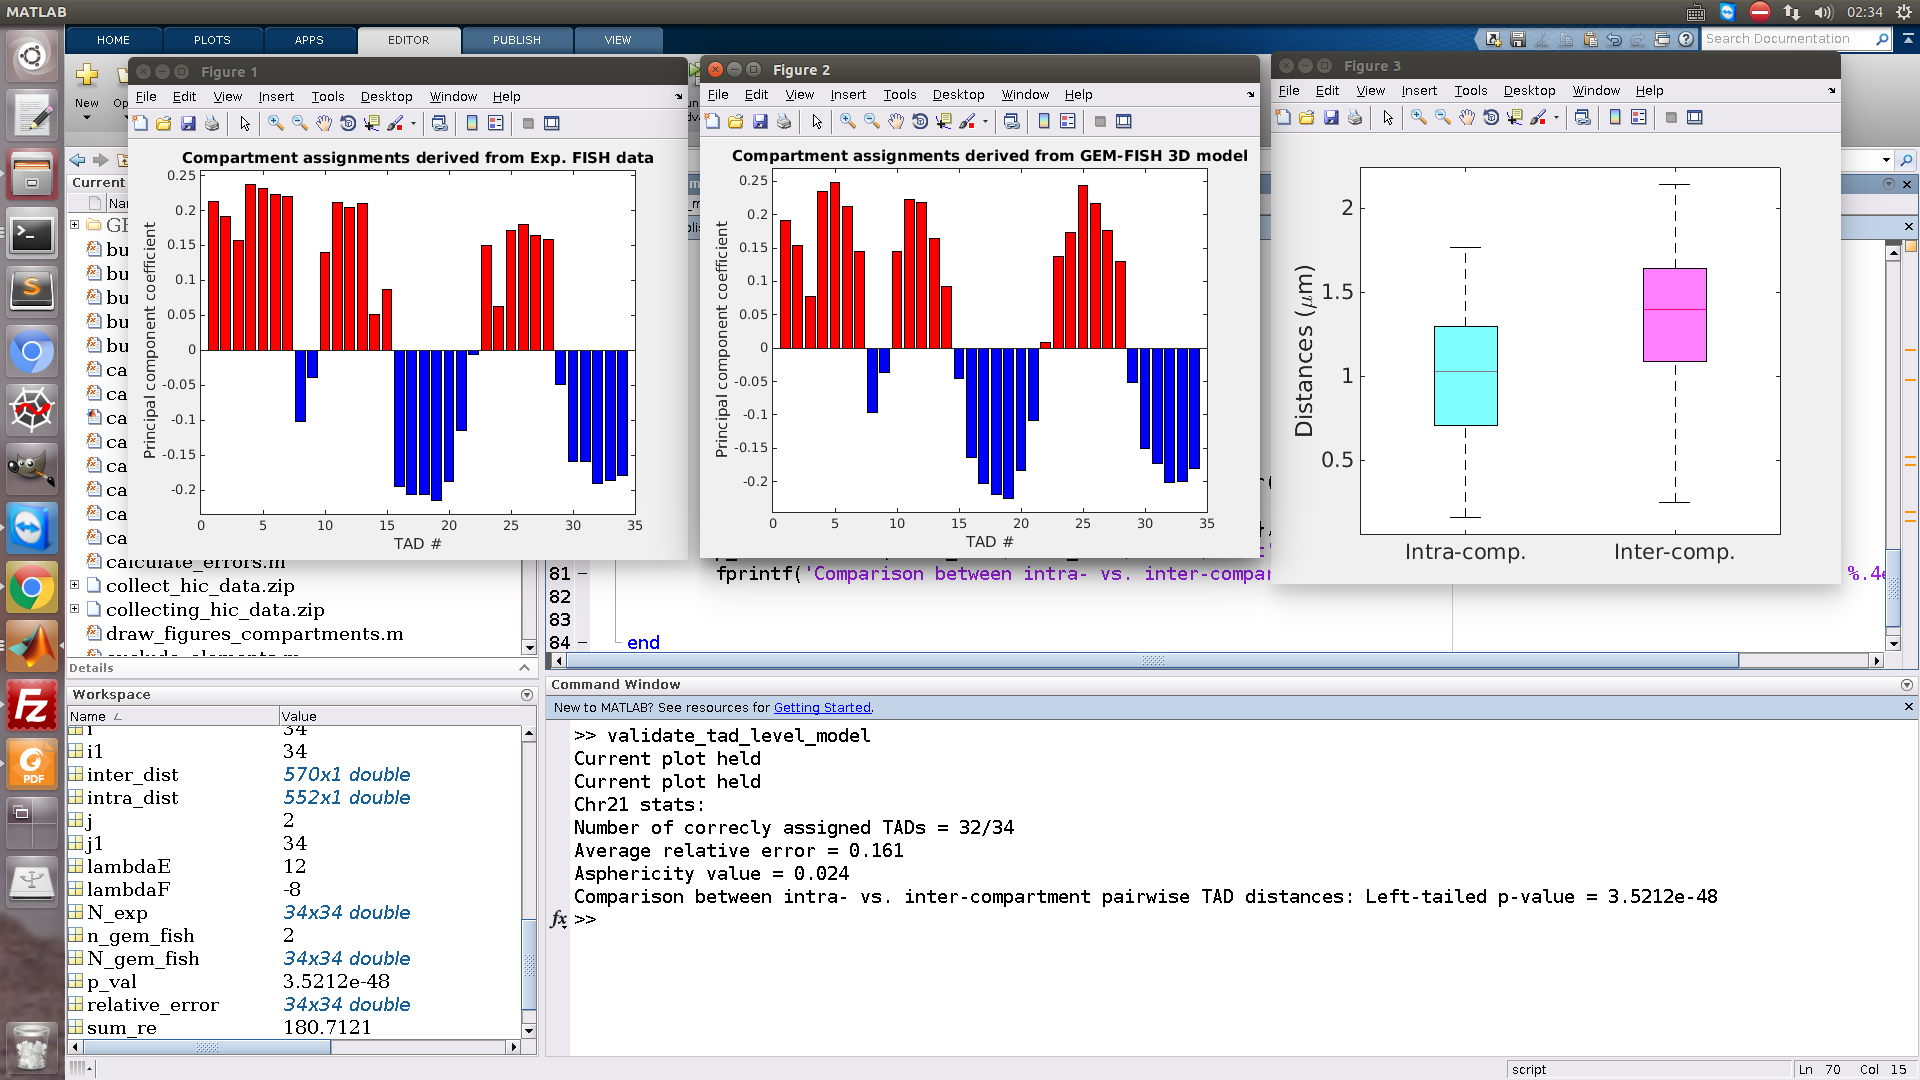
As in the picture, two figures showing the TADs assignment to A/B compartments. The upper one is using the 3D model reconstructed by GEM-FISH (as in its title), and the lower one using the experimental FISH data. As in the figures, only two TADs are wrongly assigned.
The third figure shows the intra- vs. inter-compartment TAD pairwise distances.
In addition, on the matlab command window, the numeric results are appearing,
Number of correctly assigned TADs = 32/34
Average relative error = 0.162
Asphericity value = 0.024
Comparison between intra- vs. inter-compartment pairwise TAD distances: Left-tailed p-value = 3.5212e-48
a- Go into the folder GEM-FISH_TAD-conformations
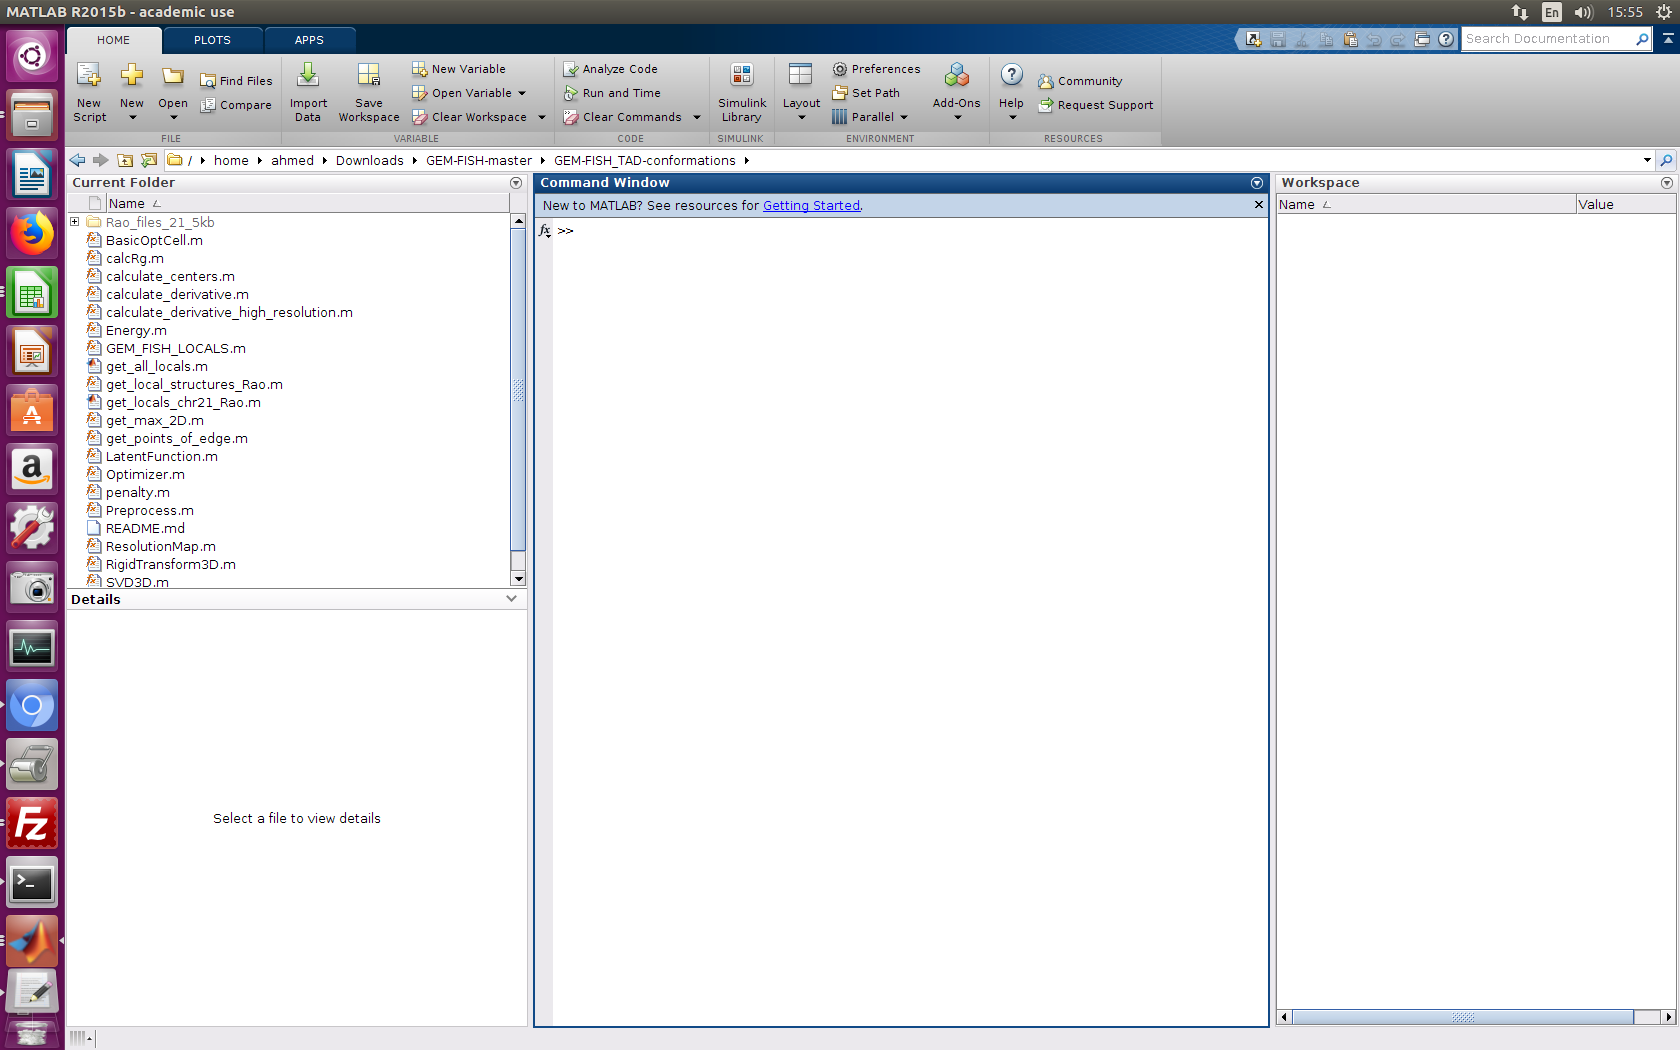
b- Run the m-file 'get_locals_chr21_Rao.m'. This will calculate the intra-TAD conformation of individual TADs of the example chromosome (Chr21).
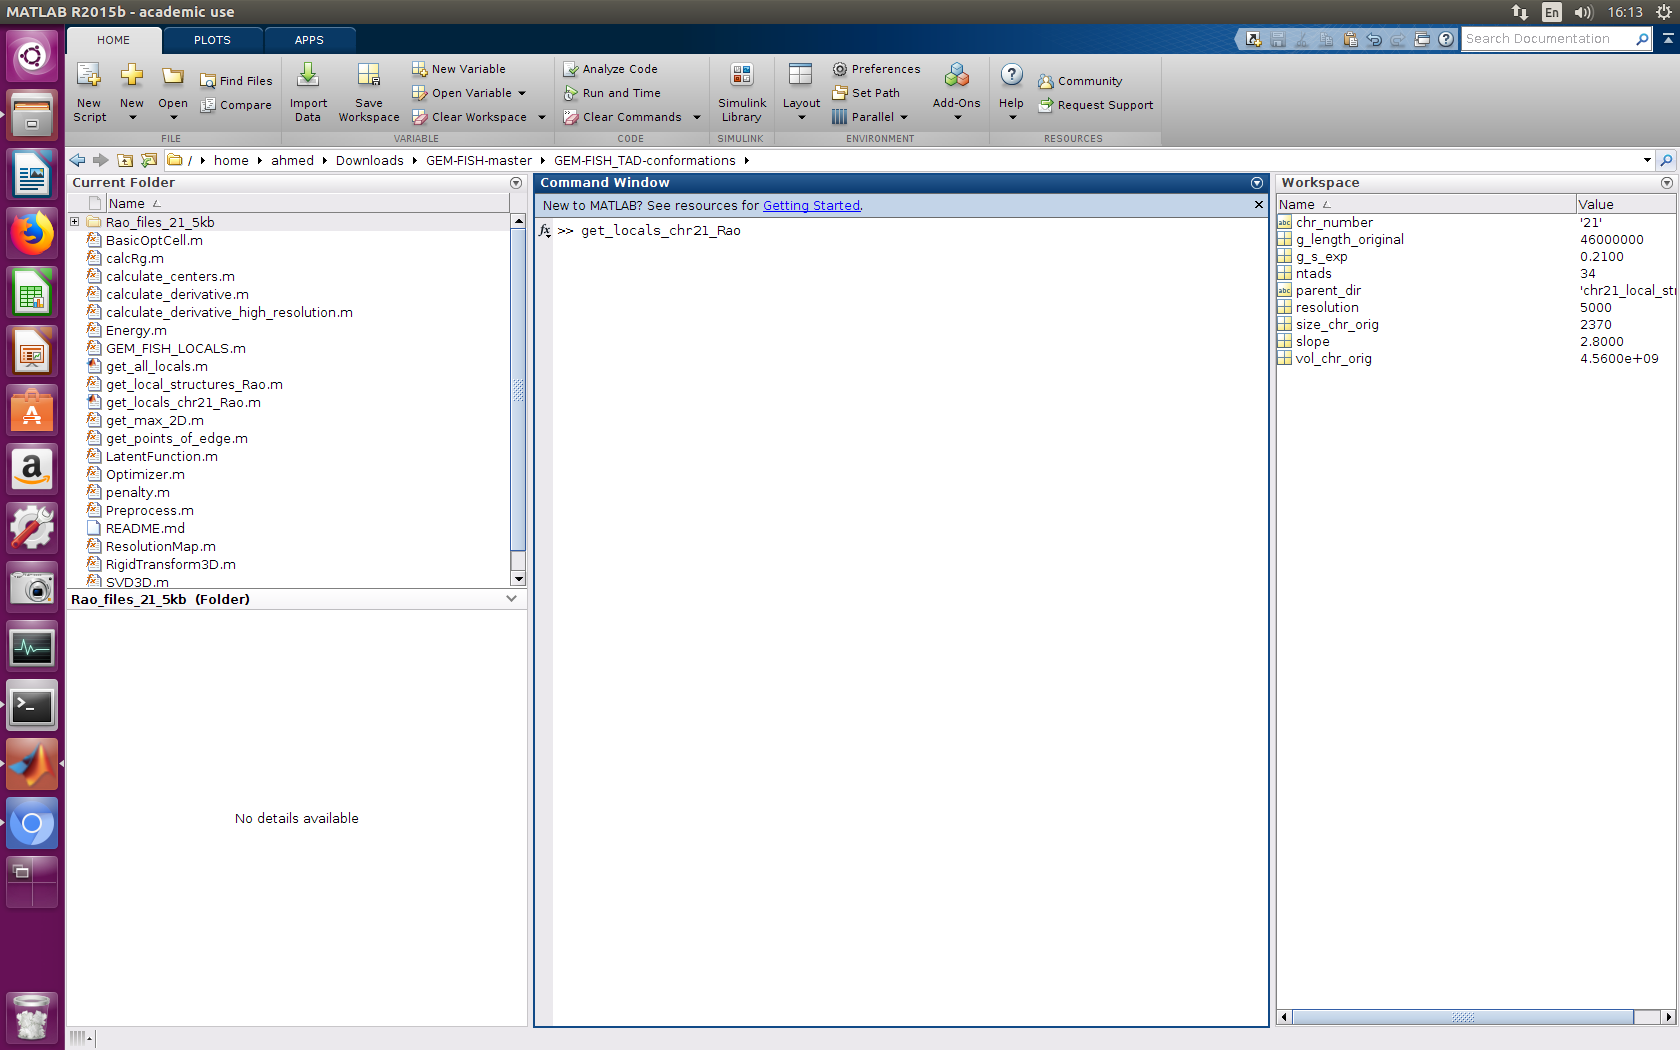
This will calculate the 3D models of the 34 TADs of chr21 sequentially.
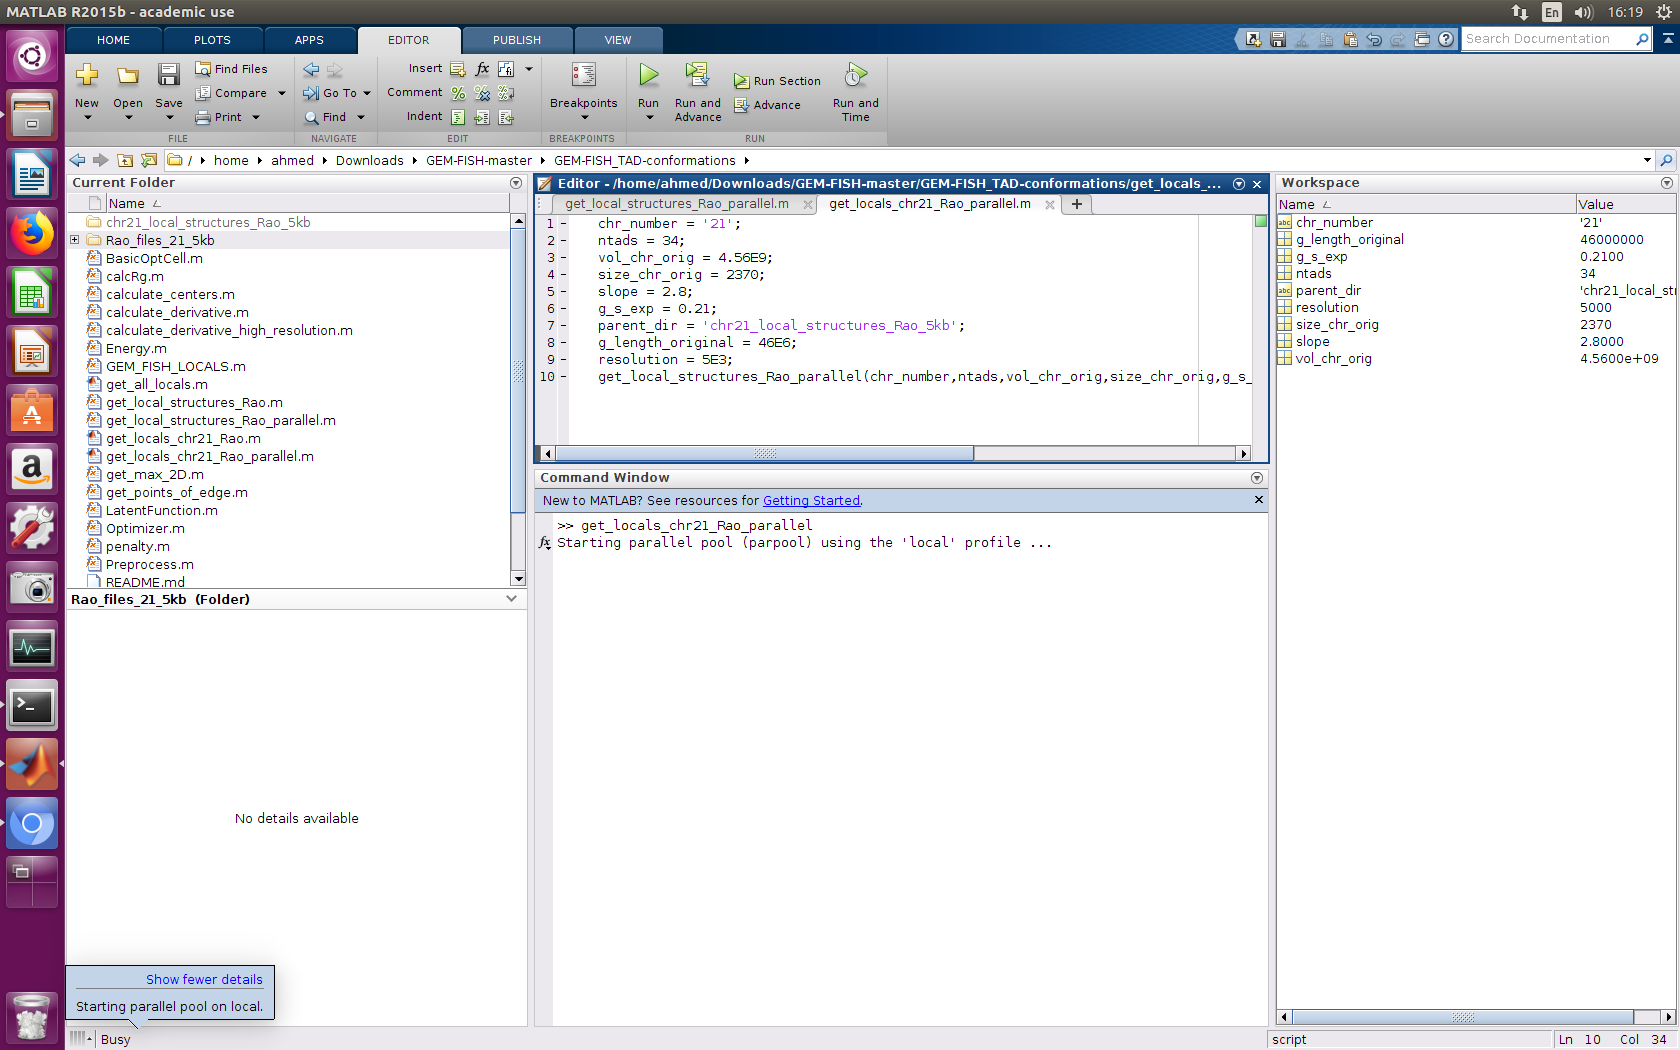
c- Instead, to calculate them in parallel, run the m-file 'get_locals_chr21_Rao_parallel.m'
a- Go back to the parent folder GEM-FISH
b- Run the m-file 'final_model_chr21.m'. This will calculate the final 3D model of the chromosome investigated (Chr21 in our case)
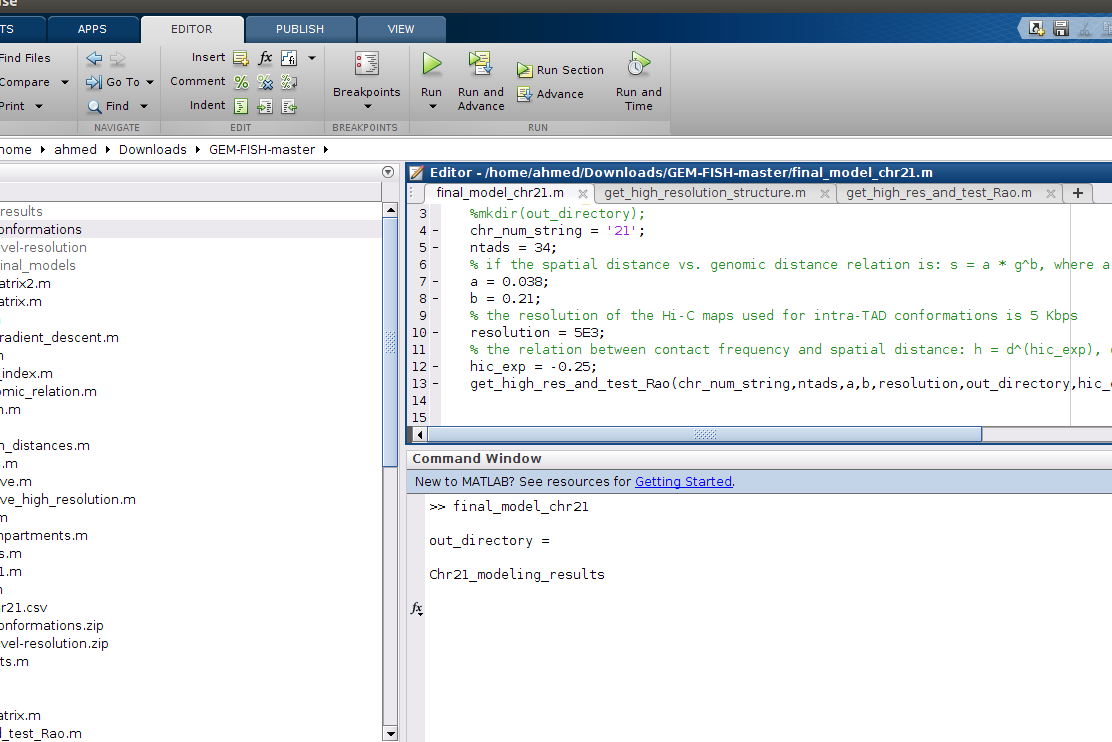
c- The final 3D structure is written in the file 'final_model.txt' in the GEM_FISH folder
We added a folder containing the final 3D models reconstructed by GEM-FISH for the Chrs 20, 21, and 22.
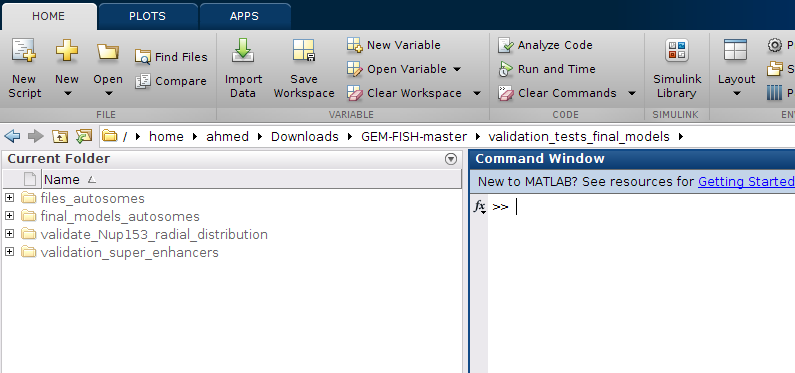
a- Extract the folder "validation_tests_final_models.zip"

b- Go to the extracted folder in Matlab as shown in picture
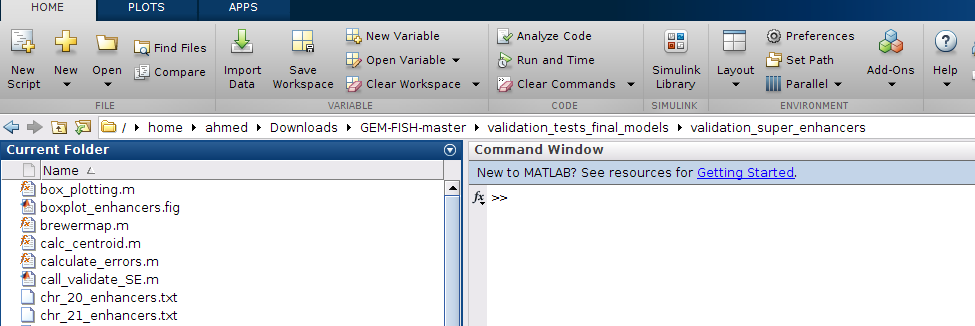
a- To test the spatial distributions of super-enhancers and regular enhancers, go to the folder "validation_super_enhancers" as shown
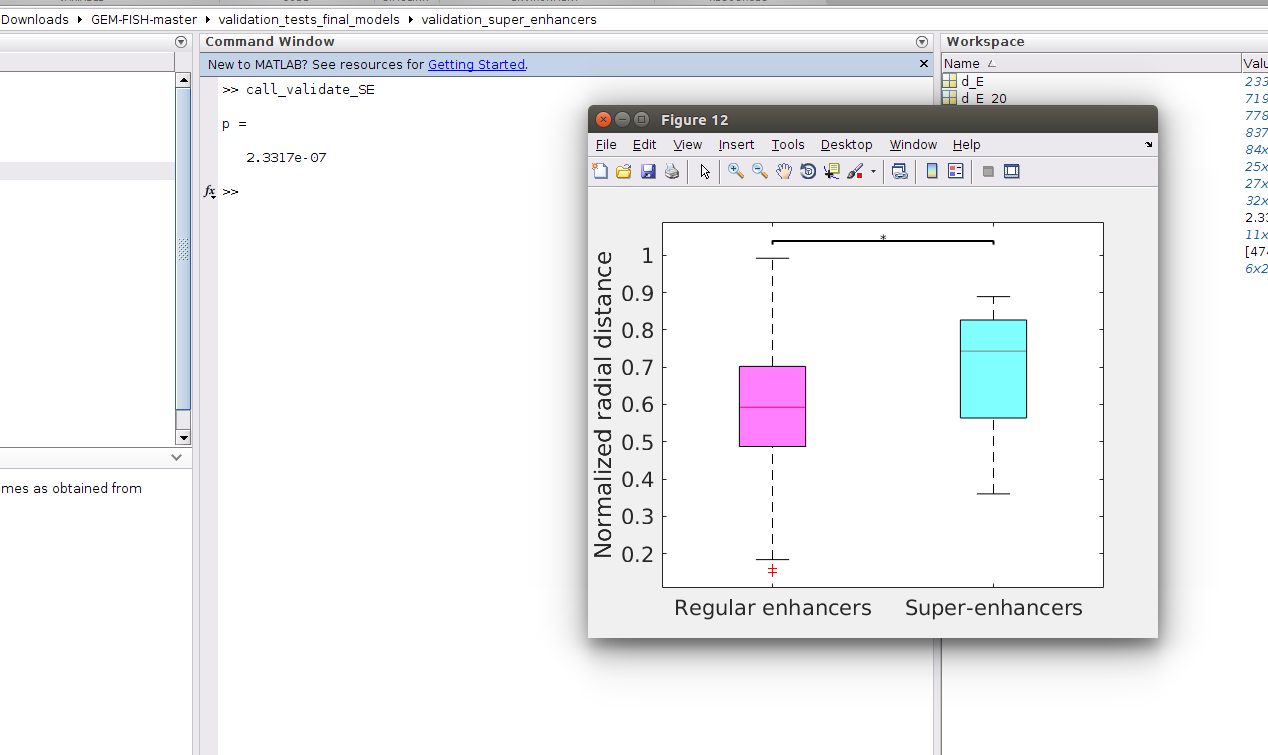
b- Run the m-file "call_validate_SE.m", which will draw a boxplot showing the normalized radial distances of super-enhancers and regular enhancers in the three autosomes 20, 21, and 22. It will also calculate the p-value using Wilcoxon rank sum test as in picture
Test the spatial distributions of the genomic sites interacting with the nuclear pore complex component Nup153
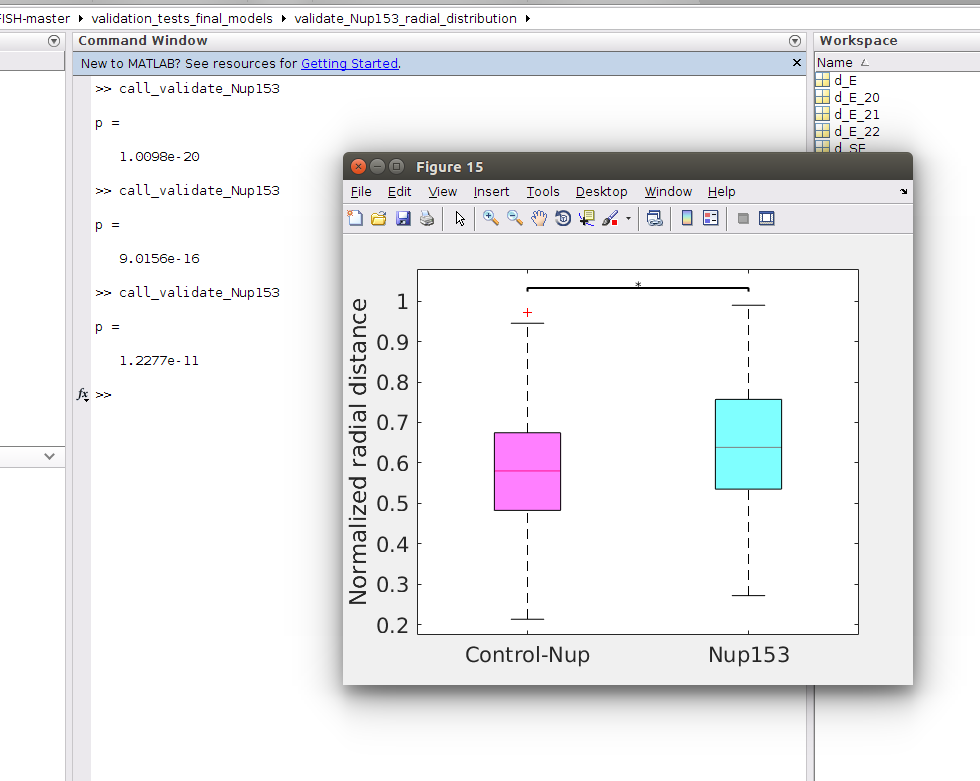
a- To test the spatial distributions of the genomic sites interacting with the nuclear pore complex component Nup153 in the three autosomes, go to folder "validate_Nup153_radial_distribution" as shown in picture

b- Run the m-file "call_validate_Nup153.m", which will compare the spatial distributions of genomic sites interacting with Nup153 to random loci of same genomic lengths (denoted by Control-Nup), as shown in picture

Note that the result will change if we run the same script again, because in each time it will select a new set of random loci, as shown in the picture
a- Go to the folder "validating_loop_loci" as shown in the picture
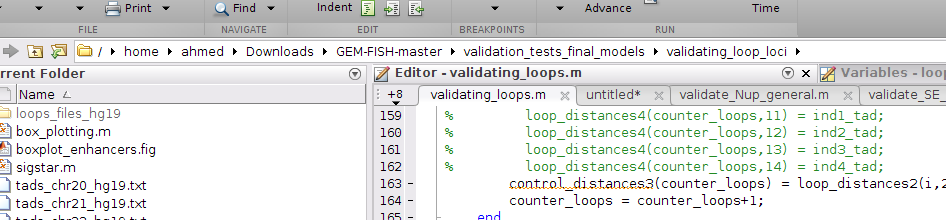
b- To draw the boxplots of the packing densities between loop and control anchor loci for Chr20, type: validating_loops('20',5000) as shown in the picture, where 5000 is the resolution of the intra-TAD 3D models (i.e., each point in the intra-TAD 3D models represents 5 Kbp)

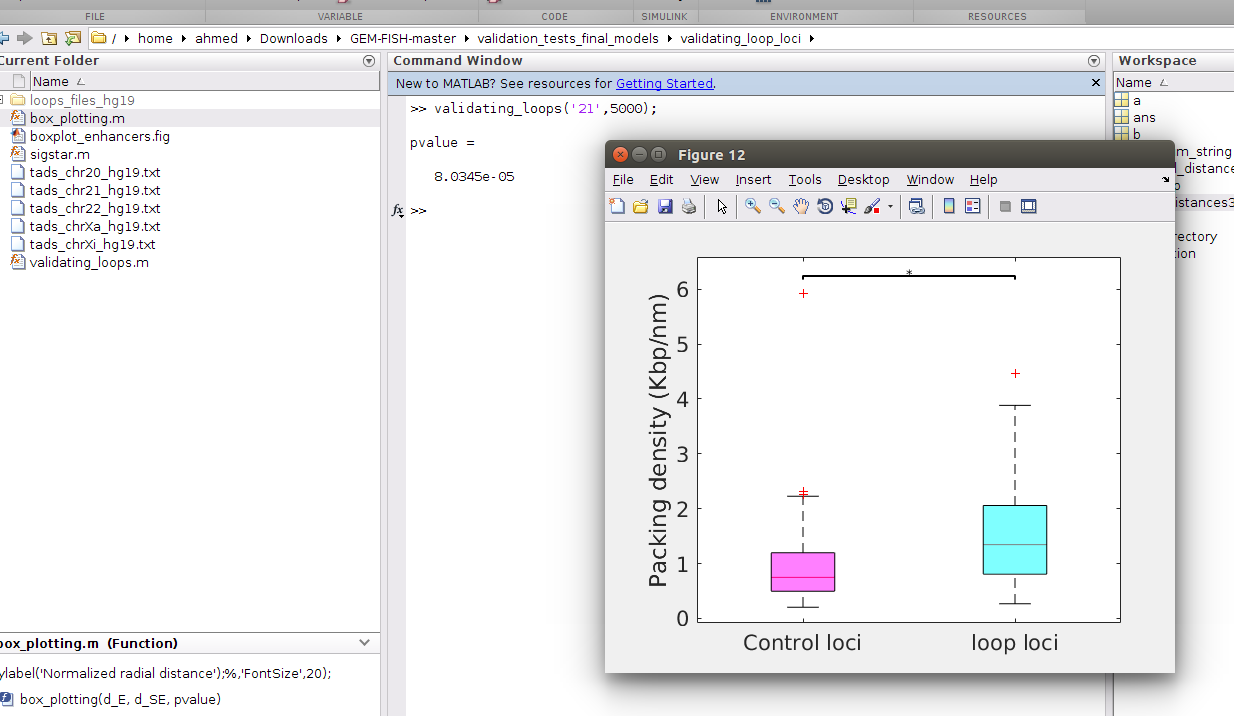
The p-value is calculated using one-tailed Wilcoxon rank sum test
c- To draw the boxplots of the packing densities between loop and control anchor loci for Chr20, type: validating_loops('21',5000) as shown in the picture
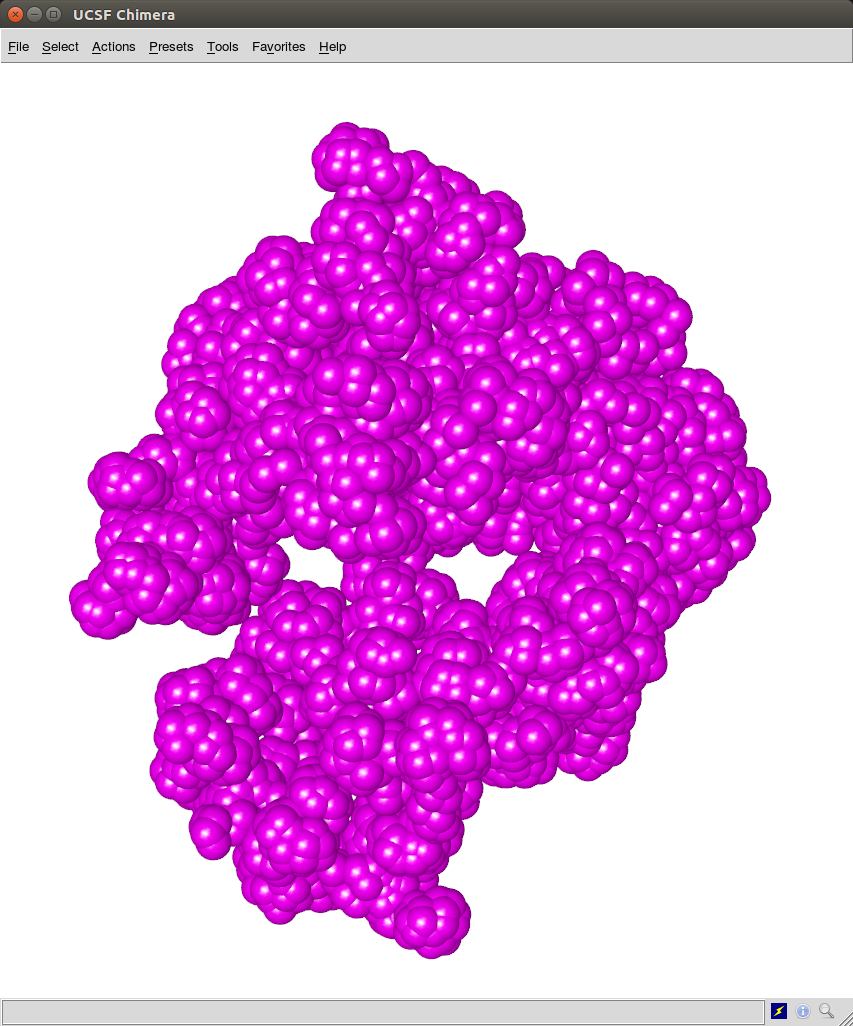
To visualize the 3D models reconstructed by GEM-FISH, we used UCSF CHIMERA (UCSF Chimera--a visualization system for exploratory research and analysis. Pettersen EF, Goddard TD, Huang CC, Couch GS, Greenblatt DM, Meng EC, Ferrin TE. J Comput Chem. 2004 Oct;25(13):1605-12)
a- Go to the folder "visualize_structures" as shown in the picture

b- To create ".cmm" files for the three example autosomes, run the script call_write_cmm_files.m as shown

This will create the files: chr20_final_model.cmm, chr21_final_model.cmm, and chr22_final_model.cmm
c- The ".cmm" files can be opened using UCSF Chimera as shown
To get the Hi-C maps for the whole chromosome at the TAD-level resolution and the Hi-C maps for individual TADs within the chromosome,
a- Extract the file "collect_hic_data.zip" as shown in the picture
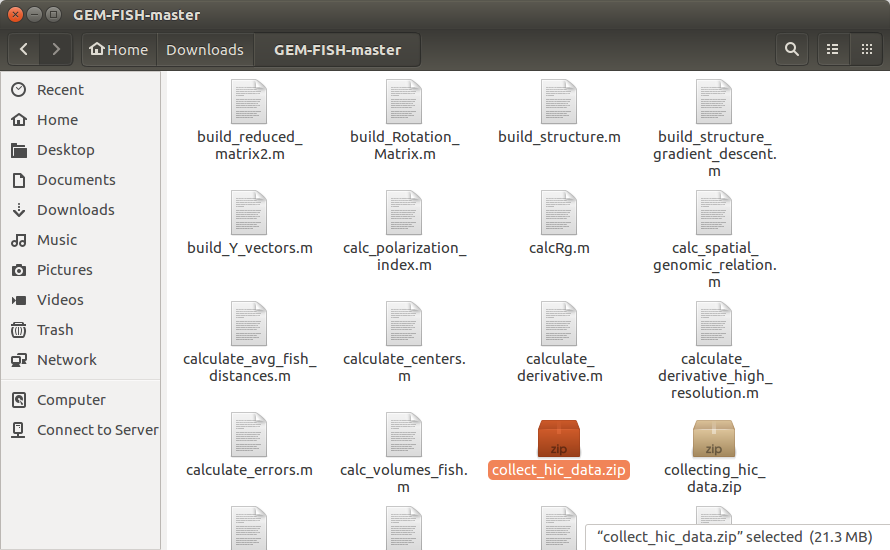
b- The extracted folder contains Hi-C data at the 5 Kbp, 25 Kbp, 50 Kbp, and 100 Kbp obtained from https://www.ncbi.nlm.nih.gov/geo/query/acc.cgi?acc=GSE63525
c- The extracted folder also contains "config.txt" file to specify which chromosome to derive Hi-C maps for and at which resolution. The config file included will derive intra-TAD Hi-C maps at 5 Kbp resolution.
d- Create a folder and name it "chr20_output_files" (the name mentioned in line 4 in the config file). This folder will get all the derived output Hi-C maps.

e- To get the Hi-C maps for Chr20 for instance, open a terminal and go to the extracted folder as in the picture,

f- Compile the "readHiCdata_Rao_general.cpp" file as shown
g- Run the program as shown

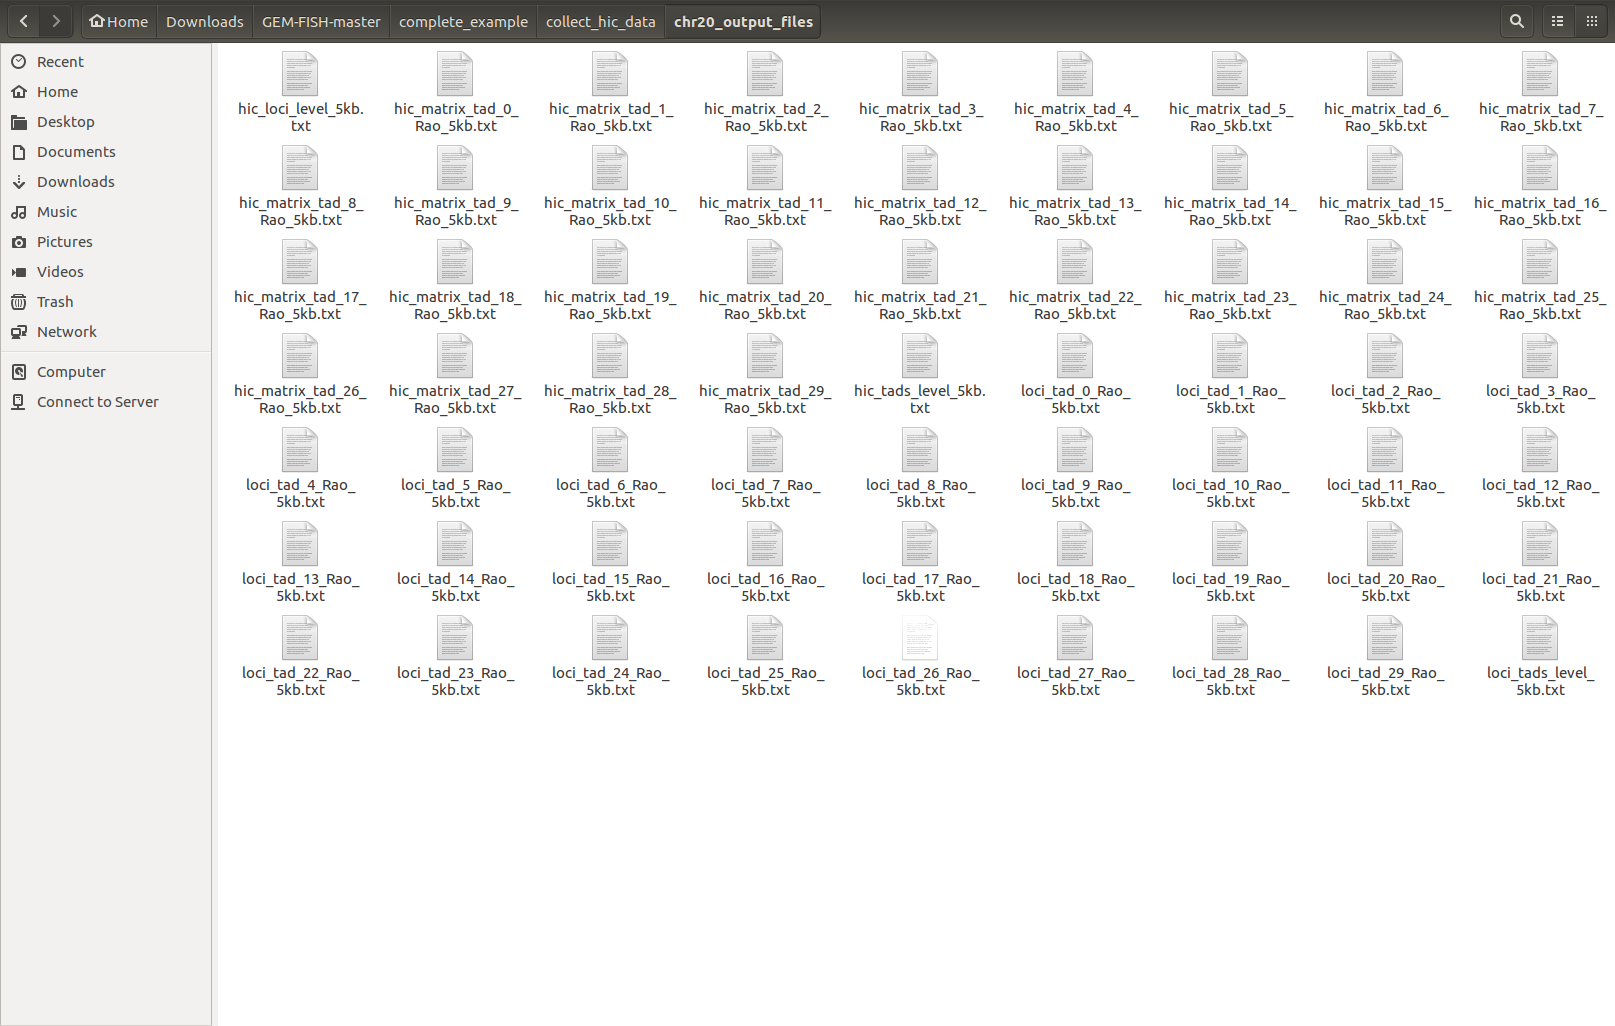
h- The output files are created inside the folder "chr20_output_files" as shown,

The TAD-level resolution Hi-C map and loci locations are: "hic_tads_level_5kb.txt" and "hic_loci_level_5kb.txt", respectively.
The intra-TAD Hi-C maps and loci files for the 30 TADs of Chr20 are: "hic_matrix_tad_i_Rao_5kb.txt" and "loci_tad_i_Rao_5kb.txt", respectively, where i = 0-29.
a- Extract the zip file called "complete_example"

b- The folder "complete_example" has four sub-folders:
1- collect_hic_data
2- create_TAD_level_model
3- create_individual_TAD_models
4- build_final_model

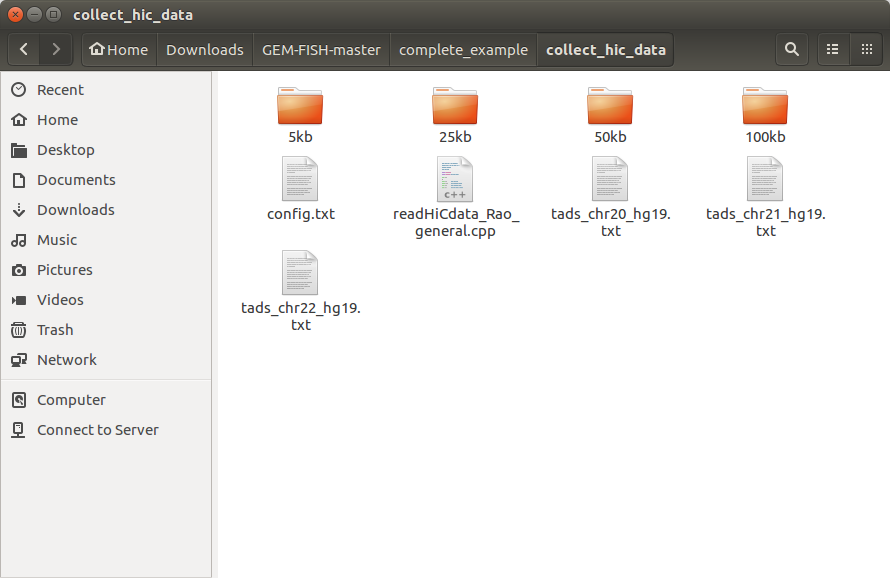
c- To build the TAD-level resolution Hi-C map and the intra-TAD Hi-C maps for Chr20, go to the folder "collect_hic_data" as shown,
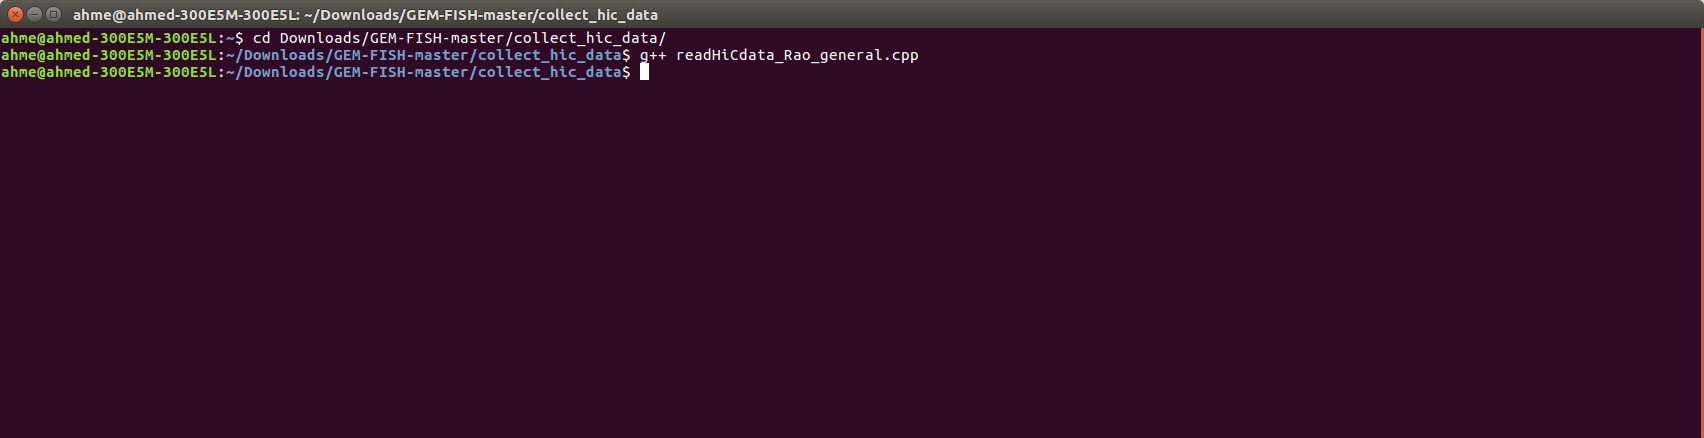
d- Open a Terminal and compile the ".cpp" file that reads the raw Hi-C data, as shown

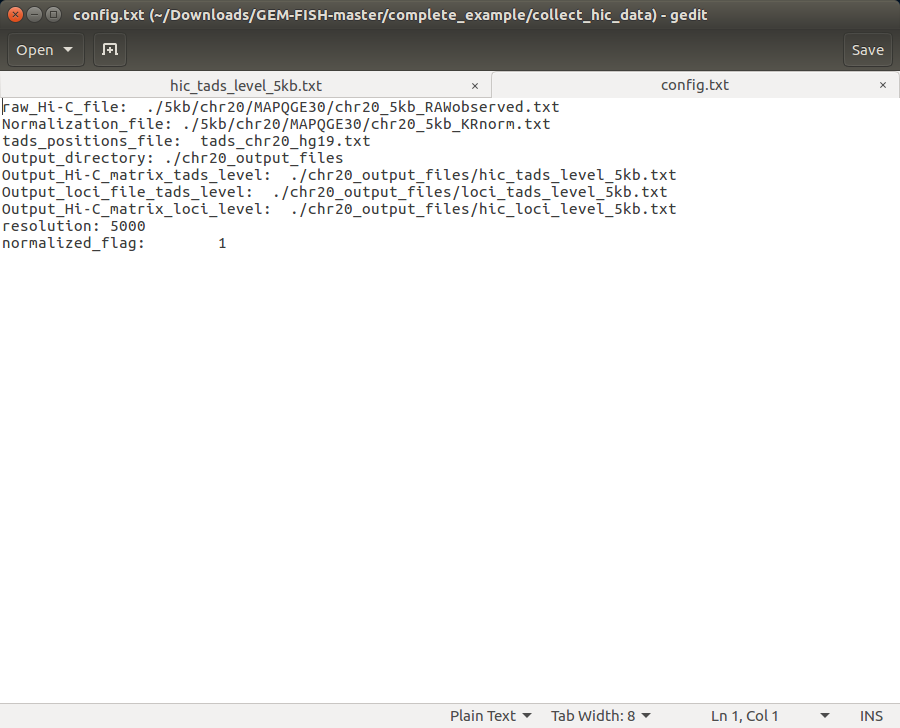
e- The "config.txt" file is adjusted as an example to build the Hi-C maps of Chr20, with the intra-TAD Hi-C maps having resolution 5 Kbp, as shown
f- Create a new folder and name it "chr20_output_files", as in line 4 in the config file, as shown

g- Run the program in the terminal by typing: ./a.out, as shown
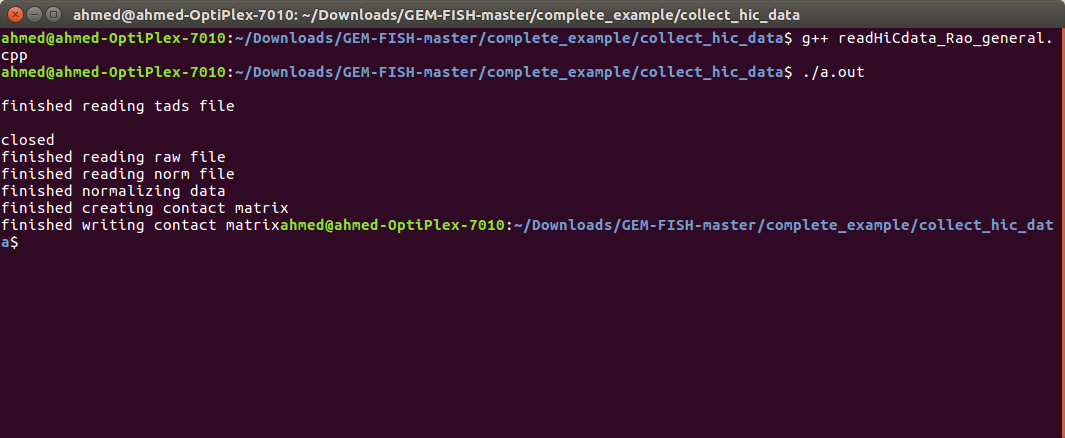
h- The output files: Hi-C maps and loci locations files for the chromosome at the TAD-level resolution and also for individual TADs are now created in the folder: "chr20_output_files", as shown
i- To calculate the TAD-level resolution 3D model for Chr20, open Matlab and go to the folder: "create_TAD_level_model", as shown:
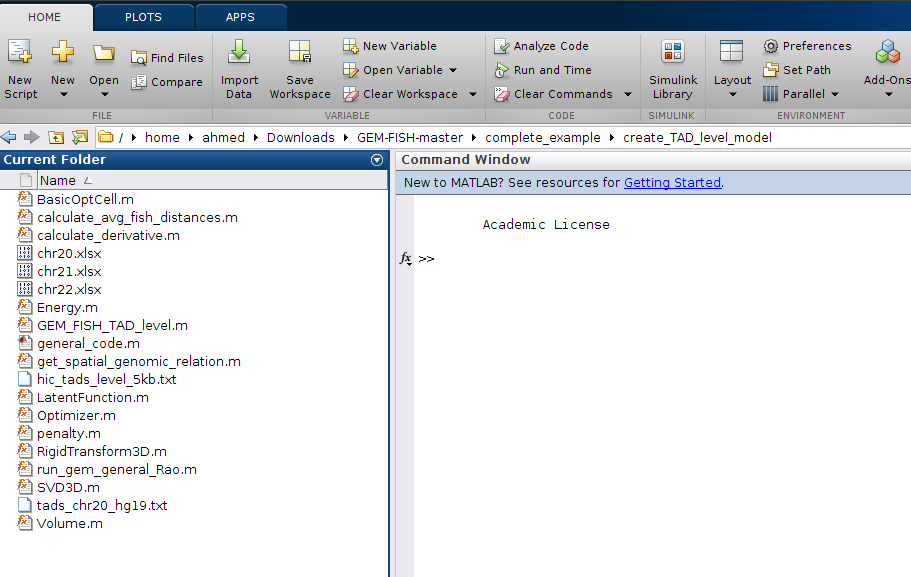
j- The main file that will need to be changed in case the user wants to calculate the models for other chromosomes is called: "create_TAD_level_model.m", as shown

k- To calculate the model for Chr20, run the m-file "create_TAD_level_model.m", as shown
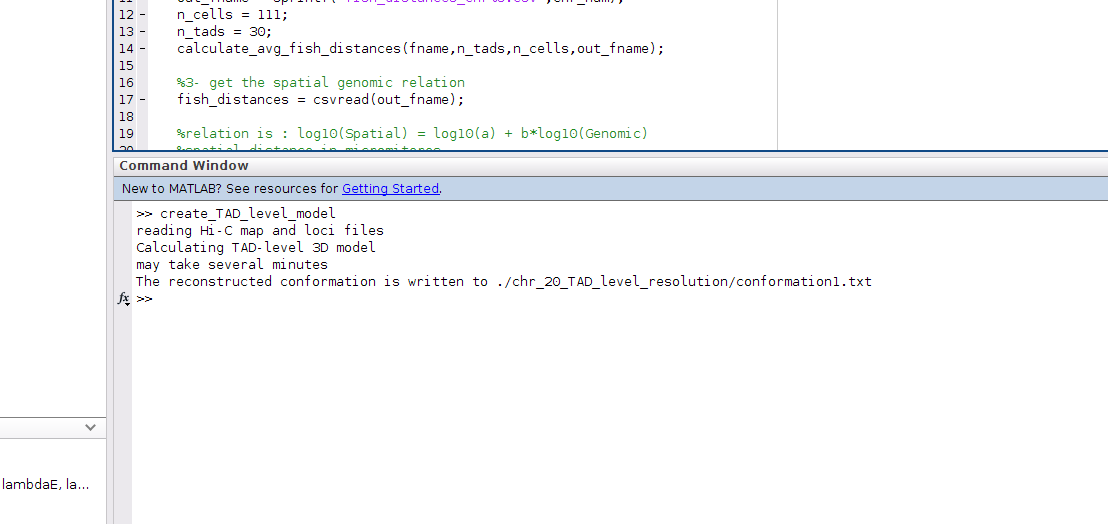
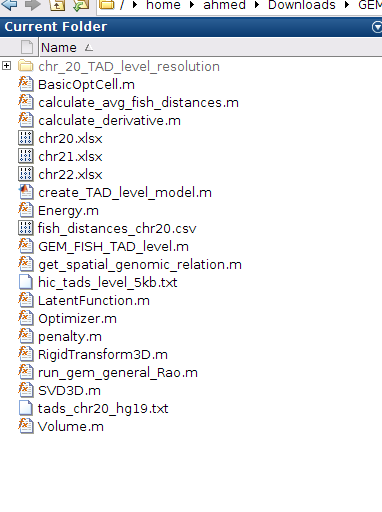
l- The output 3D model will be in the folder: chr_20_TAD_level_resolution
m- To create the 3D models of individual TADs, go to the folder: "create_individual_TAD_models" and open the file: "get_locals_chr20_Rao_parallel.m", as shown. If 3D models for TADs of another chromosome to be calculated, please change the entries in this file
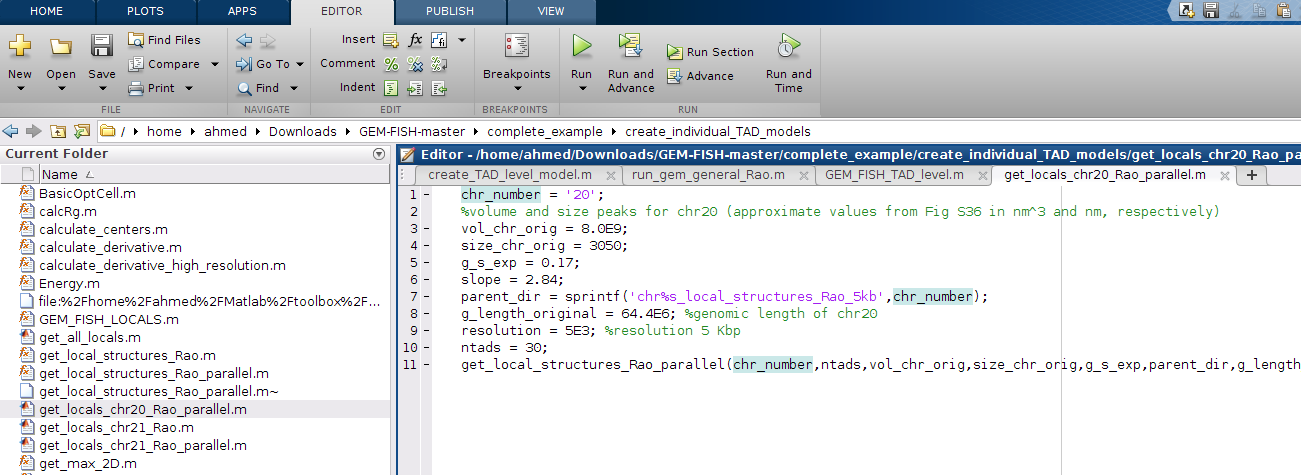
n- Run the m-file: get_locals_chr20_Rao_parallel.m, as shown:

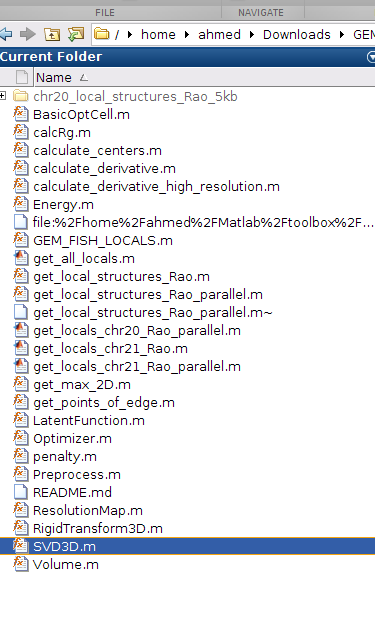
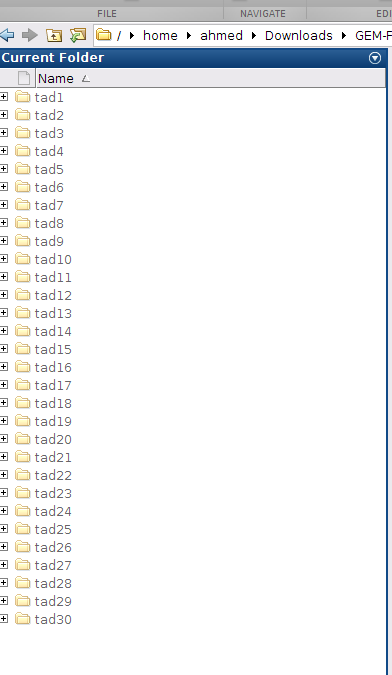
o- After several hours, all the 3D models of all TADs will be calculated and put in the folder: chr20_local_structures_Rao_5kb, as shown
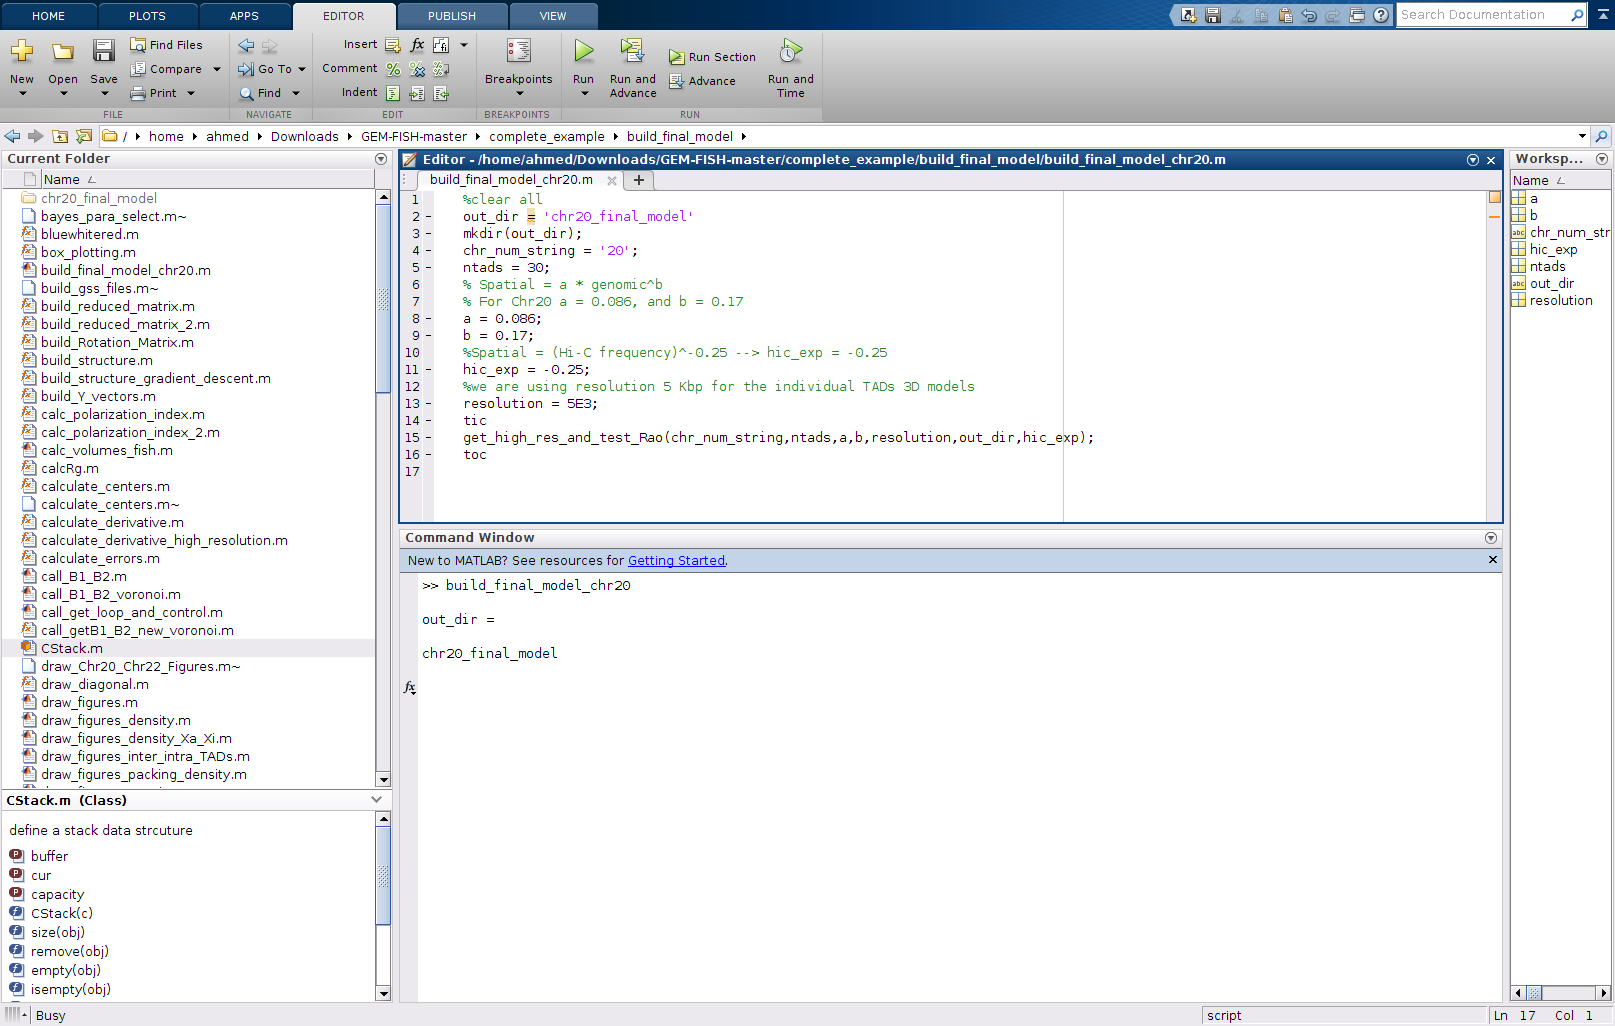
p- To build the final model, go to the folder: "build_final_model"
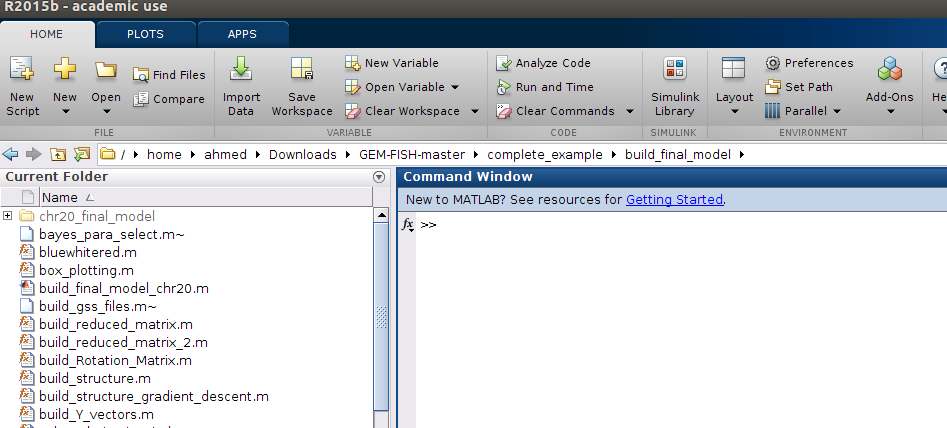
q- The main file to be changed if to calculate models for other chromosomes are: build_final_model_chr20.m
r- Run the file: build_final_model_chr20.m, as shown

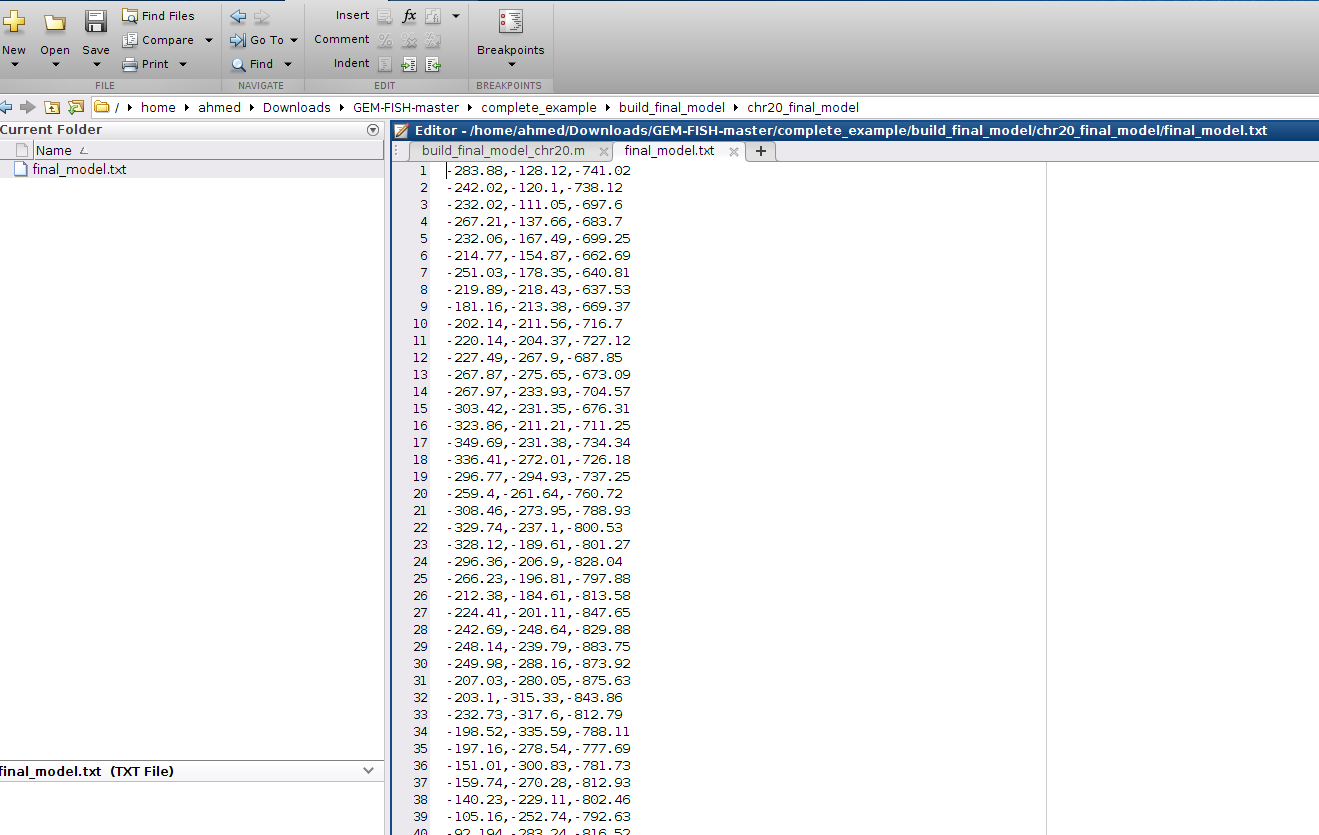
s- The final high-resolution 3D model is in folder chr20_final_model, as shown
=================================================================================

