Git Product home page Git Product logo

q-rapids / qrapids-dashboard Goto Github PK

View Code? Open in Web Editor NEW
6.0 6.0 4.0 9.43 MB

Strategic Dashboard supporting decision-makers managing Quality Requirements, the RESTful API documentation is available at the next URL

Home Page: https://q-rapids.github.io/qrapids-dashboard/

License: Apache License 2.0

Java 38.46% CSS 0.30% JavaScript 54.91% HTML 6.34%
assessments dashboard data-visualization forecasting quality quality-assurance quality-requirements what-if-analysis

qrapids-dashboard's Introduction

Q-Rapids: Quality-aware rapid software development

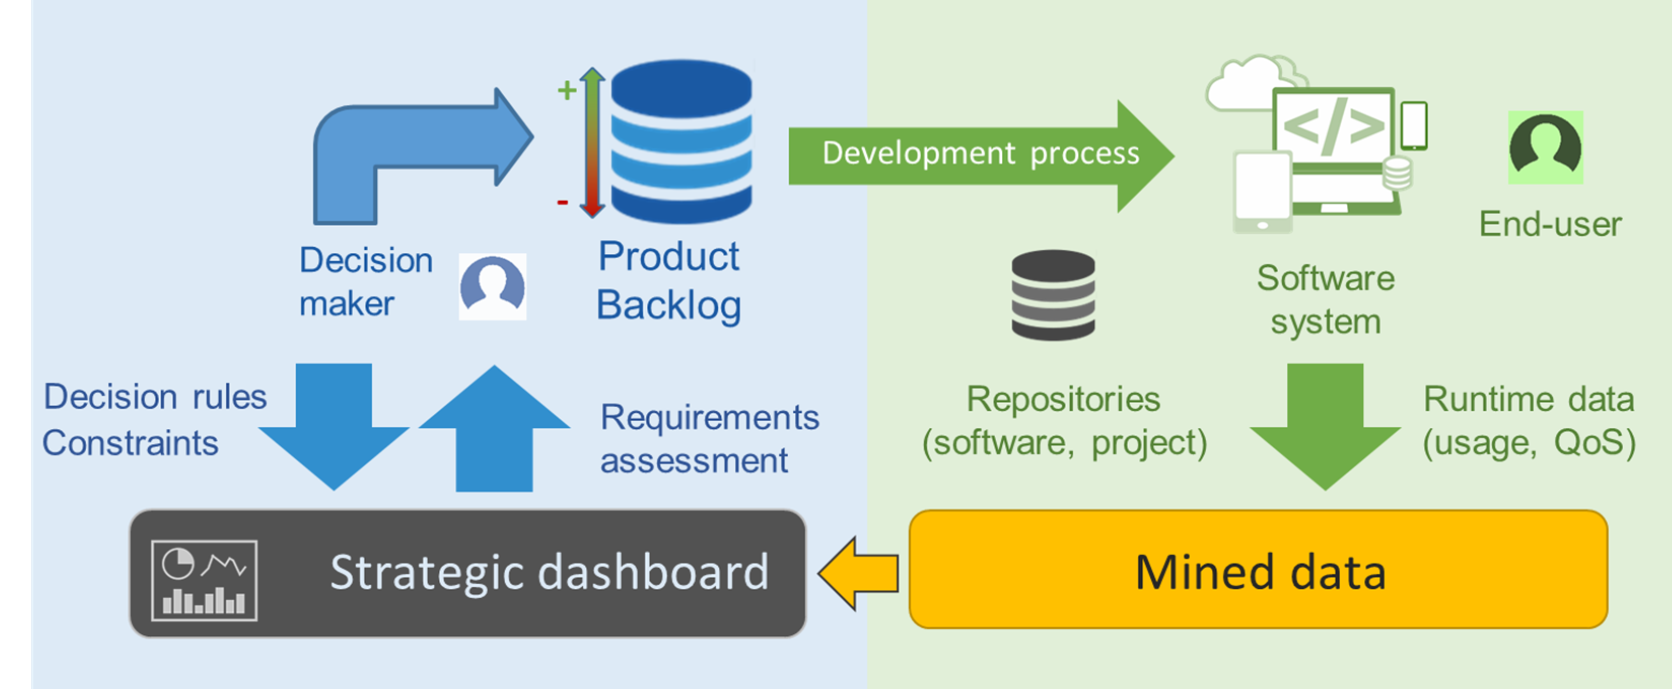
Repository with general information about Q-Rapids H2020 project and the software components produced. The aim of the project is produce an evidence-based, data-driven quality-aware rapid software development method where quality requirements are incrementally elicited, refined and improved based on data gathered from software repositories, management tools, system usage and quality of service. This data is analysed and aggregated into quality-related strategic indicators which are presented in a highly informative dashboard.

This project has received funding from the European Union’s Horizon 2020 research and innovation programme under grant agreement No 732253.

Documentation

You can find all the information you need in this repository Wiki.

Consortium

Q-Rapids consortium consists of seven organisations from five countries.

Components

Repository Name Description Lead Organization
qrapids-dashboard Q-Rapids Strategic Dashboard A dashboard for visualizing the quality of the company's products. This strategic dashboard is complemented with some specific features to support decision-makers managing quality requirements. UPC
qrapids-forecast Q-Rapids Forecasting A library that provides forecasting for metrics and factors that are used to assess quality of the company's products. UPC
qrapids-forecast-rest Q-Rapids Forecasting RESTful services RESTful services that provides forecasting for metrics and factors that are used to assess quality of the company's products. This component integrates the qrapids-forecast and it is used by the qrapids-dashboard. UPC
qrapids-forecast-R_script Forecasting R script This repository contains an R script file complementing the forecasting techniques included by default in the qrapids-forecast repository. UPC
qrapids-si_assessment Q-Rapids Qualitative SI assessment A library that provides assessment for the strategic indicators using Bayesian Networks, strategic indicators are the higher level of indicators used to assess quality of the company's products. UPC
qrapids-si_assessment-rest Q-Rapids Qualitative SI assessment RESTful services RESTful services that provides qualitative assessment for the strategic indicators that are used to assess quality of the company's products. This component integrates the qrapids-si_assessment and it is used by the qrapids-dashboard. UPC
qrapids-qma-elastic Quality Model Assessment A library to read and write the assessment data from an Elasticsearch. This library is integrated in the qrapids-dashboard. UPC
qrapids-qr_generation Quality Requirements Generator A library that generates the quality requirements candidates. This library uses the external tool PABRE-WS for managing a quality requirement patterns catalogue. UPC
qrapids-connect Connectors Apache Kafka connectors for ingesting data from heterogeneous data sources. It includes an example of an Apache Kafka Connector that collects Issues and Measures from Sonarqube. Fraunhofer IESE
qrapids-eval Quality model tool support It defines a quality model by aggregating the raw data into metrics, and further on into factors. The quality model can be customised and/or replaced in different companies, working as a plug-in, allowing the creation of quality models based on expert knowledge or data mining analysis techniques. Fraunhofer IESE
qrapids-docker Docker deployment for Q-Rapids Tool This repository contains the script to compose the components images hosted in DockerHub to deploy the Q-Rapids Tool with some demo data. iTTi
qrapids-dashboard_demo-docker Docker deployment for deploying a dashboard demo This repository contains the needed files to deploy a docker with all the necessary to run a demo of the dashboard with some demo data. UPC

Note. You can find how these components are interacting each other in the Q-Rapids Tool Architecture wiki page.

Knowledge

Name Description URL Lead Organization
SDM Ontology Strategic Decision-Making ontology providing a common underlying language integrating the concepts to manage decisions and to handle strategic indicators SDM Ontology UPC
QR Patterns Catalogue Configuration Guidelines for the configuration of the QR patterns catalogue used for generating QRs How to configure the QR patterns catalogue UPC
QR Patterns Catalogue QR patterns catalogue used for generating QRs QR patterns catalogue UPC
SI Qualitative Assessment Configuration Guidelines for the creation of the assessment model for SI using Bayesian Netwoks (BN) How to configure a SI Assessment Model UPC
Quality Model Configuration Guidelines for the configuration of the Quality Model (SIs, Factors, Metrics) Quality Model Configuration Guidelines Fraunhofer
Data-driven Quality Model Scripts Exemplar R and Python scripts used during data analysis for data-driven quality models R and Python scripts for data-driven quality model example Fraunhofer
Quality Model factors and metrics Files used to configure factors and metrics defined in the Q-Rapids Quality Model Factors, Metrics Fraunhofer & UoO
Q-Rapids Process Development process to integrate the Q-Rapids tool for managing quality in ASD UoO

Contributing

See the Q-Rapids Contribution Guidelines here.

Glosary

Name Description
ASD Agile Software Development
QM Quality Model
QR Quality Requirement
SI Strategic Indicators

Note: Some of the icons used in the Q-Rapids space are comming from https://pixabay.com/

qrapids-dashboard's People

Contributors

aleixballetbo avatar aleixlinares avatar alejandravv avatar joansm0099 avatar lidix91 avatar

Stargazers

 avatar  avatar  avatar  avatar  avatar  avatar

Watchers

 avatar  avatar  avatar  avatar  avatar  avatar  avatar

qrapids-dashboard's Issues

Quality requirements with project_id and decision_rationale

We need to add the project_id and decision_rationale fields in the JSON of a new quality requirement to be inserted into the backlog. The JSON file will look like this (new fields in bold):

{
"issue_summary":"Ratio of fast unit tests should be at least 70%”,
"issue_description":"Ratio of fast unit tests (i.e. Unit tests that takes less than 5 minutes to execute) with respect to the total number of unit tests should be at least the given value in order to improve the testing status of the software system.”,
"issue_type":”Story",
"project_id": "Your backlog project ID (if it is set in the Q-Rapids Dashboard)",
"decision_rationale": "The rationale of the decision"

}

Add simulation for the generated QRs

The form needs to include the generated QR information and the user should be able to simulate the values for the different params included in the QR and take the decision of including or not including the concret QR (QR pattern + concrete values for the parameters)

qr-alert fails to post alerts to dashboard

When qr-alert script tries to post new alert to Q-Rapids/api/notifyAlert API returns response code 200 but POSTing fails. Returned message body shows that response code is 500.

If clause in alerts.js is not reached and error is not visible when running qr-alert.sh

}, function (error, response, body) {
        if(error) console.log(error);
        else console.log(JSON.stringify(serobj)+" set to " + configfile.notification_service)
        //iconsole.log(body);
        //console.log(response);
});

I have seen two different errors returned by the API with different factors/metrics/SIs:

  • could not execute statement; SQL [n/a]; nested exception is org.hibernate.exception.SQLGrammarException: could not execute statement
  • No enum constant qr.models.enumerations.Type.User Defined Rule

Example response:

<!DOCTYPE html>
<html lang="en" xmlns="http://www.w3.org/1999/xhtml">
<head>
    <meta charset="UTF-8" />
    <title>Q-Rapids</title>
    <link rel="stylesheet" href="/Q-Rapids/css/bootstrap.min.css" />
    <link rel="stylesheet" href="/Q-Rapids/css/styles.css" />
    <link rel="stylesheet" href="/Q-Rapids/css/auth/auth.css" />
    <link rel="shortcut icon" type="image/x-icon" href="/Q-Rapids/favicon.ico" />
    <script type="text/javascript" src="/Q-Rapids/js/lib/moment.js"></script>
    <script type="text/javascript" src="/Q-Rapids/js/lib/Chart.min.js"></script>
    <script type="text/javascript" src="/Q-Rapids/js/lib/angular.min.js"></script>
    <script type="text/javascript" src="/Q-Rapids/js/app/app.services.js"></script>
    <script type="text/javascript" src="/Q-Rapids/js/lib/jquery.min.js"></script>
    <!-- Latest compiled and minified JavaScript -->
    <script src="/Q-Rapids/js/bootstrap.min.js"></script>
    <script type="text/javascript" src="/Q-Rapids/js/lib/sockjs.min.js"></script>
    <script type="text/javascript" src="/Q-Rapids/js/lib/stomp.min.js"></script>
    <link rel="stylesheet" href="/Q-Rapids/css/animate.css" />
    <script type="text/javascript" src="/Q-Rapids/js/lib/bootstrap-notify.min.js"></script>
    <script type="text/javascript" src="/Q-Rapids/js/notificationsHandler.js"></script>
</head>
<body>
<section id="error-control">
    <div class="row">
        <div class="col-xs-12 col-sm-12 col-lg-12" style="display: flex; align-items: center; justify-content: center; height: 80vh; width: 100%; flex-flow: column;">
            <div class="row">
                <div class="col-xs-12" style="margin-top: 10px; margin-left: 10px;">
                    <h2 class="title" style="color: #0177a6;">
                        <img class="container" src="/Q-Rapids/icons/qrapids.png" alt="qrapids logo" />
                        Q-Rapids: Quality-aware rapid software development
                    </h2>
                </div>
            </div>
            <h3 style="color: brown">
                URL <span>/error</span>
                Status: <span>500</span>
                <span style="color: #000;">could not execute statement; SQL [n/a]; nested exception is org.hibernate.exception.SQLGrammarException: could not execute statement</span>
            </h3>
        </div>
    </div>
</section>
</body>
</html>

Traceability Alerts --> Assessment

In the screen of Alerts, at field name, add a link to the historic assessment of the element of the alert. The dates should be from the day of the alert until today.

Problem in Metrics View

There is some problem in the metrics view. It seems that when one metric has a NaN value, the rest of the metrics are not visualized.

For example, project best, in the graphical view you can see 4 metrics, the last one with an exclamation instead of a needle (this happens when you visualise a NaN). In the historical data view, for this metric there is no chart

Add simulation at level of metrics

The form should be similar to the simulation at level of factors, the user should be able to set up values for the metrics, and visualize the impact on factors (using radar charts) and strategic indicators (using gauge charts)

integrate user management in the dashboard

We need to integrate the code provided in December 2017, the part related to having users and use the user information in the corresponding tables to know who decided what

Estimated Effort: 16 hours

visualize some warning when the strategic indicator assessment can have some problems

We need to visualize the quality of the strategic indicator (Strategic Indicators and Detailed Strategic Indicators views):

  • Include in the assessment data from the index (to see if the computation is up-to-date), we can show this date at the bottom
  • Add a warning mark + tooltip for explanation in the following situations:
  1. The date assessment is old compared to TODAY (show how many days)
  2. Some factor is missing in the computation (the list of missing factors)
  3. The date of the assessment of the factors is not the same than the indicator assessment (comparing the SI
  • include the assessment data to the textual view (first column)
  • include a new column (at the right) with the Warning explanation

Rearrange menu

Using a 2-level menu, the main options are: Assessment, Prediction, Simulation, and Alerts

integrating new forecasting API

The new forecasting technique include explicitly the creation of the prediction model (to be call in the assessStrategicIndicators)

Estimated Effort: 8 hours

Product portfolio

integrating product porfolio features:

  • Product Porfolio management
  • Product Assessment visualization

Estimated Effort: 20 hours

Quality Model View does not show the elements consistently

We have assessment for strategic indicators, factors and metrics (relations stored in relation index) but the Quality Model view only show the relation betwen strategic indicators and factors, but is not showing the relation between factors and metrics.

Strategic Indicators are not calculated

Component : qr-dashboard
Version : v0.3.2

The strategic indicators are not calculated since the deployment of the last version of qr-dashboard.

An error is return by the REST Service used to trig the calculation

http://ip:8080/qr-dashboard/api/assessStrategicIndicators?prj=modelio_ng&from=25-03-2019

URL /error Status: 400 I/O error on GET request for "http://localhost:8081/api/Train": Connexion refusée (Connection refused); nested exception is java.net.ConnectException: Connexion refusée (Connection refused)

http://ip:8080/qr-dashboard/api/assessStrategicIndicators
URL /error Status: 400 I/O error on GET request for "http://localhost:8081/api/Train": Connexion refusée (Connection refused); nested exception is java.net.ConnectException: Connexion refusée (Connection refused)

Integrate user group management

We need to integrate the code provided in December 2017, the part related to having user groups.
The users belong to user groups, and the user groups have access to the different features of the tool (filtering URLs)

To be implemented after issue #5

Dashboard historical visualisation (HistoricChart) fails to display the information box inside the chart completely.

When the overlay is used, the overlaying display box does not always locate itself inside the field,
which is used in displaying the metric. The box is drawn either completely or partly.
The issue exists with every line or limits only to one line inside the chart.
The current view does not have the issue by reporter's knowledge. If the current view has the issue,
this issue should be edited.

Edited picture of the issue as an attachment.

Estimation: max 2h

historical_chart_bug_grayscale

Traceability QR --> Alert

In the screen of Requirements, enable to visualize the alert (e.g. with a small screen visualizing the details of the alert).

show milestones related information

qrapids-backlog provides the list of milestones, try to integrate this information in the dashboard.

  • Add something in the Strategic Indicators view (concrete area, some non-modal view, something like a post-it) with a message like "<number_of_days> days for the next <milestone_type>: <milestone_description>
  • Add the info in the strategic indicators form (configuration). A readonly list/table of <milestone_date>, <milestone_type>, and <milestone_description>
  • Create a "testing" restful services retoring some fake data for testing

Add a hierarchical quality model view in the assessment option

We need a view where the elements are shown in a hierarchical way. Strategic Indicators linked to the Factors impacting on them, and factors linked to the Metrics used to computed them.

This view should include the current assessment of the elements and the weights in the links to make explicit the importance of each element in the computation of the one just avobe.

  • Materialise the strategic indicators computation in the relation.XXX index in elastic
  • The view should use index relation.XXX as a source for the visualization

Recommend Projects

  • React photo React

    A declarative, efficient, and flexible JavaScript library for building user interfaces.

  • Vue.js photo Vue.js

    🖖 Vue.js is a progressive, incrementally-adoptable JavaScript framework for building UI on the web.

  • Typescript photo Typescript

    TypeScript is a superset of JavaScript that compiles to clean JavaScript output.

  • TensorFlow photo TensorFlow

    An Open Source Machine Learning Framework for Everyone

  • Django photo Django

    The Web framework for perfectionists with deadlines.

  • D3 photo D3

    Bring data to life with SVG, Canvas and HTML. 📊📈🎉

Recommend Topics

  • javascript

    JavaScript (JS) is a lightweight interpreted programming language with first-class functions.

  • web

    Some thing interesting about web. New door for the world.

  • server

    A server is a program made to process requests and deliver data to clients.

  • Machine learning

    Machine learning is a way of modeling and interpreting data that allows a piece of software to respond intelligently.

  • Game

    Some thing interesting about game, make everyone happy.

Recommend Org

  • Facebook photo Facebook

    We are working to build community through open source technology. NB: members must have two-factor auth.

  • Microsoft photo Microsoft

    Open source projects and samples from Microsoft.

  • Google photo Google

    Google ❤️ Open Source for everyone.

  • D3 photo D3

    Data-Driven Documents codes.