Git Product home page Git Product logo

bsims's Introduction

bSims: Bird Point Count Simulator

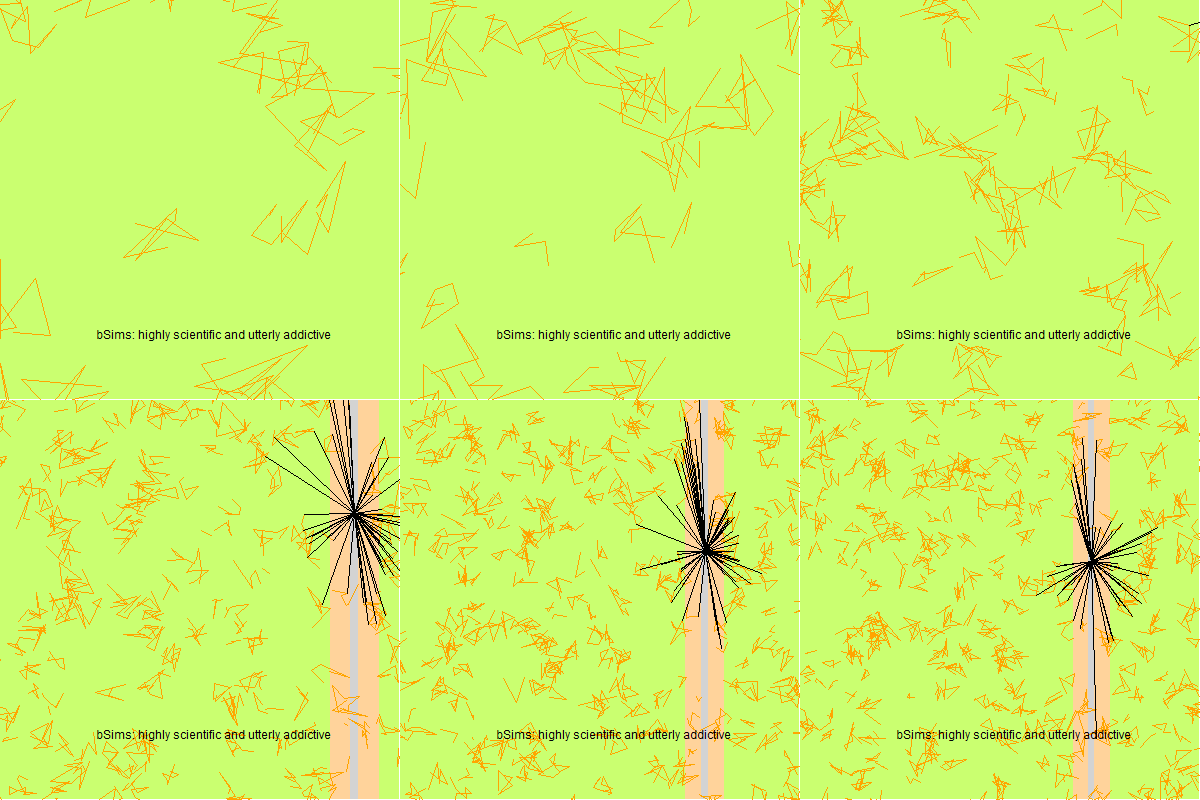
A highly scientific and utterly addictive bird point count simulator to test statistical assumptions and to aid survey design.

CRAN version CRAN RStudio mirror downloads check

“I’ve yet to see any problem, however complicated, which when you looked at it the right way didn’t become still more complicated.” – Poul Anderson, Call Me Joe

“Love the simulation we’re dreaming in” - Dua Lipa, Physical

The goal of the package is to:

  • test statistical assumptions,
  • aid survey design,
  • and have fun while doing it!

Design objectives:

  • small (point count) scale implementation,
  • habitat is considered homogeneous except for edge effects,
  • realistic but efficient implementation of biological mechanisms and observation process,
  • defaults chosen to reflect common practice and assumptions,
  • extensible (PRs are welcome).

See the package in action in the QPAD Book.

Check out the QPAD workshop.

Read/cite the paper Agent-based simulations improve abundance estimation (DOI 10.1007/s42977-023-00183-2).

Install

CRAN version:

install.packages("bSims")

Development version:

remotes::install_github("psolymos/bSims")

See what is new in the NEWS file.

License

GPL-2

Please cite (see citation("bSims")) the paper:

Solymos, P. 2023. Agent-based simulations improve abundance estimation. Biologia Futura 74, 377–392 DOI 10.1007/s42977-023-00183-2, link to PDF.

Contributing

Feedback and contributions are welcome:

  • submit feature request or report issues here,
  • fork the project and submit pull request, see CoC.

Examples

Command line

library(bSims)

phi <- 0.5
tau <- 1:3
dur <- 10
rbr <- c(0.5, 1, 1.5, Inf)
tbr <- c(3, 5, 10)

l <- bsims_init(10, 0.5, 1)
p <- bsims_populate(l, 1)
a <- bsims_animate(p, vocal_rate=phi, duration=dur)
o <- bsims_detect(a, tau=tau)

x <- bsims_transcribe(o, tint=tbr, rint=rbr)

get_table(x)
#>          0-3min 3-5min 5-10min
#> 0-50m         2      0       0
#> 50-100m       3      0       1
#> 100-150m      4      1       0
#> 150+m         8      3       0
head(get_events(a))
#>            x          y          t v   a  i
#> 1  4.6025783 -3.3454607 0.02565467 1 302 99
#> 2 -0.7210853 -1.4680273 0.03151759 1 190 43
#> 3 -2.7191418  1.6200508 0.03152603 1  78  7
#> 4 -2.1041934 -1.6092706 0.03936096 1 295 19
#> 5 -4.9531338 -0.4093427 0.04890537 1 217 11
#> 6 -3.3127196 -0.2145475 0.08899310 1 215 15
head(get_detections(o))
#>             x           y          t v   a         d  f  i  j
#> 2  -0.7210853 -1.46802728 0.03151759 1 190 1.6355636 NA 43 43
#> 8  -0.7210853 -1.46802728 0.11174961 1 323 1.6355636 NA 43 43
#> 13  0.5770644 -0.47429169 0.17337408 1 152 0.7469645 NA 62 62
#> 17 -1.3566956 -0.44725546 0.20776472 1 213 1.4285169 NA 38 38
#> 25  0.5355406 -3.24873232 0.42514210 1 330 3.2925773 NA 63 63
#> 29  0.9538955  0.07641822 0.48471447 1 160 0.9569516 NA 56 56

Shiny apps

A few Shiny apps come with the package. These can be used to interactively explore the effects of different settings.

Compare distance functions:

run_app("distfunH")
run_app("distfunHER")

Compare simulation settings for single landscape:

run_app("bsimsH")
run_app("bsimsHER")

Replicating simulations

Interactive sessions can be used to explore different settings. Settings can be copied from the Shiny apps and replicated using the bsims_all function:

b <- bsims_all(extent=5, road=1, density=c(1,1,0))
b
#> bSims wrapper object with settings:
#>   extent : 5
#>   road   : 1
#>   density: 1, 1, 0

The object has handy methods:

b$settings()      # retrieve settings
b$new()           # replicate once
b$replicate(10)   # replicate 10x

The $replicate() function also runs on multiple cores:

library(parallel)
b <- bsims_all(density=0.5)
B <- 4  # number of runs
nc <- 2 # number of cores

## sequential
system.time(bb <- b$replicate(B, cl=NULL))
#>    user  system elapsed 
#>   0.232   0.001   0.233
## parallel clusters
cl <- makeCluster(nc)
## note: loading the package is optional
system.time(clusterEvalQ(cl, library(bSims)))
#>    user  system elapsed 
#>   0.000   0.000   0.439
system.time(bb <- b$replicate(B, cl=cl))
#>    user  system elapsed 
#>   0.004   0.001   0.194
stopCluster(cl)

## parallel forking
if (.Platform$OS.type != "windows") {
  system.time(bb <- b$replicate(B, cl=nc))
}
#>    user  system elapsed 
#>   0.119   0.046   0.182
bsims's People

Contributors

psolymos avatar

Stargazers

 avatar  avatar  avatar  avatar

Watchers

 avatar

Forkers

farcego

bsims's Issues

Fuzzy individual clustering

Observed might perceive same individual as multiple ones, and multiple individuals as the same, depending on the spatial distinctness (clustering) of detection events.

One such implementation is using ADPclust:

## fit ADP clustering
library(ADPclust)
## get coords
xy <- do.call(rbind, lapply(1:length(x$events), function(i) {
  cbind(x$events[[i]]$x+x$nests$x[i],x$events[[i]]$y+x$nests$y[i])
}))
## get individual id
i <- do.call(c, lapply(1:length(x$events), function(i)
  rep(i, nrow(x$events[[i]]))))
ad <- adpclust(xy, dmethod = "euclidean")
## number of clusters found
ad$nclust
## classification
tab <- table(inds=i, clust=ad$clusters)

Develop broader simulation framework

It is fine to use a mix of CLI/Shiny to make a bsims_all container object and run many realizations under same settings.

  • Provide print method for bsims_all containers
  • Provide wrapper that interpolates argument values based on a list of values (i.e. single gradient) or over a data frame (a set of value combos)
  • Provide option (function) that gives metric of interest (bias etc) that can be calculated over the sets.

Write tutorial/vignette to the package

Topics:

  • Homogeneous landscape, single realization (take biostat + QPAD book material)
  • Stratified landscape, single realization (needs to be developed)
  • Multiple realizations (QPAD & MV framework for estimation; needs to be developed)

Add multiple-visit transcription

This would mean to restart counting for each time interval. See qpad-book for implementation (?). Likely we need to isolate counting parts of code to share among transcription options.

Rethink observer avoidance

Response can be positive, and negative response is also more gradual than currently implemented.

Suggest to remove this option (it is really just a filter applied on the events depending on distance to observer).

A hack can be described as extension, i.e. how to further manipulate objects, but it might be too involved for folks without knowledge of the internals (i.e. that events are in a list of tables, and not in a tidy stacked data frame).

Inheritance and methods cleanup

Layer functions should have nested inheritance, get_events, get_detections, get_table should work accordingly.

Add new getters for all user action that would otherwise require knowing the internals:

  • get_abund: get total N
  • get_dens: get avg D=N/A
  • get_area: get total A
  • get_nests: nest locations

Eject settings from Shiny app

Semi-interactive workflow when comparing different options:

  1. use Shiny GUI to explore different options
  2. eject settings from GUI
  3. import different settings
  4. run and replicate simulations under each setting using a wrapper

Wrapper design:

  • 1st arg as (1) bsims object (those settings fixed), (2) settings object as ejected by GUI, or (3) individual arguments
  • use formals to match inputs with bsims_* args
  • return a closure with accessible settings object (object$settings()) and a simulate method (object$run()).

This closure object can be used to be called multiple times for replication like replicate(B, object$run()).

Not quite clear what to store as output (i.e. just table output? -- there is so much more, so maybe this should be left open).

Why is this important?

Because this is how we can make meaningful comparisons.

Rolling list of small things to fix

Default settings with bsims_all should print better:

bi=bsims_all()

r$> bi
bSims wrapper object with settings:
Warning message:
In max(n) : no non-missing arguments to max; returning -Inf

Use user provided nest locations

Should allow for user provided nest locations. It can be a coercion method that would turn a 2-column matrix or data frame or list into a bsism_population object. Other argument can be a landscape object (use defaults when missing).

Use cases:

  • use real territory mapping
  • use fine scale habitat info (rasters, polygons) to determine nest locations, assuming that these fine scale differences do not impact behavior and observation layers

Recommend Projects

  • React photo React

    A declarative, efficient, and flexible JavaScript library for building user interfaces.

  • Vue.js photo Vue.js

    🖖 Vue.js is a progressive, incrementally-adoptable JavaScript framework for building UI on the web.

  • Typescript photo Typescript

    TypeScript is a superset of JavaScript that compiles to clean JavaScript output.

  • TensorFlow photo TensorFlow

    An Open Source Machine Learning Framework for Everyone

  • Django photo Django

    The Web framework for perfectionists with deadlines.

  • D3 photo D3

    Bring data to life with SVG, Canvas and HTML. 📊📈🎉

Recommend Topics

  • javascript

    JavaScript (JS) is a lightweight interpreted programming language with first-class functions.

  • web

    Some thing interesting about web. New door for the world.

  • server

    A server is a program made to process requests and deliver data to clients.

  • Machine learning

    Machine learning is a way of modeling and interpreting data that allows a piece of software to respond intelligently.

  • Game

    Some thing interesting about game, make everyone happy.

Recommend Org

  • Facebook photo Facebook

    We are working to build community through open source technology. NB: members must have two-factor auth.

  • Microsoft photo Microsoft

    Open source projects and samples from Microsoft.

  • Google photo Google

    Google ❤️ Open Source for everyone.

  • D3 photo D3

    Data-Driven Documents codes.