mozaik-ext-analytics
Module provides some Google Analytics widgets for Mozaïk dashboard.
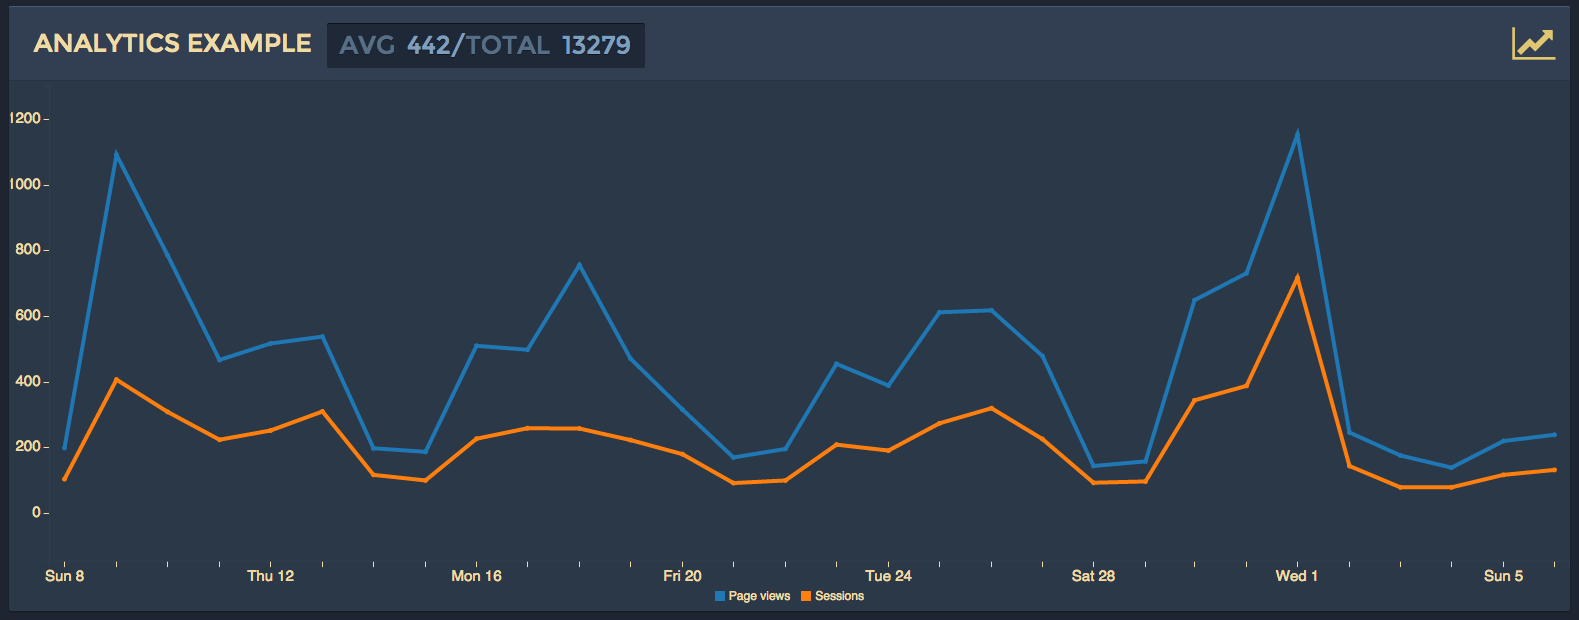
Table of contents
Setup
Follow the steps to install and configure widget into dashboard
Dependencies
-
Install modules from npmjs:
npm install -S mozaik-ext-analytics
-
Register client api by adding to dashboard
app.js:import analytics from 'mozaik-ext-analytics/client'; mozaik.bus.registerApi('analytics', analytics;
-
Register widgets by adding to dashboard
src/App.jsx:import analytics from 'mozaik-ext-analytics'; mozaik.addBatch('analytics', analytics);
-
(Re)build the dashboard:
npm run build-assets
-
Configure widgets (see Widgets -section)
-
Start dashboard:
node app.js
Google Analytics
-
Login to Developers Console: https://console.developers.google.com/ (register Google account if you don't already have one)
-
Create new project
dashboard(or similar) -
Enable following
Analytics APIfrom permissions -
Create Service account under Credentials: Create new Client ID -> Service account -> Download mozaik-ext-analytics.p12 file
-
Convert .p12 file into .pem format with command:
openssl pkcs12 -in mozaik-ext-analytics*.p12 -nodes -nocerts > mozaik-ext-analytics.pem
The password for .p12 file is
notasecret -
Authorize service user to acces analytics property in question by adding the service email address via User Management
-
Configure service auth details in dashboard root file:
.env(or as environment variables):GOOGLE_SERVICE_EMAIL=generated-by-google-console@developer.gserviceaccount.com # one of the following: GOOGLE_SERVICE_KEY=abcdef123456... GOOGLE_SERVICE_KEYPATH=mozaik-ext-analytics.pemAlternatively use
exportcommand to set environment variables. -
Run command line app to retrieve ids (or see them from analytics - see references):
node node_modules/mozaik-ext-analytics/cli.js
OR
- Navigate to Analytics api explorer
- Authorize request from OAuth 2.0 button in top-right corner
- Select the wanted id from wanted
profiles[n].idfield
Widgets
Set api and wiget configuration values in dashboard config.js.
See followup section for details.
module.exports = {
  // Configure api
  api: {
    analytics: {
      // NOTE: Either key or key path needs to be provided
      googleServiceEmail: process.env.GOOGLE_SERVICE_EMAIL,
      googleServiceKey: process.env.GOOGLE_SERVICE_KEY
      googleServiceKeypath: process.env.GOOGLE_SERVICE_KEYPATH
    },
    // Other services ...
  },

  // Set widgets
  dashboards: [
    columns: 2,
    rows: 2,
    // See next sections for details
    widgets: [
      {
        type: 'analytics.page_views',
        id: '123123123',
        startDate: '30daysAgo',
        columns: 2, rows: 2,
        x: 0, y: 0
      }
    ]
  ]
}
Finally, start the dashboard with command:
node app.jsWidget: analytics.page_views
Show the number of page views as a timeseries
parameters
| key | required | description |
|---|---|---|
id |
yes | Id of the analytics data to show. See setup steps or analytics view for more info. Example: 1231234321 |
startDate |
no | Starting date info used in Analytics. Example/default: '30daysAgo' |
endDate |
no | End date info used in Analytics. Example/default: 'yesterday' |
title |
no | Textual title to show. Example: 'My website'. |
usage
{
  type: 'analytics.page_views',
  id: '123123123',
  startDate: '30daysAgo',
  columns: 2, rows: 1,
  x: 1, y: 0
}
Widget: analytics.top_pages
Show list of pages, in order of most visits within given time range.
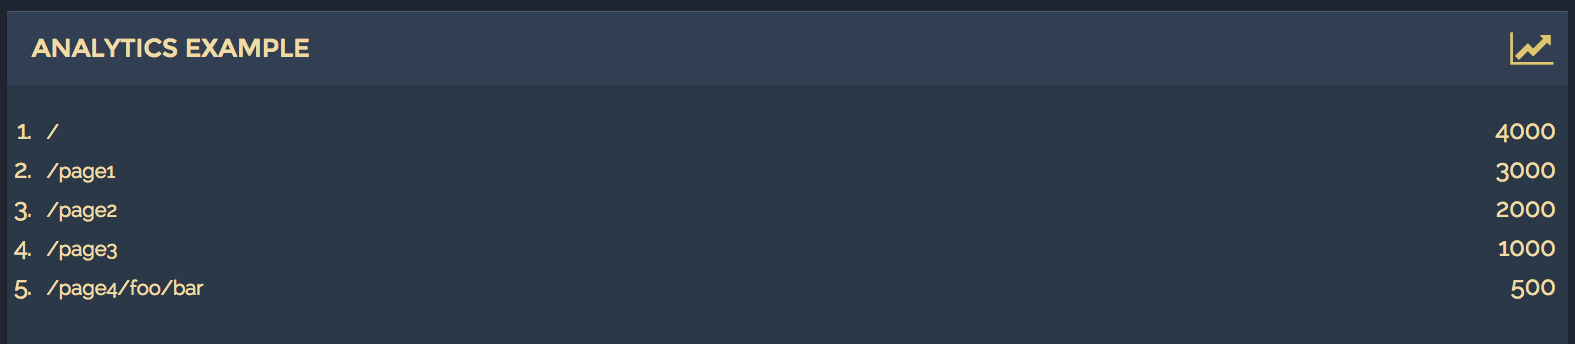
parameters
| key | required | description |
|---|---|---|
id |
yes | Id of the analytics data to show. See setup steps or analytics view for more info. Example: 1231234321 |
dimensions |
no | The dimensions and metrics explorer lists and describes all the dimensions and metrics available through the Core Reporting API. Use this reference API : Example: ga:pageTitle |
startDate |
no | Starting date info used in Analytics. Example/default: '30daysAgo' |
endDate |
no | End date info used in Analytics. Example/default: 'yesterday' |
title |
no | Textual title to show. Example: 'My website'. |
usage
{
  type: 'analytics.top_pages',
  id: '123123123',
  startDate: '30daysAgo',
  columns: 2, rows: 1,
  x: 1, y: 0
}
License
Distributed under the MIT license
Credit
The module is backed by SC5


