Git Product home page Git Product logo

plotly.net's Introduction

Build and test Discord DOI

Table of contents

What is Plotly.NET?

Plotly.NET is an Interactive charting library for .NET programming languages 📈🚀.

It is built on top of plotly.js and provides several API layers for creating, styling and rendering ✨beautiful data visualizations✨.

To get a deep-dive into the rationale behind the design choices of Plotly.NET, check out our F1000Research paper!

In short, Plotly.NET consists of multiple API layers and packages:

  • Plotly.NET - The core API is written in F# and provides multiple API layers to create and style charts - from the high-level, type-safe Chart API to low-level direct chart object manipulation. It is the foundation for all other packages.

  • Plotly.NET.Interactive - This package provides interactive formatting extensions for .NET interactive notebooks.

  • Plotly.NET.ImageExport - This package provides extensions for Plotly.NET to render charts as static images programmatically.

  • Plotly.NET.CSharp - This package provides an idiomatic C# API. Note that you can use the core API in C#, this package just removes some friction at some places.

Installation

You can get all Plotly.NET packages via nuget:

Package Name Nuget
Plotly.NET
Plotly.NET.Interactive
Plotly.NET.ImageExport
Plotly.NET.CSharp

Documentation

Quick starts

F#

In F# projects, just add the Plotly.NET package to your project and you are ready to go!

📖 Polyglot Notebook 📖 Quick start

To enable Plotly.NET in a polyglot notebook, reference the Plotly.NET.Interactive package:

#r "nuget: Plotly.NET.Interactive"

To display a chart, just end a F# cell with it:

open Plotly.NET

Chart.Point(
    x = [0 .. 10],
    y = [0 .. 10]
)
|> Chart.withTitle "Hello World!"

notebook quichstart in F#

.fsx Scripting quickstart

To enable Plotly.NET in a .fsx script, reference the Plotly.NET package:

#r "nuget: Plotly.NET"

To display a chart in your browser, use the Chart.show function:

open Plotly.NET

Chart.Point(
    x = [0 .. 10],
    y = [0 .. 10]
)
|> Chart.withTitle "Hello World!"
|> Chart.show

C#

In C# projects, just add the Plotly.NET.CSharp package to your project and you are ready to go!

📖 Polyglot Notebook 📖 Quick start

To enable Plotly.NET in a polyglot notebook for C#, reference the Plotly.NET.Interactive and Plotly.NET.CSharp packages:

#r "nuget: Plotly.NET.Interactive"
#r "nuget: Plotly.NET.CSharp"

To display a chart, just end a C# cell with it:

using Plotly.NET.CSharp;

Chart.Point<int, int, string>(
    x: Enumerable.Range(0,11),
    y: Enumerable.Range(0,11)
)

notebook quichstart in C#

Samples and tutorials

You can find extensive documentation with samples and tutorials of the core Plotly.NET library 📖 here.

Full library reference

The API reference for all packages is available 📚 here

The documentation for this library is automatically generated (using FSharp.Formatting) from *.fsx and *.md files in the docs folder. If you find a typo, please submit a pull request!

Development

Note: The release and prerelease build targets assume that there is a NUGET_KEY environment variable that contains a valid Nuget.org API key.

build

Check the build project to take a look at the build targets. Here are some examples:

# Windows

# Build only
./build.cmd

# Full release buildchain: build, test, pack, build the docs, push a git tag, publish the nuget package, release the docs
./build.cmd release

# The same for prerelease versions:
./build.cmd prerelease


# Linux/mac

# Build only
build.sh

# Full release buildchain: build, test, pack, build the docs, push a git tag, publísh the nuget package, release the docs
build.sh release

# The same for prerelease versions:
build.sh prerelease

running and writing tests

please refer to the detailed readme in the tests folder

docs

The docs are contained in .fsx and .md files in the docs folder. To develop docs on a local server with hot reload, run the following in the root of the project:

# Windows
./build.cmd watchdocs

# Linux/mac
./build.sh watchdocs

Contributors

Plotly.NET is a community maintained open source project. Big thanks to all contributors!

Library license

The library is available under the MIT license.

FAQ

Why are there two separate packages for C# and F#?

These packages are not separate, Plotly.NET.CSharp is built on top of Plotly.NET.

Plotly.NET (written in F#) is the main project. It is designed with interoperability in mind, and it is possible to use it from C#.

Over the years, some friction between F# and C# have surfaced that cannot be overcome in the F# codebase. For more info, take a look at this issue where we discuss the topic: #285

The Plotly.NET.CSharp package (written in C#, using the F# API internally) is a thin wrapper around the core API. It is not necessary to use it, but it can make the API more idiomatic and ergonomic for C# users.

Can I use Plotly.NET in [insert your UI library here]?

It depends. Plotly.NET creates JSON for consumption by the plotly.js library. The actual rendering is done by plotly.js, in an environment where javascript can be run.

This means that your UI libs needs some way of displaying html and executing javascript to be compatible with Plotly.NET. That is true for most UI libs though, here for example is a POC for Blazor.

For Windows Forms and WPF you could use a WebView control to display the charts.

You could also use Plotly.NET.ImageExport in your backend to create static images of your charts and serve those in your UI.

plotly.net's People

Contributors

bvenn avatar caroott avatar chausner avatar dlfelps avatar dobretzberger avatar eerhardt avatar flippievandyk avatar forki avatar fwaris avatar hdavid333 avatar hlweil avatar integerman avatar jakeradmsft avatar kkkmail avatar kmutagene avatar luisquintanilla avatar mmagueta avatar muehlhaus avatar nhirschey avatar peter-b- avatar pirrmann avatar smoothdeveloper avatar striezel avatar walternative avatar whiteblackgoose avatar

Stargazers

 avatar  avatar  avatar  avatar  avatar  avatar  avatar  avatar  avatar  avatar  avatar  avatar  avatar  avatar  avatar  avatar  avatar  avatar  avatar  avatar  avatar  avatar  avatar  avatar  avatar  avatar  avatar  avatar  avatar  avatar  avatar  avatar  avatar  avatar  avatar  avatar  avatar  avatar  avatar  avatar  avatar  avatar  avatar  avatar  avatar  avatar  avatar  avatar  avatar  avatar  avatar  avatar  avatar  avatar  avatar  avatar  avatar  avatar  avatar  avatar  avatar  avatar  avatar  avatar  avatar  avatar  avatar  avatar  avatar  avatar  avatar  avatar  avatar  avatar  avatar  avatar  avatar  avatar  avatar  avatar  avatar  avatar  avatar  avatar  avatar  avatar  avatar  avatar  avatar  avatar  avatar  avatar  avatar  avatar  avatar  avatar  avatar  avatar  avatar  avatar

Watchers

 avatar  avatar  avatar  avatar  avatar  avatar  avatar  avatar  avatar  avatar  avatar  avatar  avatar  avatar  avatar  avatar  avatar  avatar  avatar  avatar  avatar  avatar  avatar  avatar  avatar  avatar  avatar  avatar  avatar  avatar  avatar  avatar  avatar  avatar  avatar  avatar  avatar

plotly.net's Issues

Scatter3d with StyleOption.Mode.Lines produces no output

Description

I try to use Scatter3d to plot 3d wireframes:

// baseline markers only that is working:
open FSharp.Plotly
let x = [19; 26; 55;]
let y = [19; 26; 55;]
let z = [19; 26; 55;]

Chart.Scatter3d(x,y,z,StyleOption.Mode.Markers, Color="rgba(127,127,127)", Dash = StyleOption.DrawingStyle.Solid, Width=4)
|> Chart.withX_AxisStyle("my x-axis")
|> Chart.withY_AxisStyle("my y-axis")
|> Chart.withZ_AxisStyle("my z-axis")
|> Chart.withMarkerStyle(Size=4)
|> Chart.withSize(800.,800.)
|> Chart.Show

Changing StyleOption.Mode.Markers to StyleOption.Mode.Lines_Markers

The markers are now connected with solid grey lines as expected but
the axis labels and descriptions are gone.

Changing StyleOption.Mode.Markers to StyleOption.Mode.Lines

No output anymore, again the axis labels and descriptions are gone.

What is wrong here?

Change legend position?

Description

How do I change the legend position? For instance, to put the legend below the chart in this sample? I can't see this documented anywhere.

Repro steps

open Plotly.NET 
  
let x = [1.; 2.; 3.; 4.; 5.; 6.; 7.; 8.; 9.; 10.; ]
let y = [2.; 1.5; 5.; 1.5; 3.; 2.5; 2.5; 1.5; 3.5; 1.]

let combinedChart = 
    [
        Chart.Line(x,y,Name="first")
        Chart.Line(y,x,Name="second")
    ]
    |> Chart.Combine

// has legend to the right of the chart. I'd like it below the chart.
combinedChart.Show

Documentation Site has mixed-content

Description

The documentation site has mixed-content, or better known as using http for fsdocs-default.css. This causes the page to not load css properly on browsers that prevent mixed sources from loading.

Repro steps

Expected behavior

Should load css

Actual behavior

Doesn't load css

Known workarounds

Please provide a description of any known workarounds.

Related information

Screen Shot 2021-01-19 at 1 16 48 PM
Screen Shot 2021-01-19 at 1 16 41 PM

Create different Chart Types in C#

Hi there,

I am able to create different point charts in C# with Plotly. As soon as I choose a different chart type like Line, the implementation fails. It makes no difference whether I only specify the two data sequences or the whole parameters that are not required.

Is this a known issue or am i missing something?

Increase verbosity of Markdown comments for hoverinfo of Chart functions

It seems like due to the Chart creating functions being static members of a class with optional arguments, the single parameters cannot be documented via markdown comments. Therefore, i would suggest we add a verbose description to the member itself that lists the key information about each argument for the chart.

Trace Diff log to plotly.js

Here is the current diff (via https://plotly.com/javascript/reference/) for trace types that are supported by this library (on a high abstraction level, theoretically we already support everything via DynObj). in the brackets ill add the even higher level functions that build on the trace type. Checkbox is checked if we support at least some abstraction:

You want to help? Here's a quick guide on how to implement a chart:

  • Take a look at this commit, which implements all the steps below: 3c6cd67
  • ideally leave a comment here so we dont have multiple ppl doing the same thing
  • go to the figure reference for your trace type
  • implement a trace styling function for your trace type in Trace.fs :
    • use <tracetype>.init
    • implement as many properties of the trace object as parameters for TraceStyle.[tracetype], but watch out if there are already TraceStyle abstractions in place. For example, the following properties are abstracted via TraceStyle.TextLabel:
      • Text
      • Textposition
      • Textfont: Font,
      • Textsrc
      • Textpositionsrc
    • when possible abstract things like enums as StyleParam.
  • implement a higher abstraction in Chart.fs as Chart.[tracetype] that uses TraceStyle.[tracetype] and any other usefull TraceStyle functions to set the needed parameters such as TraceStyle.TextLabel.
  • ideally leave a small poc script in Playground.fsx, or even better docs in docsrc/content
  • Thanks ❤️

Simple

  • Scatter (Scatter, Point, Line, Spline, Bubble, Range, Area, SplineArea, StackedArea)
  • Scatter GL (Scatter, Point, Line, Spline, Bubble)
  • Bar (Bar, StackedBar, Column, StackedColumn)
  • Pie (Pie, Doughnut)
  • Heatmap (Heatmap)
  • HeatMapGL
  • #189
  • Contour (Contour)
  • Table (Table)

Distributions

  • Box (BoxPlot)
  • Violin (Violin)
  • Histogram (Histogram)
  • Histogram 2D (Histogram2d)
  • Histogram 2D Contour (Histogram2dContour)

Finance

  • OHLC
  • Candlestick (Candlestick)
  • Waterfall
  • Funnel
  • Funnel Area
  • #206

3D

Maps

  • Scatter Geo(ScatterGeo, PointGeo, LineGeo)
  • Choropleth (Choropleth)
  • Scatter Mapbox (ScatterMapBox, PointMapBox, LineMapBox)
  • #91
  • #92

Specialized

Chart size

|> Chart.withSize (1200.0, 800.0)

does not set size in style:

it is always 600*600

Add example binder

Now that we have nice notebook formatter integration thanks to @WalternativE, i think we can try to put that feature more into focus, similar to what XPlot is doing.

@Joott as you already have experience with binder, could you give some insights on how to do that, or are you interested in taking care of setting up an example binder for this repo?

Apply consistent F# Style

Description

To ensure consistent F# style, the usage of underscores should be avoided (except for wildcards).

Examples:

  • Chart.WithX_Axis
  • Chart.WithX_AxisStyle
  • ...

How to use FSharp.Plotly from C#

It seems to me that ChartExtensions prevents FSharp.Plotly from being used in C#, that is unfortunate. Could this be opened up for C#?

Multiple Axis FIX not published to NUGET

The Nuget Dlls for FSharp.Plotly.dll doesn't contain the changes for the multiple axis. It should be compiled and republished.

I downloaded the git, compiled and tested. It works from the source code. Not from the Nuget Dll.

Thanks

.Net Interactive using Svg (or other static) images?

Description

I want to use pandoc to convert a f# .ipynb notebook containing Plotly.NET figures to pdf. However, the conversion does not show any figures in the pdf output. I think that the issue is that Plotly.NET.Interactive renders them using javascript that gets ignored by pandoc.

pandoc notebook.ipynb -o notebook.html works fine and includes figures. But pandoc notebook.ipynb -o notebook.pdf does not have any figures in it.

This resolved pandoc issue (jgm/pandoc#6430) suggests that the conversion should be fine in python notebooks using plotly.io.renderers.default = "svg".

Can we allow a similar option in Plotly.NET.Interactive? Pandoc interop is useful because .net interactive does not have a way to save the file as a pdf or html file.

Workarounds

A current workaround to get pdf output is to use pandoc to convert to html, then use the browser's save as pdf feature to product a pdf.

Roadmap for 2.0

Features that are needed for 2.0 to be considered feature complete are tracked here. Feel free to add suggestions/issues.

  • Improve usablity from C#: #52, #71 (we have to admit defeat and introduce a pure C# layer in 2.x +. F# constructs from C# are just awkward sometimes.)
  • Full Trace coverage (meaning full chart coverage): #42
  • Coverage for most if not all Layout Objects/Properties: #44
  • Improved markdown documentation for all Chart functions: #40
  • Unit tests for the core functionality: #51
  • Improve dotnet interactive integration See PR by @WalternativE
  • Add example dotnet interactive notebooks for docs
  • Add chart theme support: #14
  • Add functionality to render charts as images: #21
  • Use a dedicated color library
  • Move the project to .NET Core only (ditch the WPF project) (done: 40878d3)
  • Adapt the Chart type for better consumption across the plotly ecosystem (Dash, Kaleido, Plotly.js itself, etc.): #49
  • Unify casing in ChartAPIs #105

Range charts markers cannot be removed

Description

When working with Chart.Range you cannot remove the markers from the center trace. Adding ShowMarkers=false won't show an effect.

Repro steps

Chart.Range([1;2;3],[1;1;1],[0.5;0.75;0.5],[1.5;1.25;1.5],ShowMarkers=false) |> Chart.Show

Suggestion

In StyleParams in Line 143 upper case None must be changed to lower case none.

But I would suggest to add a mandatory mode argument to Chart.Range like it is in Chart.Scatter. Then the user has the choice to select the line/marker style.

If desired, I will provide a pull request with the mentioned changes.

Add Axis style templates

A huge chunk of styling the charts is applying styles to the axes. While depending on personal preferences, this is more or less the same process every time for the respective chart types. Adding a few templates can greatly reduce bulk styling work done on axes.

Name attribute has no impact ?

Setting the Name attribute seems to have no impact on the result. Is there a way to add a (visible) title to a chart ?

By the way, great work : FSharp.Plotly is my library of choice to plot informations in F# :)

.NET Interactive extension fails to load

Description

Updates in the .NET Interactive kernel extension packages broke the current interactive version.

Repro steps

  1. Create a new notebook with .NET Interactive (or open an old one)
  2. Reference Plotly.NET.Interactive, 2.0.0-beta7 (or lower)

Expected behavior

The interactive extension should load and display a message where it tells me, that it will handle charts.

Actual behavior

image

Known workarounds

Use an older version of .NET Interactive.

Related information

  • Operating system: Windows 10 20H2
  • Branch: loaded from NuGet (but reproducible in dev)
  • .NET Runtime, CoreCLR or Mono Version: NET5

Layout Diff log to plotly.js

Here is the current diff (via https://plotly.com/javascript/reference/#layout) for layout objects and properties that are supported by this library (on a high abstraction level, theoretically we already support everything via DynObj):

You want to help? Here's a quick guide on how to implement a layout object:

  • Take a look at this commit, which implements all the steps below: 18b5698
  • ideally leave a comment here so we dont have multiple ppl doing the same thing
  • go to the figure reference for your layout object
  • implement the object via the init/style pattern
  • when possible abstract things like enums as StyleParam.
  • where applicable, add a Chart.with... function to ChartExtensions.fs that applies the object styles to a given Chart layout.

Thanks ❤️

General Layout objects/Properties

Axes and Subplots

Layers

  • Annotations
  • Shapes
  • #190
  • #120
  • Update Menus

how to add title to x,y,z axises

I'm trying to find a way to add title to x/y/z axis but I find no luck, the document only mentions about the title of the plot not the axis. Thanks

Chart.Grid multiple bugs

Chart.Grid has, while being a great improvement over the old Chart.Stack, multiple things that need fixing:

  • Charts are added to the Grid in reverse order
  • Grid attributes dont work as expected (e.g. Roworder not changing anything)
  • Not truly any trace can be a subplot of this grid so far. Examples are Chart.Table or Chart.Histogramm2DContour. Most likely because the usual way of setting subplot domains does not work for these trace types.

Can't display images on MacOS

When trying to show an image:

heatmap |> Chart.ShowAsImage(ImageFormat.PNG)

I get the following exception (MacOS catalina):

System.ComponentModel.Win32Exception (13): Permission denied
   at System.Diagnostics.Process.ForkAndExecProcess(String filename, String[] argv, String[] envp, String cwd, Boolean redirectStdin, Boolean redirectStdout, Boolean redirectStderr, Boolean setCredentials, UInt32 userId, UInt32 groupId, UInt32[] groups, Int32& stdinFd, Int32& stdoutFd, Int32& stderrFd, Boolean usesTerminal, Boolean throwOnNoExec)
   at System.Diagnostics.Process.StartCore(ProcessStartInfo startInfo)
   at System.Diagnostics.Process.Start()
   at System.Diagnostics.Process.Start(ProcessStartInfo startInfo)
   at System.Diagnostics.Process.Start(String fileName)
   at FSharp.Plotly.ChartExtensions.Chart.ShowAsImage.Static(ImageFormat format, GenericChart ch)

I'm surprised to see a Win32Exception on MacOS as well.

Use static type annotations for Chart and Tracestyle methods and extensions

Related: #70

While leaving an optional parameter as 'A in F# works just fine, specific annotations for these parameters are mandatory in C# (see linked issue), making the Chart API hard to use in those cases where no type annotation is set in the source code.

Static type annotations solve this problem and should be set for the main API at least.

Shapes in Chart.Combine (and similar) are not combined

Description

Shapes in Chart.Combine (and similar) are not combined.

Repro steps

Chart.SingleStack ([
    Chart.Line(Array.init 100 (fun i -> i, float i * 2.5))
    |> Chart.withY_AxisStyle ("",Zeroline = false)
    |> Chart.withShapes [Shape.init(ShapeType = StyleParam.ShapeType.Line, X0 = 10, Y0 = 0., X1 = 10, Y1 = 200.)]
    Chart.Line(Array.init 100 (fun i -> i, float i * 2.5))
    |> Chart.withY_AxisStyle ("",Zeroline = false)
    |> Chart.withShapes [Shape.init(ShapeType = StyleParam.ShapeType.Line, X0 = 35, Y0 = 0., X1 = 35, Y1 = 200.)]
    Chart.Line(Array.init 100 (fun i -> i, float i * 2.5))
    |> Chart.withShapes [Shape.init(ShapeType = StyleParam.ShapeType.Line, X0 = 41, Y0 = 0., X1 = 41, Y1 = 200.)]
    ] |> List.rev, true)
|> Chart.withLayoutGridStyle(
    RowOrder = StyleParam.LayoutGridRowOrder.BottomToTop
)
|> Chart.Show

Expected behavior

A stacked plot consisting of 3 line plots. Each line plot should have a black vertical line at the respective given X0/X1-Position, ranging from Y-Values (Y0/Y1) 0 to 200.

Actual behavior

Only the first plot (since List.rev it's on the bottom) has the black vertical line.

Known workarounds

Chart.SingleStack ([
    Chart.Line(Array.init 100 (fun i -> i, float i * 2.5))
    |> Chart.withY_AxisStyle ("",Zeroline = false)
    Chart.Line(Array.init 100 (fun i -> i, float i * 2.5))
    |> Chart.withY_AxisStyle ("",Zeroline = false)
    Chart.Line(Array.init 100 (fun i -> i, float i * 2.5))
    ] |> List.rev, true)
|> Chart.withLayoutGridStyle(
    RowOrder = StyleParam.LayoutGridRowOrder.BottomToTop
)
|> Chart.withShapes [
    Shape.init(ShapeType = StyleParam.ShapeType.Line, X0 = 10, Y0 = 0., X1 = 10, Y1 = 200., Yref = "y1")
    Shape.init(ShapeType = StyleParam.ShapeType.Line, X0 = 35, Y0 = 0., X1 = 35, Y1 = 200., Yref = "y2")
    Shape.init(ShapeType = StyleParam.ShapeType.Line, X0 = 41, Y0 = 0., X1 = 41, Y1 = 200., Yref = "y3")
]
|> Chart.Show

Related information

  • Windows 10 Home 64-bit (10.0, Build 18362) (18362.19h1_release.190318-1202)
  • fsharp.plotly.1.2.3-beta2
  • .NET Version 3.1.101

Comparison with XPlot wrapper

I just came across this library thanks to Sergey's F# weekly - it's great to see more work happening on a nice lightweight wrapper for Plotly! With the stand-alone open source release, Plotly seems to be the way to go for HTML charting these days.

Given that there is also the XPlot Plotly wrapper, so I was curious what are the main differences between the two? (Are the APIs very different? Are there some things that XPlot does not handle well?)

how to draw a chart from f# interactive

i run

open FSharp.Plotly

Chart.Scatter ([1; 2; 3; 4],[12; 9; 15; 12],
      StyleParam.Mode.Lines_Markers,
      Name="lines and markers")

in interactive but nothing happens. are there any prerequisites?
Is it necessary to install plotly and start it?

Improve usability from C#

Description

There were already reports regarding problems using Plotly.NET from C#, e.g. #29 .

Problems regarding the translation of F# options into C# have been fixed, however there are 2 main issues left:

  • Extension methods defined in the ChartExtensions module do not works as intended. This can be fixed using the [<System.Runtime.CompilerServices.Extension>] atttribute for those methods, making it possible to call the methods on chart instances in C#, e.g

    myChart |> Chart.Show

    will in C# be

    myChart.Show()

    The extension method must have the Chart as first parameter though, so overloads for all fitting methods are necessary. Additionally, using static ChartExtensions already works.

    implemented via members of GenericChart via c1ed1be

  • Generic types are easier to use in F#. Consider the following F# example:

    Chart.Point(data,Color="#ffffff")

    In this case, Color is not typed in the Chart.Point function, and is infered as generic 'a1. This is not the case in C#, where you must annotate it (the second string annotation). :

    var chart = Chart.Point<double, double, string, string>(data, Color: "#ffffff");
    
    //This is what you should be able to do:
    var chart = Chart.Point<double, double, string>(data, Color: "#ffffff");

    I see no solution for that other than adding type annotations to the respective parameters extensively.

However, when these issues are taken care of, from my limited usage of C# it seems like we can reach comfortable usage in that language with these features added.

Add functionality to provide textual description to the charts

I generate many nearly identical charts at the same time. The only difference is some string description which is internally "attached" to F# code, which generated the chart using this library. Subsequently, I need to be able to add that textual description, let's say, below the chart. This has nothing to do with Plotly chart name / axes labels (as several charts routinely plot the same functions but for different input parameters).

Which means that I need to add some extra HTML to the generated files. What would be the best way to do that?

.Net Interactive don't render chart in workbook

Description

Could be documentation or code issue. But according to the documentation ending the cell with the value of the chart should render it in the workbook.

Repro steps

Running below cell in a .Net interactive workbook does not render the chart.

#r "nuget: Plotly.NET, 2.0.0-beta1"
#r "nuget: Plotly.NET.Interactive, 2.0.0-beta1"

open Plotly.NET
open Plotly.NET.Interactive

let xData = [0. .. 10.]
let yData = [0. .. 10.]

let mychart =
Chart.Point(xData,yData)
|> Chart.withX_AxisStyle ("xAxis", Showgrid=false)
|> Chart.withY_AxisStyle ("yAxis", Showgrid=false)

mychart

Expected behavior

Chart is rendered in the workbook

Actual behavior

Running the cell results in

Item1 Item2 Item3
Plotly.NET.Trace Plotly.NET.Layout Plotly.NET.Config

latex issure

version:2.0.0-beta8

let header = [ "$x_0$"; "迭代次数"; "数值结果"; "数值误差" ]

The thing is that I can't produce LaTeX output out of line, which can be produced under Plotly on python, MATLAB

Adapt Chart visualization for Dash/Kaleido

Description

Currently, The (single) GenericChart type is a tuple of data, layout, and config. Different endpoints such as the Dash Graph component or Kaleido that accept plotly graphs in JSON format however expect these to be fields of the same object, e.g.

{
    "data" : ... , 
    "layout": ..., 
    "config": ...
}

or at least

{
    "data" : ... , 
    "layout": ..., 
}

with the config object being separate

We should adapt the type accordingly, either by making both Union cases of GenericChart inherit from DynObj or abstracting Chart/MultiChart as record types. Additionally, we should adapt the html scaffold for displaying Charts to render plotly graphs directly from that Json instead of declaring data/layout/config objects in a script tag.

Add withHeight and withWidth functions

Sometimes, it may be beneficial to not be forced to overwrite the default value of one of these if one just wants to change the other - Especially in the context of Dash.Net, where height can be fixed but plot width is responsive.

Newtonsoft.Json reference

Description

nuget package references Newtonsoft.Json v=10.0.0, packages .config references Newtonsoft.Json v=9.0.1

Repro steps

Please provide the steps required to reproduce the problem

  1. Reference FSharp.Plotly package v1.0.3

  2. Receive error message

System.IO.FileNotFoundException: Could not load file or assembly 'Newtonsoft.Json, Version=10.0.0.0, Culture=neutral, PublicKeyToken=30ad4fe6b2a6aeed' or one of its dependencies. The system cannot find the file specified.
File name: 'Newtonsoft.Json, Version=10.0.0.0, Culture=neutral, PublicKeyToken=30ad4fe6b2a6aeed'
   at FSharp.Plotly.GenericChart.toChartHTML(GenericChart gChart)
   at FSharp.Plotly.GenericChart.toEmbeddedHTML(GenericChart gChart)

Expected behavior

Nuget package page lists Newtonsoft.Json version referenced

Actual behavior

Nuget package page does not display referenced package, listed as:
Newtonsoft.Json (>= 0.0.0)

Thoughts?

I'm not familiar enough with packet, but I'd be happy to try and fix up this discrepancy if you can point me in the right direction.

Alternatively, fsharp.plotly could be changed to use the JavaScriptSerializer in System.Web.Script.Serialization instead of Newtonsoft.Json. Or will that cause further issues when targeting Mono, etc?

Versioning issues with 2.0.0-beta6

Thanks for providing this, it looks awesome. I'm eager to try it out.

Description

Cannot resolve dependencies with .NET core 5

Repro steps

Create a notebook using F# and try to install Plotly.NET or the interactive

Expected behavior

It installs without issue

Actual behavior

It's unable to resolve dependencies. It looks like it's depending on packages that aren't yet publicly available on NUGET.

#r "nuget: Deedle, 2.3.0"
#r "nuget: Plotly.NET, 2.0.0-beta6"
#r "nuget: Plotly.NET.Interactive, 2.0.0-beta6"

open Deedle

prints

/tmp/nuget/70087--17f2cd13-d092-48c7-a1f4-00e4a3b53f19/Project.fsproj : warning NU1603: Plotly.NET.Interactive 2.0.0-beta6 depends on Microsoft.DotNet.Interactive (>= 1.0.0-beta.20574.9) but Microsoft.DotNet.Interactive 1.0.0-beta.20574.9 was not found. An approximate best match of Microsoft.DotNet.Interactive 1.0.0-beta.21108.3 was resolved.
/tmp/nuget/70087--17f2cd13-d092-48c7-a1f4-00e4a3b53f19/Project.fsproj : warning NU1603: Plotly.NET.Interactive 2.0.0-beta6 depends on Microsoft.DotNet.Interactive.Formatting (>= 1.0.0-beta.20574.9) but Microsoft.DotNet.Interactive.Formatting 1.0.0-beta.20574.9 was not found. An approximate best match of Microsoft.DotNet.Interactive.Formatting 1.0.0-beta.21108.3 was resolved.
/tmp/nuget/70087--17f2cd13-d092-48c7-a1f4-00e4a3b53f19/Project.fsproj : warning NU1603: Plotly.NET.Interactive 2.0.0-beta6 depends on Microsoft.DotNet.Interactive.FSharp (>= 1.0.0-beta.20574.9) but Microsoft.DotNet.Interactive.FSharp 1.0.0-beta.20574.9 was not found. An approximate best match of Microsoft.DotNet.Interactive.FSharp 1.0.0-beta.21108.3 was resolved.
/tmp/nuget/70087--17f2cd13-d092-48c7-a1f4-00e4a3b53f19/Project.fsproj : error NU1102: Unable to find package System.CommandLine with version (>= 2.0.0-beta1.21072.2)
/tmp/nuget/70087--17f2cd13-d092-48c7-a1f4-00e4a3b53f19/Project.fsproj : error NU1102:   - Found 17 version(s) in nuget.org [ Nearest version: 2.0.0-beta1.20574.7 ]
/tmp/nuget/70087--17f2cd13-d092-48c7-a1f4-00e4a3b53f19/Project.fsproj : error NU1102: Unable to find package FSharp.Compiler.Service with version (>= 39.0.3-preview.21102.10)
/tmp/nuget/70087--17f2cd13-d092-48c7-a1f4-00e4a3b53f19/Project.fsproj : error NU1102:   - Found 161 version(s) in nuget.org [ Nearest version: 39.0.0 ]
/tmp/nuget/70087--17f2cd13-d092-48c7-a1f4-00e4a3b53f19/Project.fsproj : warning NU1605: Detected package downgrade: FSharp.Core from 5.0.2-beta.21102.10 to 5.0.0. Reference the package directly from the project to select a different version. 
/tmp/nuget/70087--17f2cd13-d092-48c7-a1f4-00e4a3b53f19/Project.fsproj : warning NU1605:  Project -> Plotly.NET.Interactive 2.0.0-beta6 -> Microsoft.DotNet.Interactive.FSharp 1.0.0-beta.21108.3 -> FSharp.Core (>= 5.0.2-beta.21102.10) 
/tmp/nuget/70087--17f2cd13-d092-48c7-a1f4-00e4a3b53f19/Project.fsproj : warning NU1605:  Project -> Plotly.NET.Interactive 2.0.0-beta6 -> FSharp.Core (>= 5.0.0)

Known workarounds

Tried downgrading to an earlier release, but they look like they're pinned to specific versions of .NET interactive

If I manually add the System.CommandLine and FSharpCompilerServices packages, even though they don't match the package specs, they seem to work:

#r "nuget: Deedle, 2.3.0"
#r "nuget: Plotly.NET, 2.0.0-beta6"
#r "nuget: Plotly.NET.Interactive, 2.0.0-beta6"
#r "nuget: System.CommandLine, 2.0.0-beta1.20574.7"
#r "nuget: FSharp.Compiler.Service, 39.0.0"

Related information

  • Fedora 33
  • .NET Core 5.0.103 [/usr/share/dotnet/sdk]

Implement scaleratio and scaleanchor

Description

I'm using FSharp.Plotly on 2-d map data using Chart.Line and Chart.Point with Chart.Combine. This works well except that the x- and y-axis scales are different, so distances in the two directions are inconsistent and squares map to rectangles. As far as I can tell, this is addressed by scaleratio and scaleanchor in base plotly, but these are not exposed here. Is it possible to add this?

'NaN' disturbs axis format

Description

When i want to create Boxplots of float arrays and combine them, i run into an issue if one or more of the arrays consist of 'NaN'. With the NaNs in the array the axis seems to be treated as a category axis and not as a value axis, leading to a non-continuously labeled axis.

image

Repro steps

  1. Open a fsx file and load FShar.Plotly

  2. Run the following snippet:

let testArr =
    [|
        (1, [|nan;nan;nan|]);
        (2, [|0.07427533383; 0.757004965; 0.6258709596|]);
        (3, [|0.2661355688; 0.7138485368; 0.3500703892|])
    |]

testArr
|> Array.map (fun (number, values) ->
    Chart.BoxPlot ("y",values, Name=(sprintf "N: %i" number),Boxpoints=StyleParam.Boxpoints.All,Orientation=StyleParam.Orientation.Vertical)
)
|> Chart.Combine
|> Chart.withMargin (Margin.init(Left=200.))
|> Chart.Show

Known workarounds

Filter all arrays and remove every NaN present

Add possibility to save charts as images programmatically

Creating images locally without having to open plots and click on the save as image button would be awesome. This however will take some work.

The only way i found to do this so far is using Orca, which is a command line utility that plotly itself uses to render images. Orca can be either installes as npm module, conda package, or deployed as a docker container. All of these add some overhead but i still think this is usefull. I will start to implement some functions to call orca functions and we will see how it goes.

Add Unit tests for the core library

As the project is now .NET core only, we should move the tests project to a new expecto version running on .NET core aswell and gradually add Unit tests for the library core as the state of the project solidifies. Good starting points would be html generation from GenericChart and the Chart functions

Plotly.js 2.0 compatibility

Hi there,

I lead the graphing libraries team at Plotly where we're busy working on version 2.0 of Plotly.js. I'm reaching out to folks who we know are "downstream" of Plotly.js to give you a heads-up about the changes so you can let me know if/how disruptive they're likely to be for you :)

Our approach here is not to make gratuitous breaking changes, but mostly to drop support for un/under-used functionality that slows down development for frequently-used functionality. We expect that the vast majority of users of Plotly.js and downstream systems like Plotly.py, Plotly.R, PlotlyJS.jl, Plotly.NET etc will be unaffected by these changes. The tracking issue we've got going is here plotly/plotly.js#5395

The major changes include, at the Javascript layer:

  • dropping IE 9/10 support due to a switch in the Promise polyfill we're using, for security reasons
  • dropping exports of old versions of d3 modules under Plotly.d3 (so we can upgrade them internally)
  • dropping some exports of deprecated methods like Plotly.plot in favour of Plotly.newPlot and Plotly.react

The major changes at the schema layer:

  • dropping support for pointcloud, area and contourgl traces, as well as the legacy polar attributes from scatter like scatter.r and layout.angularaxis
  • dropping the role key from the schema altogether

I'm happy to answer any questions or consider changing our plans if it can avoid some major downstream disruption, so please get in touch or reply to this issue or to plotly/plotly.js#5395 :)

Nicolas

share X-axis in Chart.Stack

Hi again,
Really enjoy the package so far. I notice on the plotly documentation there is a section about share axis subplots:
https://plotly.com/python/subplots/ with the option of shared_xaxes=True, wonder how I can do the same in FSharp.Plotly, I played around with Chart.withX_AxisStyle and Chart.withX_Axis but didn't go anywhere. Do give some advice, thanks.

Charts rendered in Jupyter notebooks

Love this library, however, is there any plan to implement a method which outputs chart HTML / CSS that can be represented immediately in Jupyter Lab / notebooks? I've not looked into what data format Jupyter requires to show charts, but I tested XPlot and the charts render immediately inside the notebook.

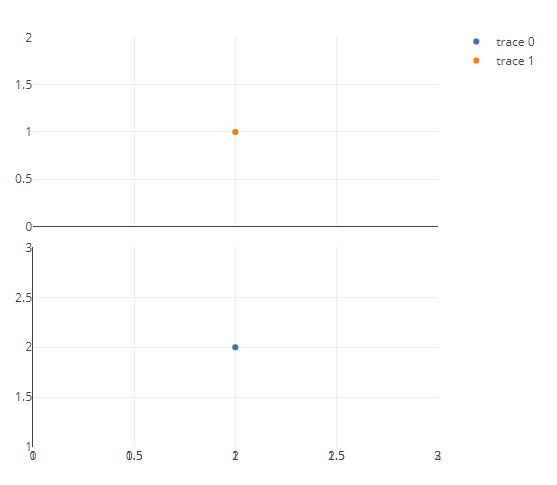
Shared axes in stacked charts show strange behaviour

Description

When using Chart.Grid or Chart.SingleStack the default axis option is sharedAxes=false, which in practice does not work.
When explicitly setting sharedAxes=false, the resulting chart shows a strange bahaviour. Both axes appear at the lowest chart.

Repro steps

#r "nuget: Plotly.NET, 2.0.0-beta5"
open Plotly.NET

let ch1 = Chart.Point([1,2])
let ch2 = Chart.Point([2,1])

Chart.SingleStack([ch1;ch2]) |> Chart.Show
Chart.SingleStack([ch1;ch2],true) |> Chart.Show
Chart.SingleStack([ch1;ch2],false) |> Chart.Show

Expected behavior

Two stacked charts with a x-axis attached to each chart separately.

Actual behavior

image

Reference

[<Optional;DefaultParameterValue(false)>]?sharedAxes:bool,

Additional information

When multiple charts are combined using Chart.Grid, some are merged, some remain separate

[1 .. 10]
|> List.map (fun x-> Chart.Point([x,2*x],string x))
|> fun x ->  Chart.Grid ([x.[..5];x.[6..]],false)
|> Chart.Show 

image

Support DateTimeOffset type

Description

We use DateTimeOffset for everything instead of regular DateTime since it maintains time zone information. Right now we have to |> List.map (fun datetimeoffset -> datetimeoffset.UtcDateTime) every time we chart up something.

Would it be possible to support DateTimeOffset directly?

Recommend Projects

  • React photo React

    A declarative, efficient, and flexible JavaScript library for building user interfaces.

  • Vue.js photo Vue.js

    🖖 Vue.js is a progressive, incrementally-adoptable JavaScript framework for building UI on the web.

  • Typescript photo Typescript

    TypeScript is a superset of JavaScript that compiles to clean JavaScript output.

  • TensorFlow photo TensorFlow

    An Open Source Machine Learning Framework for Everyone

  • Django photo Django

    The Web framework for perfectionists with deadlines.

  • D3 photo D3

    Bring data to life with SVG, Canvas and HTML. 📊📈🎉

Recommend Topics

  • javascript

    JavaScript (JS) is a lightweight interpreted programming language with first-class functions.

  • web

    Some thing interesting about web. New door for the world.

  • server

    A server is a program made to process requests and deliver data to clients.

  • Machine learning

    Machine learning is a way of modeling and interpreting data that allows a piece of software to respond intelligently.

  • Game

    Some thing interesting about game, make everyone happy.

Recommend Org

  • Facebook photo Facebook

    We are working to build community through open source technology. NB: members must have two-factor auth.

  • Microsoft photo Microsoft

    Open source projects and samples from Microsoft.

  • Google photo Google

    Google ❤️ Open Source for everyone.

  • D3 photo D3

    Data-Driven Documents codes.