ace is an implementation of the Alternating Conditional Expectation (ACE) algorithm [Breiman85], which can be used to find otherwise difficult-to-find relationships between predictors and responses and as a multivariate regression tool.
The code for this project, as well as the issue tracker, etc. is hosted on GitHub. The documentation is hosted at http://partofthething.com/ace.
ACE can be used for a variety of purposes. With it, you can:
- build easy-to-evaluate surrogate models of data. For example, if you are optimizing input parameters to a complex and long-running simulation, you can feed the results of a parameter sweep into ACE to get a model that will instantly give you predictions of results of any combination of input within the parameter range.
- expose interesting and meaningful relations between predictors and responses from complicated data sets. For instance, if you have survey results from 1000 people and you and you want to see how one answer is related to a bunch of others, ACE will help you.
The fascinating thing about ACE is that it is a non-parametric multivariate regression tool. This means that it doesn't make any assumptions about the functional form of the data. You may be used to fitting polynomials or lines to data. Well, ACE doesn't do that. It uses an iteration with a variable-span scatterplot smoother (implementing local least squares estimates) to figure out the structure of your data. As you'll see, that turns out to be a powerful difference.
ace is available in the Python Package Index, and can be installed simply with the following.
On Linux:
sudo pip install aceOn Windows, use:
pip install aceDirectly from source:
git clone [email protected]:partofthething/ace.git
cd ace
python setup.py install
Note
If you don't have git, you can just download the source directly from here.
You can verify that the installation completed successfully by running the automated test suite in the install directory:
python -m unittest discover -bvTo use, get some sample data:
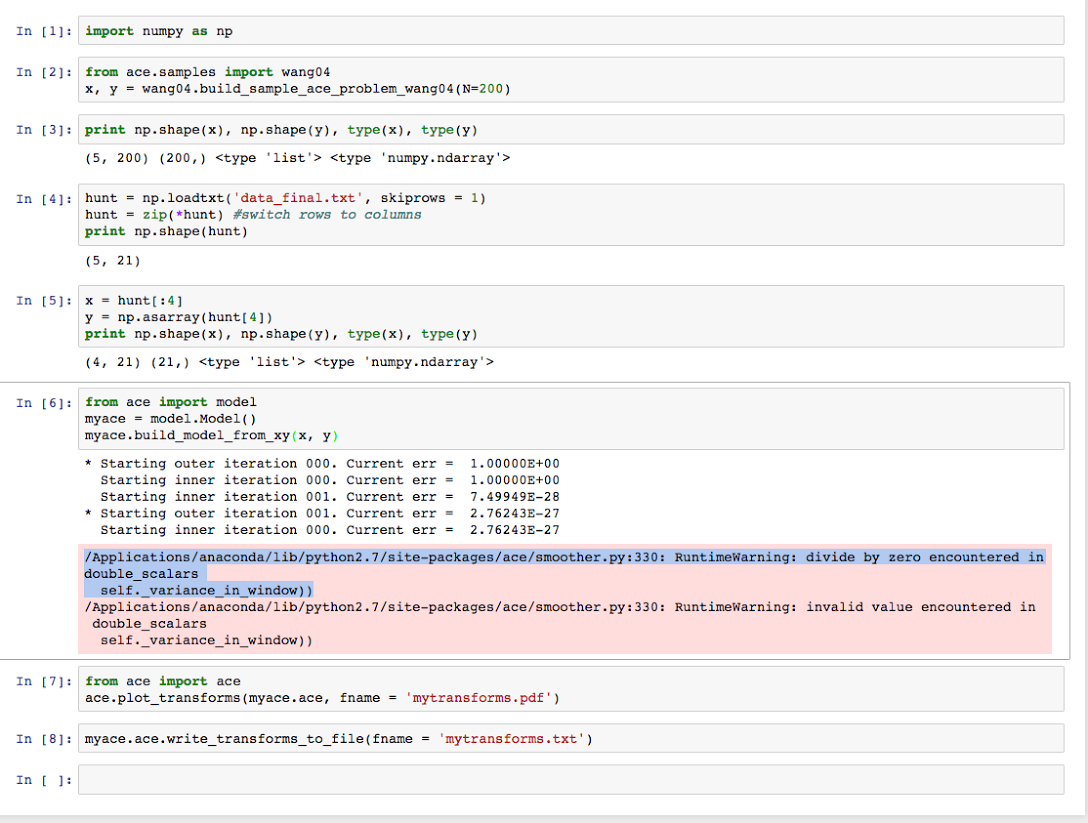
from ace.samples import wang04
x, y = wang04.build_sample_ace_problem_wang04(N=200)
and run:
from ace import model
myace = model.Model()
myace.build_model_from_xy(x, y)
myace.eval([0.1, 0.2, 0.5, 0.3, 0.5])
For some plotting (matplotlib required), try:
from ace import ace
ace.plot_transforms(myace.ace, fname = 'mytransforms.pdf')
myace.ace.write_transforms_to_file(fname = 'mytransforms.txt')
Note that you could alternatively have loaded your data from a whitespace delimited text file:
myace.build_model_from_txt(fname = 'myinput.txt')Warning
The more data points ACE is given as input, the better the results will be. Be careful with less than 50 data points or so.
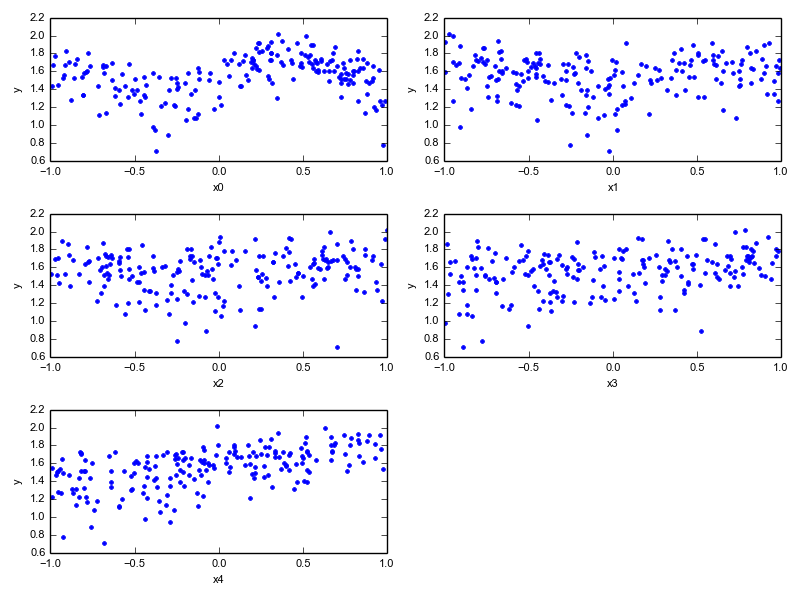
A combination of various functions with noise is shown below:
Given just those points and zero knowledge of the underlying functions, ACE comes back with this:
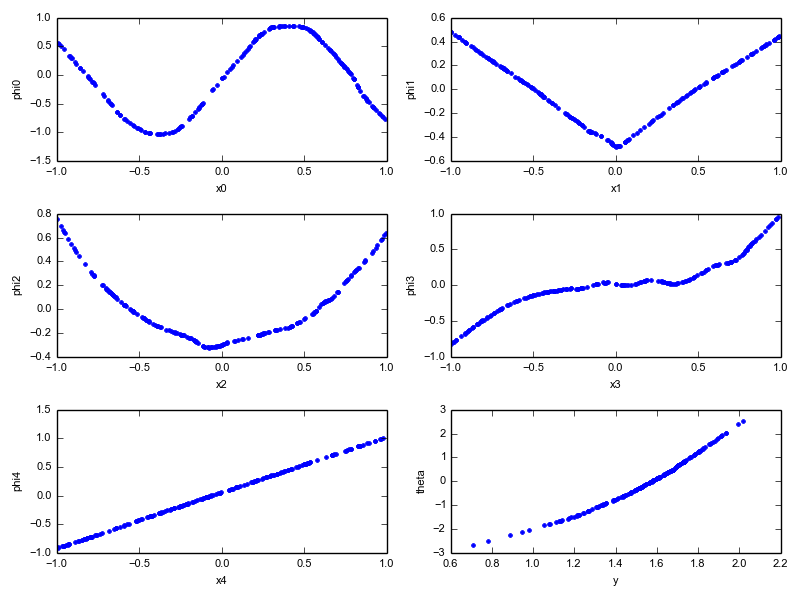
A longer version of this demo is available in the Sample ACE Problems section.
This implementation of ACE isn't as fast as the original FORTRAN version, but it can still crunch through a problem with 5 independent variables having 1000 observations each in on the order of 15 seconds. Not bad.
ace also contains a pure-Python implementation of Friedman's SuperSmoother [Friedman82], the variable-span smoother mentioned above. This can be useful on its own for smoothing scatterplot data.
The ACE algorithm was published in 1985 by Breiman and Friedman [Breiman85], and the original FORTRAN source code is available from Friedman's webpage.
Before this package, the ACE algorithm has only been available in Python by using the rpy2 module to load in the acepack package of the R statistical language. This package is a pure-Python re-write of the ACE algorithm based on the original publication, using modern software practices. This package is slower than the original FORTRAN code, but it is easier to understand. This package should be suitable for medium-weight data and as a learning tool.
For the record, it is also quite easy to run the original FORTRAN code in Python using f2py.
This package was originated by Nick Touran, a nuclear engineer specializing in reactor physics. He was exposed to ACE by his thesis advisor, Professor John Lee, and used it in his Ph.D. dissertation to evaluate objective functions in a multidisciplinary design optimization study of nuclear reactor cores [Touran12].
This package is released under the MIT License, reproduced here.
- Breiman85
L. BREIMAN and J. H. FRIEDMAN, "Estimating optimal transformations for multiple regression and correlation," Journal of the American Statistical Association, 80, 580 (1985). [Link1]
- Friedman82
J. H. FRIEDMAN and W. STUETZLE, "Smoothing of scatterplots," ORION-003, Stanford University, (1982). [Link2]
- Touran12
N. TOURAN, "A Modal Expansion Equilibrium Cycle Perturbation Method for Optimizing High Burnup Fast Reactors," Ph.D. dissertation, Univ. of Michigan, (2012). [The Thesis]
- Wang04
D. WANG and M. MURPHY, "Estimating optimal transformations for multiple regression using the ACE algorithm," Journal of Data Science, 2, 329 (2004). [Link3]