Airline User Review Tweets – A Sentiment Analysis
Introduction
This project focuses on a text-processing application that uses Natural Language Processing (NLP) to read a dataset that is specific to a business and serves the purpose of enhancing or improvement of a feature helpful for the growth of the business. In general, if one needs to define NLP, it is a branch of Artificial Intelligence that deals with the interaction between Computer and Humans using the natural language as a medium to analyze, manipulate as well as generate. It has a variety of uses such as Auto-Correction, Auto-fill, Spam filter, Text processing, Sentiment Analysis and much more. Problem Statement
Here, we have taken the Airline Industry as our business domain. We are targeting 6 Major US Airlines and analyzing the reviews made by the customers after their flight or other experience with any of those companies. The companies whose reviews data is analyzed are :
- US Airways
- United Airlines
- American Airlines
- Southwest
- Virgin America
- Delta
Reviews need to be analyzed into 3 Categories – Positive, Negative and Neutral.
Solution
This will be a supervised machine learning task where we process the text and put it under pre-defined categories. Specifically, we will be doing sentiment analysis on the user data. We will be following the common machine learning pipeline for this which is discussed further below. Choosing a dataset is the most important task in the Machine Learning task and we have chosen a dataset contains a substantial amount of data containing the user reviews as tweets addressed to one of the Airline Company mentioned above. Our text processing application will use that data to differentiate reviews into 3 categories – Positive, Negative and Neutral. Naked eye data analysis of the dataset showed the following results :
- The data is too ambiguous and needs to be converted to a uniform type
- The dataset is too large to be interpreted theoretically, thus we will use graphical analysis to visualize data (exploratory data analysis) Following the general rules of developing a model, we will first clean the data set and do the NLP tasks starting with Syntax Analysis (Grammar Induction, Lemmatization, Parsing, Stemming, etc.) As a team effort, we will be using 5 Models (which will be revealed further in the document). These steps To elaborate on these steps, we can list them as follows:
- Exploratory data analysis
- Dataset Cleaning
- Pre-Process the data
- Tf- IDF
- Divide the datasets – Train set and Test set
- Training the Model
- Improve the performance of the models by tuning the Features
Before we start with the above-mentioned steps, we need to configure our machine and the Python IDE with the required libraries and packages.
Import the Packages
The common packages which will be required for this solution are:
- NLTK – NLP Library in Python. We will use state_union, stopwords, and wordnet in specific
- Scikit-Learn – Python Machine Learning Library
- Pandas – Data Manipulation and Analysis
- Re – String searching and Manipulation
NLTK Library:

However, there are some packages specific to some models which are as follows:
Logistic Regression:

Random Forest Classifier:
K – Nearest Neighbour:

Naive Bayesian Classifier:
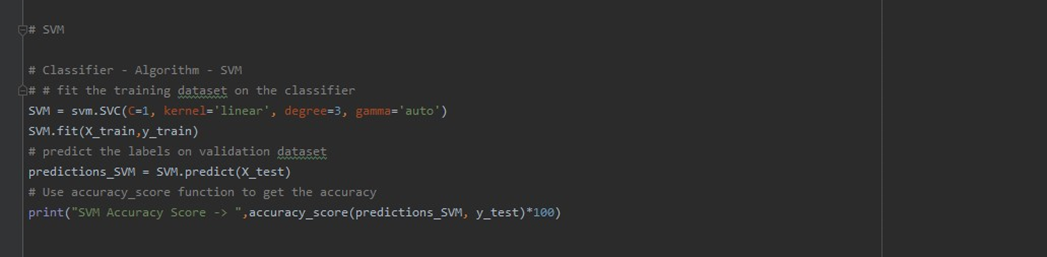
Support Vector Machine:

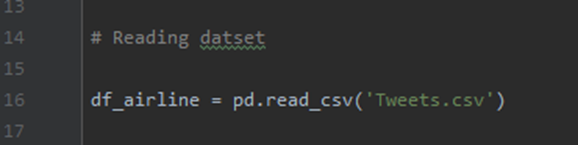
Import the Dataset
We have downloaded the dataset from the following link and the data is located on our local computer. And we will import the data using the following code:
The source URL is: https://raw.githubusercontent.com/kolaveridi/kaggle-Twitter-US- Airline-Sentiment-/master/Tweets.csv
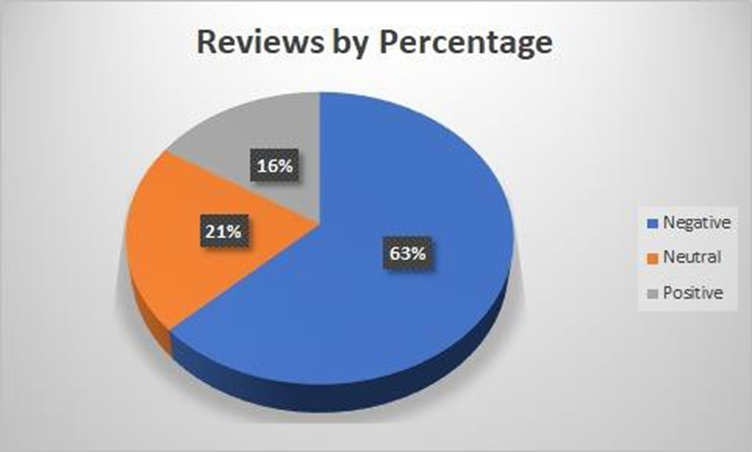
Exploratory Data Analysis
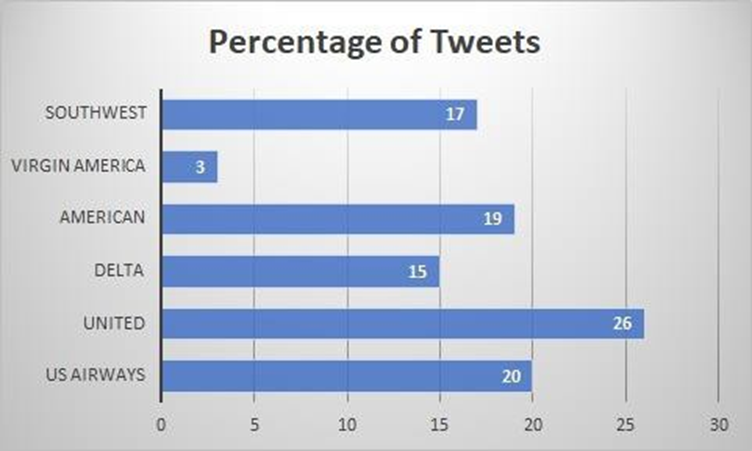
We would like to know the percentage of each review in the dataset – Positive, Negative and Neutral Graph 1
Then, we would like to know the Total number of tweet reviews for each Airline
Graph 2
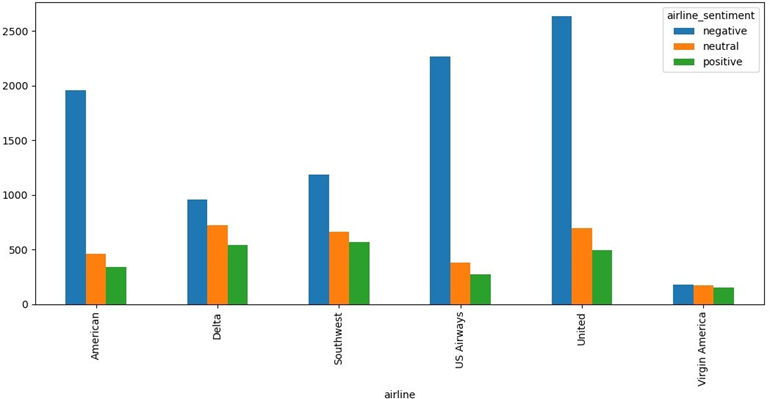
Finally, let us have a look at the reviews divided categorically for each of those 6 Airlines Graph 3
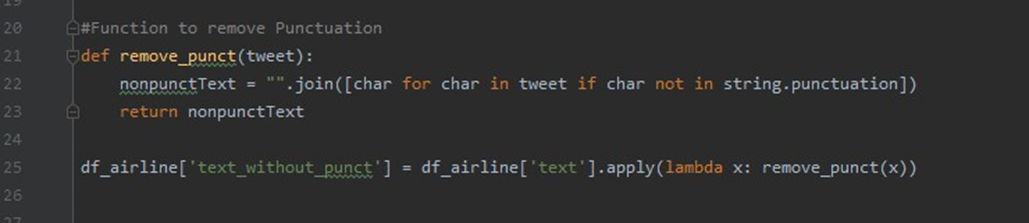
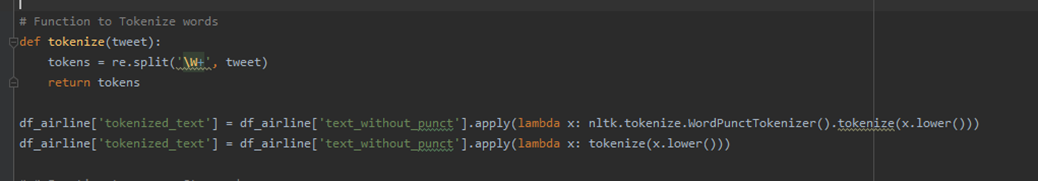
Data Cleaning
The datasets contain the tweets by multiple users which makes the dataset have slangs, punctuation marks and much more. Thus we need to do the following task to clean and prepare our data:
- Remove Punctuation Marks
- Tokenize the data – Separate the tweets into tokens (Tokens may be sentences or words)
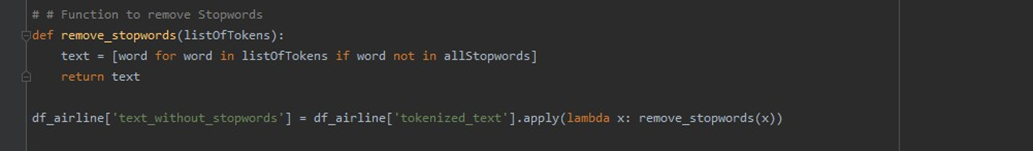
- Elimination of stopwords – Remove the commonly occurring words which convey almost no information about the data
Pre-Process the Data
Now we begin the pre-processing of the data by using NLP Syntax evaluation tasks
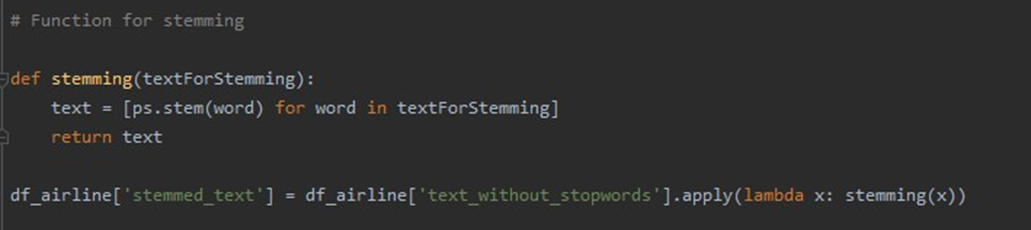
- Stemming the data – Treat same words with different forms of tense, verb, and grammar as same words (reduces the corpus of the words) – word back to its root form
- Lemmatizing the data – This helps us derive the Lemma – aka the canonical form of the word – base dictionary for of a word

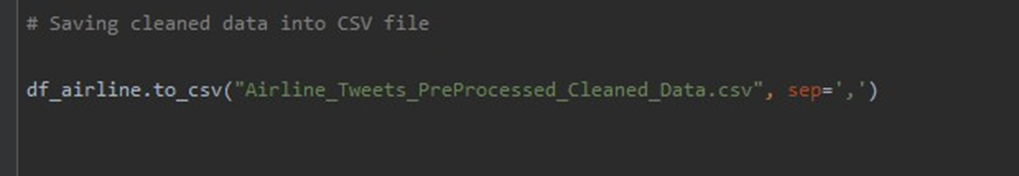
- Now we will save the pre-processed data to a new file.
Vectorizing the Data using TF- IDF
TF = Term Frequency
IDF = Inverse Document Frequency
It improves the contribution of words towards classification in the whole dictionary while its occurrence is less as compared to a particular document (here it is our CSV file) It helps us find the word in the document as well as will fetch the word from a dictionary and gives binary values (0 or 1) as output and then store it to an array. Often it is used to plot the relative frequency of the word. Generally, it is used for improving the search engine score. (This is implemented in each Model and not on the whole dataset at once) Here, the SciKit has TfIDVectorizer which allows us to convert the text to TF-IDF
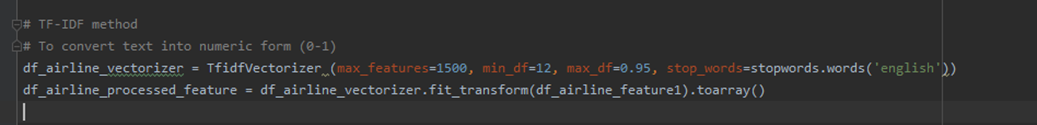
The variables used are :
Max-features = 1500 – 1500 Most frequently occurring words
Max_df = 0.95 - 95% of the most frequently occurring words in the dataset.
Min_df = 12 – At least 12 of the documents in the dictionary has these particular words These variables are kept constant for all the models which we will train on the Airline Tweets dataset. Divide the dataset - Train set and Test set
We will divide the dataset into parts Train set – 95% of the dataset Test set – 5 % of the dataset

Training the Model
Logistic Regression:

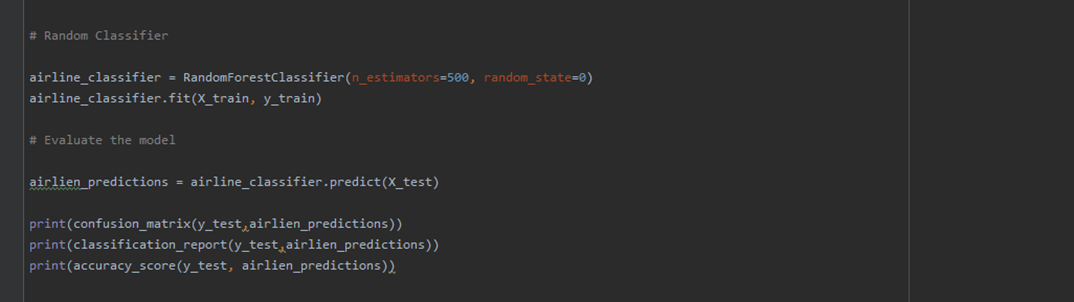
Random Forest Classifier:
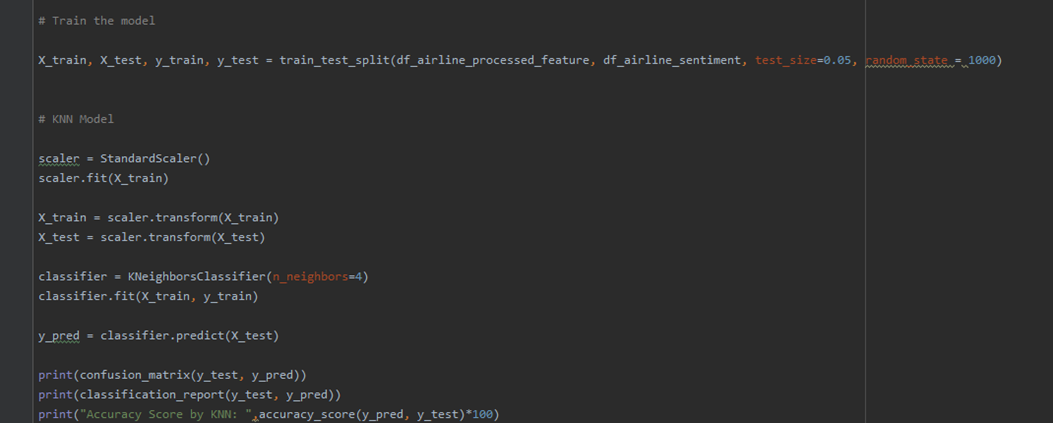
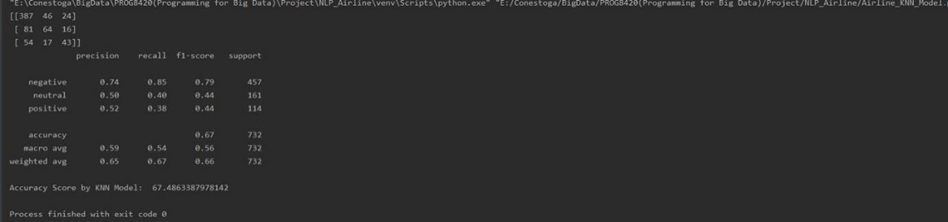
K – Nearest Neighbour:
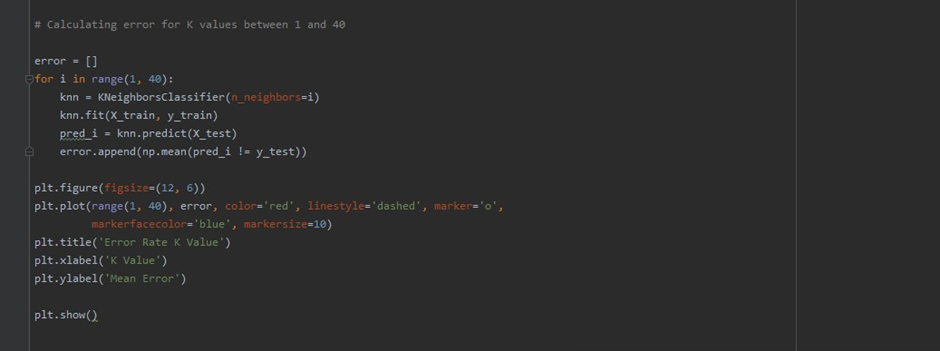
Now for K-values, first we randomly chose the value of K and then we tried to predict it by plotting the error rate for the K -Values for (1-40) to take the best K-value into consideration
The graph looks like this:
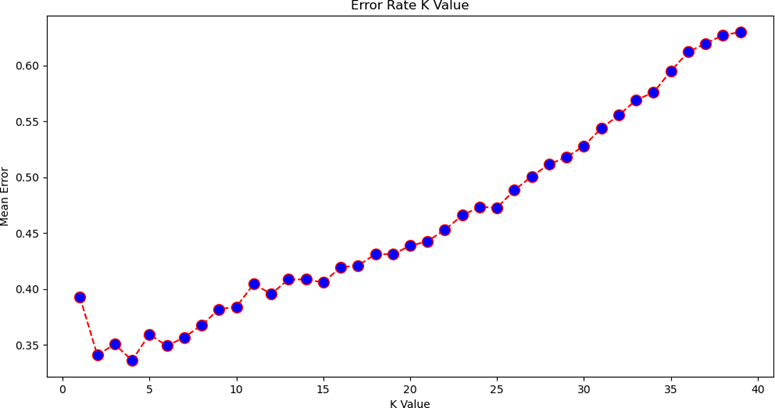
The lowest error rate was for value K = 4 from the graph, thus that is used in the above-shown code to train the model
Naive Bayesian Classifier:

Support Vector Machine:
Output and Accuracy of the Models
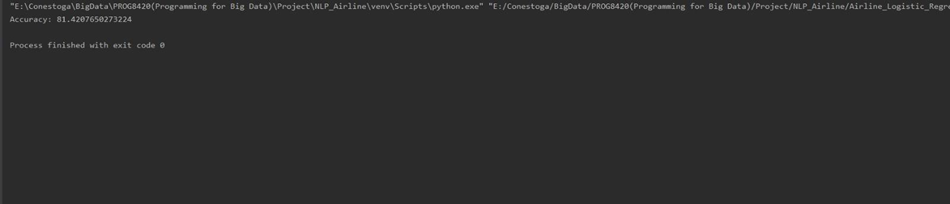
Logistic Regression:
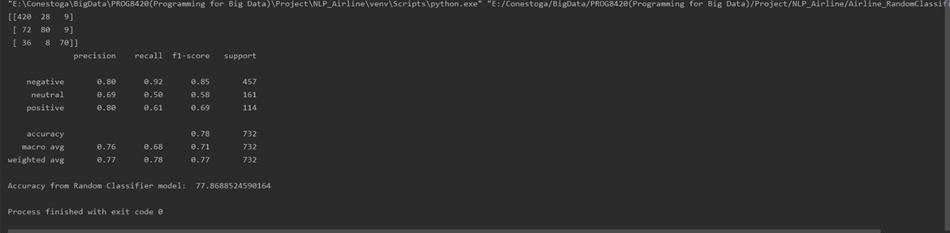
Random Forest Classifier:
K – Nearest Neighbour:
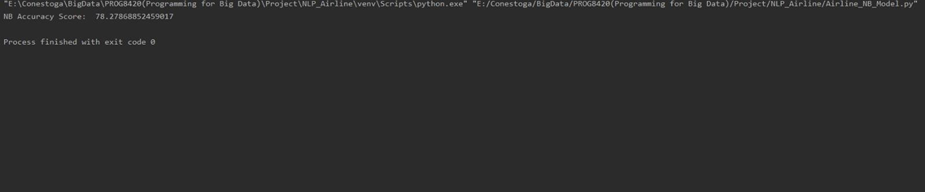
Naive Bayesian Classifier:
Support Vector Machine:

Comparison of the Accuracy of All Models
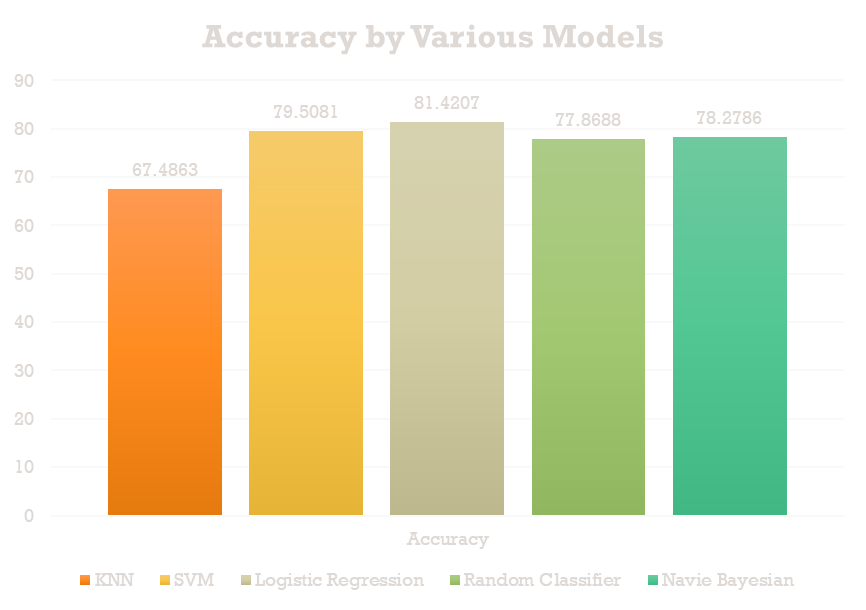
Conclusion We used 5 Models to classify the user tweets into 3 pre-classified categories – Positive, Negative and Neutral. Out of the 5 Models which we trained on 95% of our dataset the best fit model for the Airline Tweet Review Sentiment Analysis is the Logistic Regression Model with an accuracy of 81.42 %. This project helped us to gain insights about Sentiment analysis using different Python libraries and training 5 Models on a pretty big dataset.
