Git Product home page Git Product logo

reviz's Introduction

reviz

A lightweight engine for reverse engineering data visualizations from the DOM

reviz is a lightweight engine for reverse engineering data visualizations from the DOM. Its core goal is to assist in rapid visualization sketching and prototyping by automatically generating partial programs written using Observable Plot from input svg subtrees. reviz can be used directly through the core library, @reviz/compiler, or the Chrome extension, @reviz/extension.

For a hands-on, interactive introduction to reviz, check out the Hello reviz! notebook on Observable.

To get familiar with the various packages in this codebase, check out their respective READMEs.

Installation

Compiler

npm install @reviz/compiler

Extension

🚧 Under Construction 🚧

API

The reviz API is very small; in fact, it consists of only a single function, analyzeVisualization!

import { analyzeVisualization } from '@reviz/compiler';

const viz = document.querySelector('#my-viz');

const { spec, program } = analyzeVisualization(viz);

analyzeVisualization

export declare const analyzeVisualization: (root: SVGSVGElement) => {
  spec: VizSpec;
  program: string;
};

analyzeVisualization is a function that takes in an svg Element as input and returns an Object containing two properties, spec and program.

spec refers to the intermediate representation used by reviz to generate partial Observable Plot programs. It encodes semantic information about the input svg subtree, including its inferred visualization type, geometric attributes of its marks (either circle or rect elements), and presentational attributes of its marks. reviz's architecture mimics that of a traditional compiler, with spec acting as the intermediate representation (IR). It can be useful to examine spec to see whether or not reviz has inferred the correct visualization type for your input svg subtree.

program refers to the partial Observable Plot program that reviz generates. These programs are intentionally incomplete and contain "holes" represented by the string '??'. The presence of a hole indicates that the value for a particular attribute (e.g. the r attribute of a bubble chart or the fill attribute of a stacked bar chart) should be mapped to a column in a user's input dataset rather than kept static across all data elements. After filling in holes with column names from your input dataset, you'll have a complete visualization program ready to run in the browser!

By Example

Let's look at an example to see how reviz works in practice. We'll use this visualization from the New York Times:

A scatterplot visualization from the New York Times

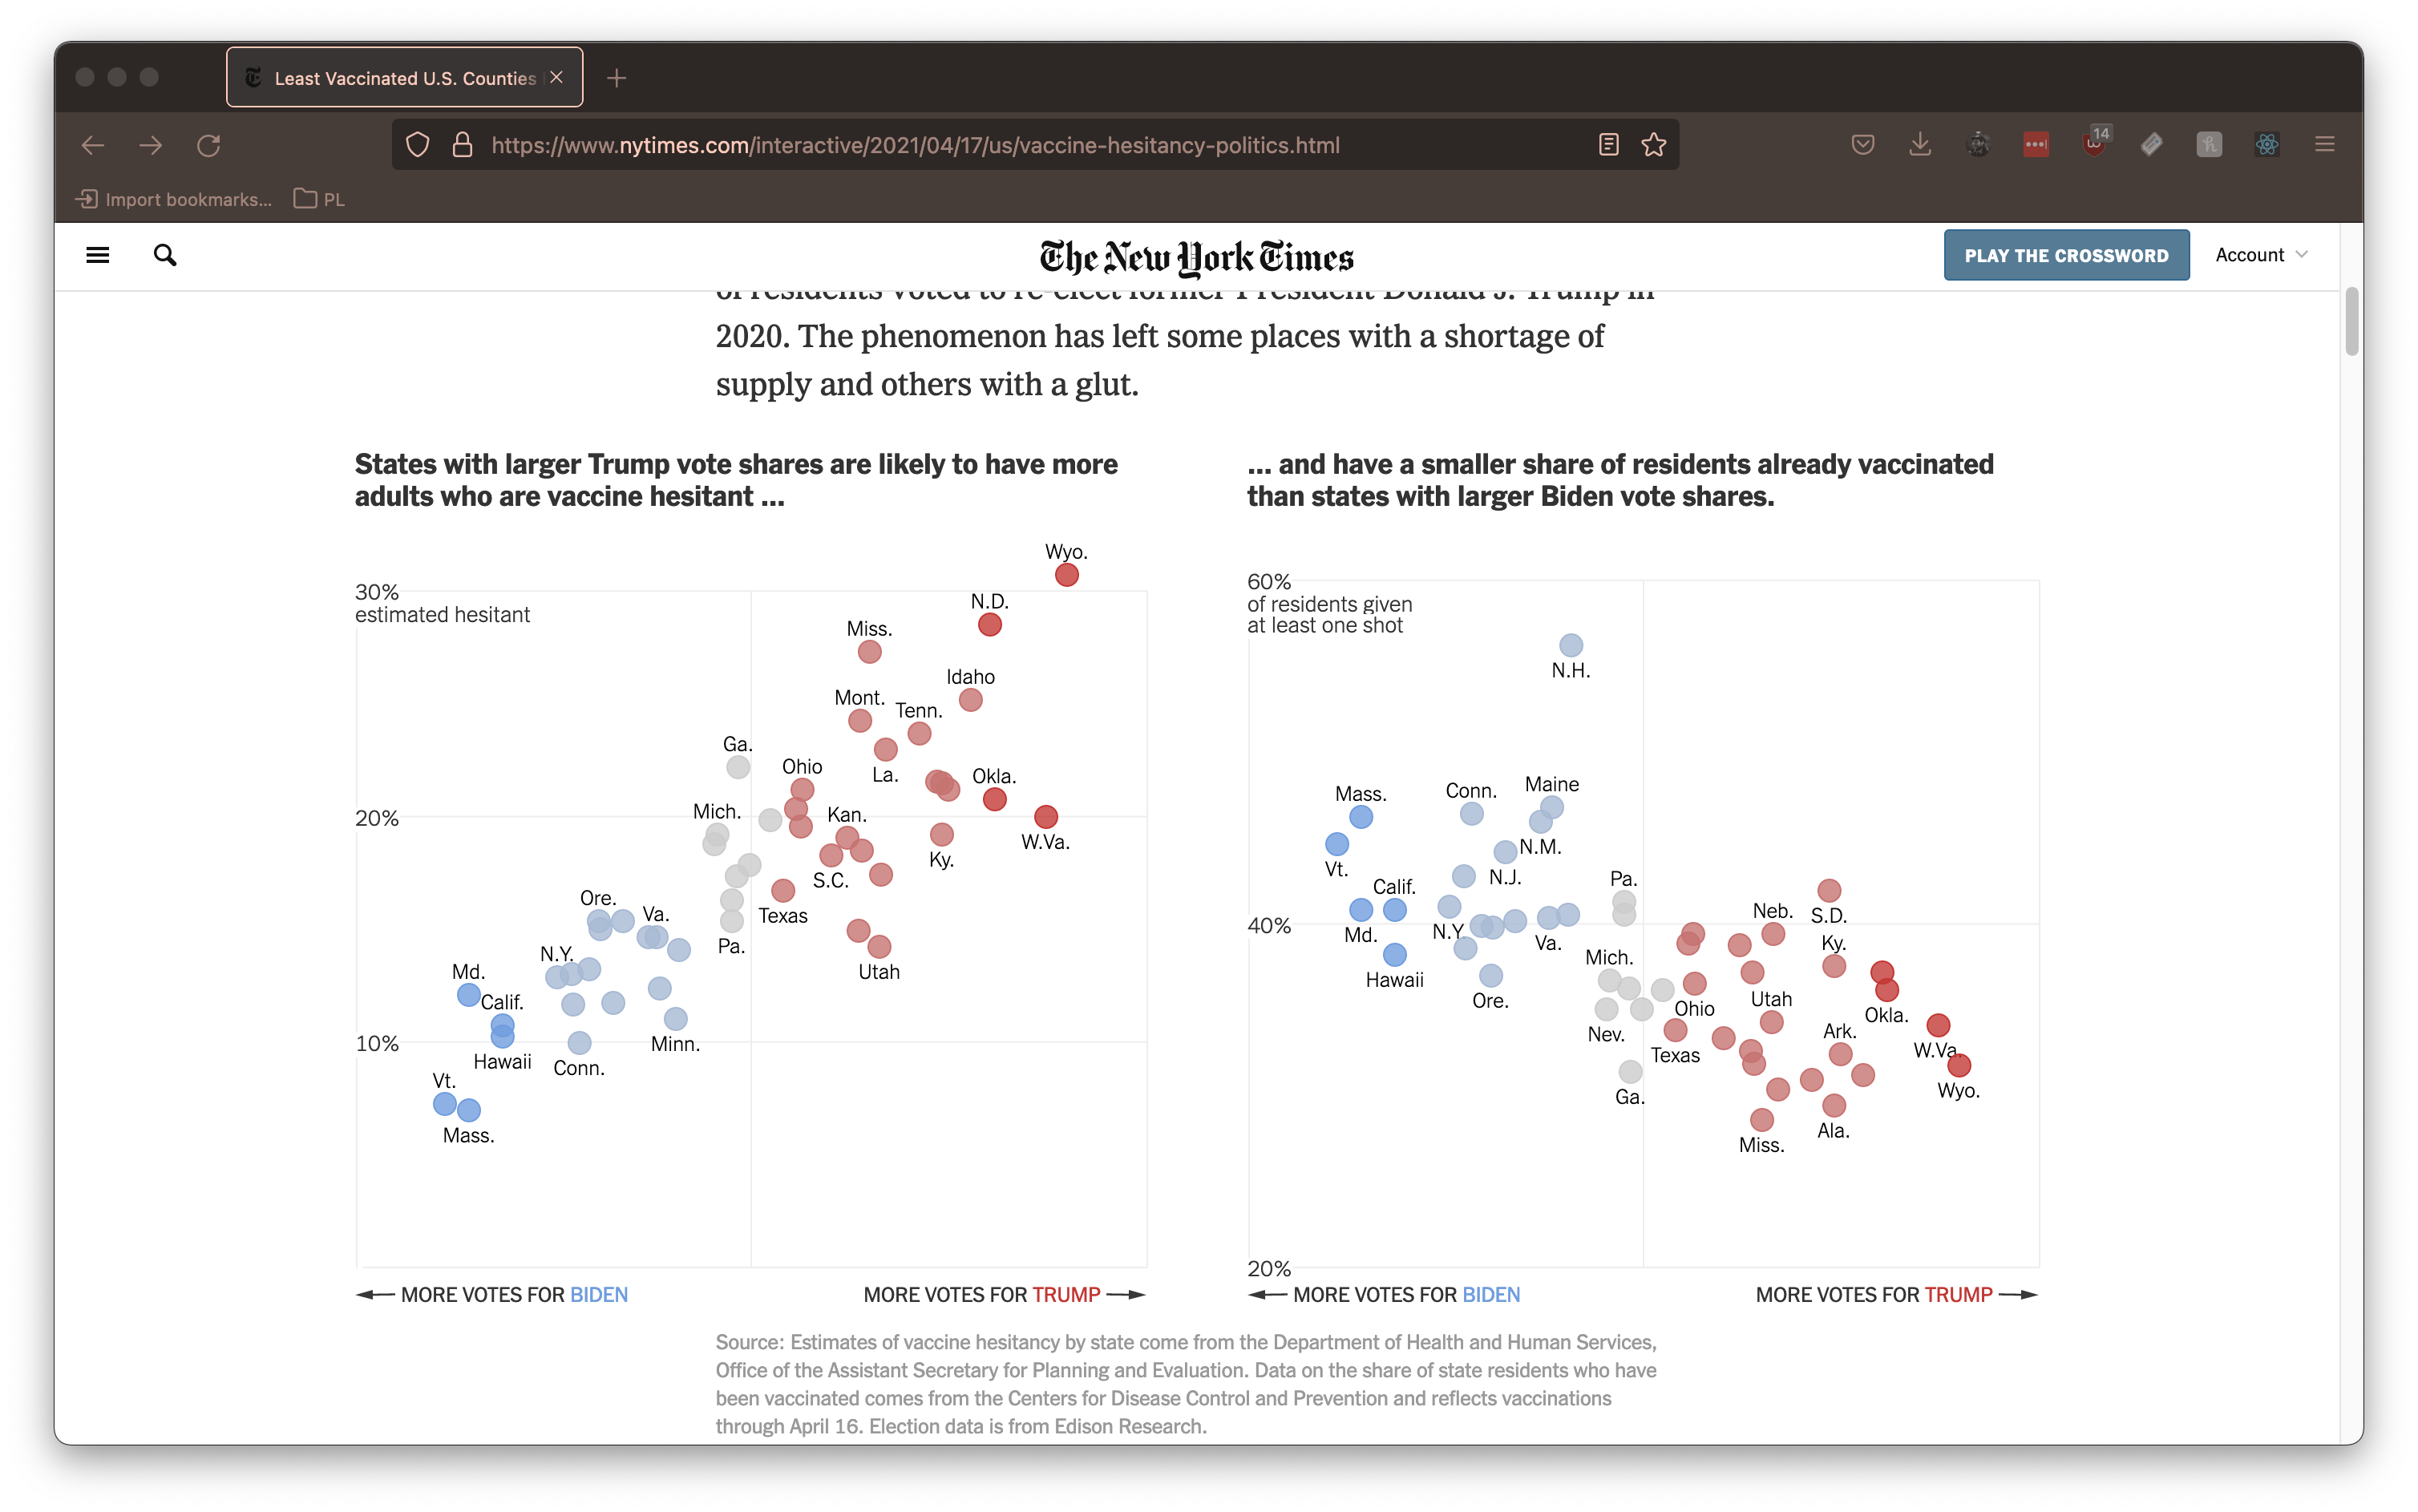
If we point reviz at the root svg Element of this visualization, it generates the following (partial) program:

Plot.plot({
  color: {
    scale: 'categorical',
    range: ['#C67371', '#ccc', '#709DDE', '#A7B9D3', '#C23734'],
  },
  marks: [
    Plot.dot(data, {
      fill: '??',
      stroke: '??',
      fillOpacity: 0.8,
      strokeOpacity: 1,
      strokeWidth: 1,
      x: '??',
      y: '??',
      r: 7,
    }),
  ],
});

Notice that fill, stroke, x and y are all inferred to be holes (indicated by'??') that must be mapped to columns of an input dataset. Conversely, attributes like fillOpacity and strokeWidth are automatically inferred because they are found to be consistent across all mark elements. We can also see that reviz has inferred that the visualization is using a categorical color scale and automatically configures the scale for us.

We can now apply this partial program to a new dataset. Let's use this delightful dataset about penguins from @Fil's Plot Exploration notebook. We can choose input columns from this dataset to "fill in" the holes like so:

Plot.plot({
  color: {
    scale: 'categorical',
    range: ['#C67371', '#ccc', '#709DDE', '#A7B9D3', '#C23734'],
  },
  marks: [
    Plot.dot(data, {
-     fill: '??',
+     fill: 'island',
-     stroke: '??',
+     stroke: 'island',
      fillOpacity: 0.8,
      strokeOpacity: 1,
      strokeWidth: 1,
-     x: '??',
+     x: 'flipper_length_mm',
-     y: '??',
+     y: 'body_mass_g',
      r: 7,
    }),
  ],
});

The result that we get is a new visualization that takes the appearance of the original New York Times piece and applies it to our data.

A scatterplot visualization of penguins.

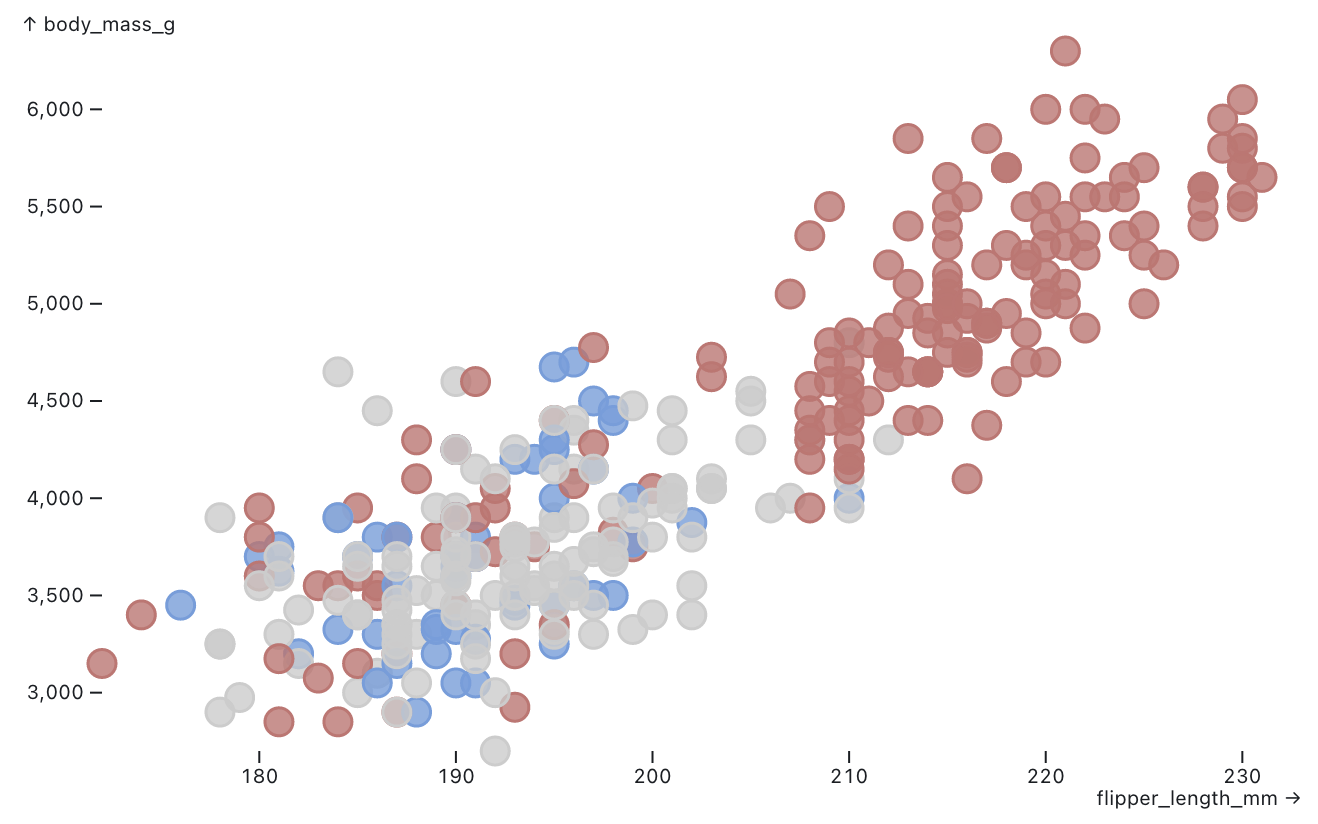
In this way, reviz allows end users to quickly experiment with seeing their data in the form of a visualization they encounter anywhere in the wild.

To see more examples of the partial programs reviz generates, check out our examples site. To understand how reviz works at a deeper level, consider reading our paper.

Supported Visualization Types

reviz is restricted to only work on a small subset of visualization types. We hope to extend reviz to include more visualization types in the future.

Visualization Type Description
Bar Chart Old trusty. The bar chart represents data values using the height of each rect mark. The data values mapped to the x-axis must be discrete, not continuous.
Bubble Chart The bubble chart is similar to the scatterplot, with the radius of each circle mark mapped to the square root of a data value.
Histogram Similar to a bar chart, but the data values mapped to the x-axis must be continuous, not discrete. Histograms are typically used to visualize distributions in a dataset.
Scatterplot The scatterplot places circle marks in an x-y coordinate plane, often to show a correlation between two variables.
Stacked Bar Chart A dressed up version of the bar chart in which subcategories of data can be compared across groups.
Strip Plot Many rows of circle marks are placed on the same continous scale to visualize distributions in a dataset.

reviz's People

Contributors

parkerziegler avatar renovate[bot] avatar sybelblue avatar

Stargazers

 avatar  avatar  avatar  avatar  avatar  avatar  avatar  avatar  avatar  avatar  avatar  avatar  avatar  avatar  avatar  avatar  avatar  avatar  avatar  avatar  avatar  avatar  avatar  avatar  avatar  avatar  avatar  avatar  avatar  avatar  avatar  avatar  avatar  avatar  avatar  avatar  avatar  avatar  avatar  avatar  avatar  avatar  avatar  avatar  avatar  avatar  avatar  avatar  avatar  avatar  avatar  avatar  avatar  avatar  avatar  avatar  avatar  avatar  avatar  avatar  avatar  avatar  avatar  avatar  avatar  avatar

Watchers

 avatar  avatar

reviz's Issues

extension: Separate UI into Analyze and Visualize tabs.

A core part of reviz's premise is that users can not only analyze existing visualizations but also generate new visualizations by filling program holes with column names. Given this vision, we want to separate the extension UI into separate Analyze and Visualize tabs. The current content of the extension will fall into the Analyze tab. The Visualize tab will host, at a minimum, a Code Mirror editor for the partial program and an output space to render the new visualization.

For this issue, the scope is to:

  • Use @radix-ui/react-tabs to split the UI into separate Analyze and Visualize tabs.
  • Add the scaffolding for the Code Mirror editor filled with the partial program.

feat: Execute program on ⌘ / ^ S and ⌘ / ^ Enter.

To speed up program execution in the Visualize tab, we'll want to add keyboard event handlers for executing the program. In particular, we'll want to add ⌘ / ^ S to match a traditional "save" reflex and ⌘ / ^ Enter to match behavior on Observable. To do this, we'll want to wire up event handlers to the CodeMirror editor using the static EditorView.domEventHandlers API.

  • Add event listener for ⌘ / ^ S and ⌘ / ^ Enter using EditorView.domEventHandlers API.
  • Display the proper altering key (either ⌘ or ^) depending on the OS detected in navigator.userAgent.

feat: Render data in a grid on upload.

In #9, we added support allowing users to upload data to the extension. Now, we need to make that data visible. To do so, we'll introduce a new DataGrid component. For the first crack at implementation, we'll use @tanstack/react-table. The core requirements of the table are:

  • Handle both CSV and JSON.
    • Handle CSV with and without header rows.
    • Handle JSON parsed as an Object rather than an Array.
  • Virtualized rendering to accommodate (potentially) very large datasets.
  • Sorting by columns.

We'll defer any work on filtering until we have more evidence that it's a core need.

fix: Improve rendering of program output to fit window dimensions.

Currently, the rendering of program output is a bit wonky. For example, notice below how the visualization doesn't expand to fill the available width and is far too tall for the container.

image

Fortunately, Plot allows us to specify manual widths and heights of plots. We can take advantage of this by passing along the clientWidth and clientHeight properties of the containing DOM node to the invisible iframe where the plot is rendered. This should ensure we get nicely-sized plots for the program output.

In addition to the above, the following improvements should be in scope for this issue:

  • Add an event listener to trigger program runs on Shift + Enter, Cmd + S, and Ctrl + S.
  • Show a program as "stale" by lighting up its Execute button (á la Observable).
    • Addressed in #19.
  • Debug and address any issues around tick marks; we're currently rendering far too many tick marks.

feat: Render program output.

As part of the Visualize portion of the extension interface, we need to render the output generated by filling holes in the partial program. Doing this has some quirks in the context of an extension because we can't use the Function constructor to evaluate code; it violates the unsafe-eval portion of the extension's Content Security Policy. As an alternative, we'll use a "sandbox" page to run the user's program against their uploaded data in an isolated environment. Finally, we'll send the serialized HTML of the resulting visualization back to the extension's DevTools panel for rendering.

The core parts of the implementation include:

  • Adding a "sandbox" page to the extension.
  • Rendering this "sandbox" page in an invisible iframe.
  • Sending the filled program and data to the sandbox page and executing the program. This will involve use of iframe.contentWindow.postMessage.
  • Sending the resulting serialized HTML back to the extension main thread, again using postMessage.

Dependency Dashboard

This issue lists Renovate updates and detected dependencies. Read the Dependency Dashboard docs to learn more.

Rate-Limited

These updates are currently rate-limited. Click on a checkbox below to force their creation now.

  • chore(deps): update dependency @types/chrome to ^0.0.266
  • chore(deps): update dependency autoprefixer to v10.4.19
  • chore(deps): update dependency prettier-plugin-tailwindcss to v0.5.14
  • chore(deps): update dependency tailwindcss to v3.4.3
  • chore(deps): update dependency typescript to v5.4.5
  • chore(deps): update dependency eslint-config-next to v14.2.3
  • chore(deps): update dependency eslint to v9
  • chore(deps): update dependency eslint-plugin-jest to v28
  • 🔐 Create all rate-limited PRs at once 🔐

Open

These updates have all been created already. Click a checkbox below to force a retry/rebase of any.

Ignored or Blocked

These are blocked by an existing closed PR and will not be recreated unless you click a checkbox below.

Detected dependencies

npm
package.json
  • @typescript-eslint/eslint-plugin ^7.0.0
  • @typescript-eslint/parser ^7.0.0
  • eslint ^8.57.0
  • eslint-config-next ^14.0.0
  • eslint-config-prettier ^9.0.0
  • eslint-plugin-import ^2.27.5
  • eslint-plugin-jest ^27.9.0
  • lerna ^8.0.0
  • prettier ^3.2.5
  • prettier-plugin-tailwindcss ^0.5.11
  • yarn 1.22.21
packages/compiler/package.json
  • lodash.camelcase ^4.3.0
  • lodash.groupby ^4.6.0
  • lodash.orderby ^4.6.0
  • @observablehq/plot ^0.6.9
  • @sucrase/jest-plugin ^3.0.0
  • @types/jest ^29.5.12
  • @types/lodash.camelcase ^4.3.7
  • @types/lodash.chunk ^4.2.7
  • @types/lodash.groupby ^4.6.7
  • @types/lodash.orderby ^4.6.7
  • @types/node ^18.16.1
  • esbuild ^0.20.0
  • jest ^29.7.0
  • jest-environment-jsdom ^29.7.0
  • lodash.chunk ^4.2.0
  • rimraf ^5.0.1
  • typescript ^5.1.6
packages/extension/package.json
  • @codemirror/lang-javascript ^6.1.9
  • @codemirror/language ^6.10.1
  • @codemirror/view ^6.25.1
  • @lezer/highlight ^1.2.0
  • @observablehq/plot ^0.6.9
  • @radix-ui/react-tabs ^1.0.4
  • @radix-ui/react-tooltip ^1.0.6
  • @tanstack/react-table ^8.9.3
  • classnames ^2.3.2
  • codemirror ^6.0.1
  • d3-dsv ^3.0.1
  • prettier ^3.2.5
  • react ^18.2.0
  • react-dom ^18.2.0
  • @types/chrome ^0.0.263
  • @types/d3-dsv ^3.0.1
  • @types/react ^18.2.62
  • @types/react-dom ^18.2.19
  • @vitejs/plugin-react ^4.0.1
  • autoprefixer ^10.4.14
  • postcss ^8.4.24
  • tailwindcss ^3.3.2
  • typescript ^5.1.6
  • vite ^5.0.0
packages/ui/package.json
  • classnames ^2.3.2
  • prism-react-renderer ^2.0.6
  • @types/react ^18.2.62
  • @types/react-dom ^18.2.19
  • esbuild ^0.20.0
  • rimraf ^5.0.1
  • typescript ^5.1.6
  • react ^18.2.0
  • react-dom ^18.2.0

  • Check this box to trigger a request for Renovate to run again on this repository

infra: Migrate to a monorepo using lerna.

With the addition of the Chrome extension for reviz, we now have three separate repositories—reviz itself, the reviz docs, and the Chrome extension. Moreover, both the docs and the Chrome extension rely on reviz and should ideally be published with them directly. Given these interdependencies, it makes sense to shift to a monorepo.

We'll use lerna as our monorepo management tool. lerna is actively maintained and has a long history as the primary tool for monorepo development in JavaScript.

For the scope of this issue, we should accomplish the following:

  • Split the primary repo, docs, and extension into separate packages.
  • Ensure docs and extension can reference the core package, which we'll name something like core.
  • Configure CI to run reviz unit tests, deploy docs, and build the extension.
  • Centralize linting configuration.
  • Look for opportunities to share React components across the docs and extension.

Recommend Projects

  • React photo React

    A declarative, efficient, and flexible JavaScript library for building user interfaces.

  • Vue.js photo Vue.js

    🖖 Vue.js is a progressive, incrementally-adoptable JavaScript framework for building UI on the web.

  • Typescript photo Typescript

    TypeScript is a superset of JavaScript that compiles to clean JavaScript output.

  • TensorFlow photo TensorFlow

    An Open Source Machine Learning Framework for Everyone

  • Django photo Django

    The Web framework for perfectionists with deadlines.

  • D3 photo D3

    Bring data to life with SVG, Canvas and HTML. 📊📈🎉

Recommend Topics

  • javascript

    JavaScript (JS) is a lightweight interpreted programming language with first-class functions.

  • web

    Some thing interesting about web. New door for the world.

  • server

    A server is a program made to process requests and deliver data to clients.

  • Machine learning

    Machine learning is a way of modeling and interpreting data that allows a piece of software to respond intelligently.

  • Game

    Some thing interesting about game, make everyone happy.

Recommend Org

  • Facebook photo Facebook

    We are working to build community through open source technology. NB: members must have two-factor auth.

  • Microsoft photo Microsoft

    Open source projects and samples from Microsoft.

  • Google photo Google

    Google ❤️ Open Source for everyone.

  • D3 photo D3

    Data-Driven Documents codes.