Git Product home page Git Product logo

oxyplot-xamarin's Introduction

OxyPlot is a cross-platform plotting library for .NET

License Build status

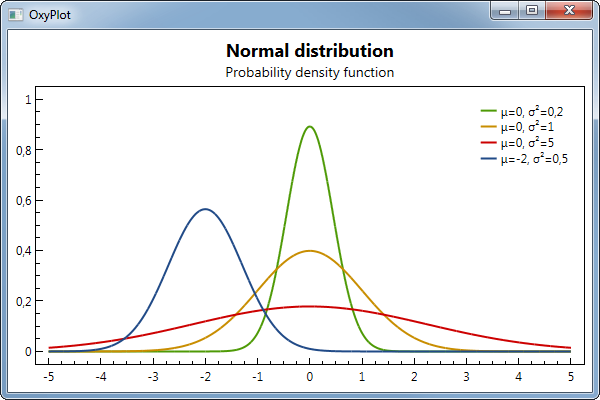
Plot

Getting started

  1. Use the NuGet package manager to add a reference to OxyPlot (see details below if you want to use pre-release packages)
  2. Add a PlotView to your user interface
  3. Create a PlotModel in your code
  4. Bind the PlotModel to the Model property of your PlotView

Examples

You can find examples in the /Source/Examples folder in the code repository.

NuGet packages

The latest pre-release packages are pushed by AppVeyor CI to myget.org. To install these packages, set the myget.org package source https://www.myget.org/F/oxyplot and remember the "-pre" flag.

The stable release packages will be pushed to nuget.org. Note that we have have a lot of old (v2015.*) and pre-release packages on this feed, and sometimes these show up even if they are unlisted.

See the wiki for information about the available packages.

More information

Contribute

See Contributing for information about how to contribute!

oxyplot-xamarin's People

Contributors

andrii-borysov-me avatar bblanchon avatar chaselal avatar davidwong avatar dependabot[bot] avatar dimitrijevic avatar dsyme avatar geertvanhorrik avatar gitter-badger avatar gotoh avatar h2onacl avatar happypig375 avatar janusw avatar jeremyiverson avatar justslon avatar kfpulver avatar mattleibow avatar memphiz avatar objorke avatar ocoanet avatar pltaylor avatar rbaverstock avatar scastria avatar sevoku avatar shoelzer avatar svendu avatar tclaff avatar thealmightybob avatar tibel avatar tr8dr avatar

Stargazers

 avatar  avatar  avatar  avatar  avatar  avatar  avatar  avatar  avatar  avatar  avatar  avatar  avatar  avatar  avatar  avatar  avatar  avatar  avatar  avatar  avatar  avatar  avatar  avatar  avatar  avatar  avatar  avatar  avatar  avatar  avatar  avatar  avatar  avatar  avatar  avatar  avatar  avatar  avatar  avatar  avatar  avatar  avatar  avatar  avatar  avatar  avatar  avatar  avatar  avatar  avatar  avatar  avatar  avatar  avatar  avatar  avatar  avatar  avatar  avatar  avatar  avatar  avatar  avatar

Watchers

 avatar  avatar  avatar  avatar  avatar  avatar  avatar  avatar  avatar  avatar  avatar  avatar  avatar  avatar

oxyplot-xamarin's Issues

OxyPlot.Xamarin.Forms support for MacOS

Xamarin.Forms now runs also on Macs, but there does not seem to be any support for this in OxyPlot.Xamarin.Forms, and no way to initialise the renderer. Is there any chance that this will be get updated/implemented?

Is Windows 8.1 supported?

Is there an intention to support Windows 8.1 from Xamarin Forms? Unfortunately we are stuck on Windows 8.1 for the time being.
The software on here currently has a Windows 8.1 project but doesn't have any OxyPlot references and so fails when run.
Just asking for information. Thanks.

SimpleDemo UWP release not showing?

Is it just me or is the OxyPlot in Release configuration of the SimpleDemo app on Universal Windows Platform not showing up?
It shows up fine in Debug?
TIA

EDIT: Looking at output, two System.IO.FileNotFoundExceptions are thrown trying to access some System.Private.Reflection.Core stuff, but probably caught as they don't cause the app to crash...my guess...something gets funky during .net optimizer work and might probably be patched using some directives in the rd.xml file of the universal dll, but I can't figure out why the OxyPlot project's been split since that surely can't help locating what should be fixed...strangely, non-Xamarin SimpleDemo10 works?

Bar chart inside a ListView control

Steps to reproduce

  1. Add a ListView to your ContentPage.
  2. Create a list of PlotModels to your page for binding to the ListView.
  3. Now use a Template/ ViewCell having PlotView to the ListView.

Platform: Xamarin Forms (Cross-Platform)
.NET version: 4.0

Expected behaviour

While loading the ContentPage, the ListView should load the data based on the PlotModels provided.

Actual behaviour

Everything is running smooth in Android. But the problem is I am getting a error "PlotModel is already in use by some other PlotView control" when I am trying to run it on IPhone.

//My content page
public MyConstructor()
{
	List<MyChart> charts = new List<MyChart>();
	charts.Add(new MyChart { PlotModel = PlotModel1 });
	charts.Add(new MyChart { PlotModel = PlotModel2 });
	charts.Add(new MyChart { PlotModel = PlotModel3 });
	charts.Add(new MyChart { PlotModel = PlotModel4 });
	ListView lvPlots = new ListView(ListViewCachingStrategy.RetainElement)
	{
		ItemsSource = charts,
		ItemTemplate = new DataTemplate(typeof(NewDashboardSubCell)),
		HasUnevenRows = true
	};
	Content = lvPlots;
}

public class MyChart
{
       public MyPlotModel PlotModel { get; set; }
}


//My View Cell

public class NewDashboardSubCell : ViewCell
{
        PlotView plotView;
        public NewDashboardSubCell()
        {
            try
            {
                plotView = new PlotView
                {
                    HorizontalOptions = LayoutOptions.FillAndExpand,
                    VerticalOptions = LayoutOptions.FillAndExpand,
                    IsVisible = true,
                    IsEnabled = true,
                    HeightRequest = App.ScreenHeight - 100,
                    WidthRequest = App.ScreenWidth - 40
                };

                plotView.SetBinding(PlotView.ModelProperty, "PlotModel");

                View = plotView;                
            }
            catch (Exception ex)
            {
            }
	}
}

Code.txt

HeatMapRenderMethod enum missing

Hello everybody!

I'm recently using OxyPlot in Xamarin iOS & Xamarin.Android, and I've downloaded the package via Nuget:
Package: OxyPlot for Mobile Devices (Windows Store/Windows Phone/Android/iOS
Identifier: Oxyplot.Mobile
Version: 2015.1.744-alpha

I'm trying to run this example:
http://docs.oxyplot.org/en/latest/models/series/HeatMapSeries.html#example-linear-bitmap

BUT im getting errror in this line:
RenderMethod = HeatMapRenderMethod.Rectangles,

I checked the Namespace, i notice that the HeatMapRenderMethod enum is missing and the HeatMapSeries class not have a RenderMethod at least in mobile version.

Anyone? Thanks

AbsoluteMinimum AbsoluteMaximum AreaSeries different behavior on Android and iOS Xamarin Forms

Steps to reproduce

Sample solution: https://drive.google.com/file/d/0B8YvbPIswXQ4aklmYU0xaXR1Yjg/view?usp=sharing

The gist is to plot an AreaSeries that has endpoints defined outside of the X-axis's minimum and maximum values. If AbsoluteMinimum and AbsoluteMaximum are set on the X-axis, then the series will be filled on iOS, but not on Android.

  1. Create a plot with a TimeSpanAxis and a LinearAxis. Set Minimum, Maximum, AbsoluteMinimum, and AbsoluteMaximum value on the TimeSpanAxis and Minimum and Maximum on the LinearAxis.
  2. Add an AreaSeries to the plot. Add two DataPoints to the AreaSeries, one with X less than the TimeSpanAxis's Minimum and one with X greater than the TimeSpanAxis's Maximum. Set Y values on the DataPoints. Set a fill color.
  3. Render the plot in a PlotView.

Platform: Xamarin.Forms Android and iOS
.NET version: 4.5

Expected behaviour

The area series should be filled.

Actual behaviour

The area series is filled on iOS, but not on Android.

Android:
android

iOS:
ios

Renderer not initialized

IOS 10.3
Xamarin Forms 2.3.4.247

design view show this error;

screen shot 2017-06-29 at 4 25 06 pm

i have already placed initialization line in appdelegate.cs

                public override bool FinishedLaunching(UIApplication app, NSDictionary options)
		{			global::Xamarin.Forms.Forms.Init();
			OxyPlot.Xamarin.Forms.Platform.iOS.PlotViewRenderer.Init();	
			return base.FinishedLaunching(app, options);
		}

Axis lines and series lines disappear when chart width goes beyond certain value

Problem with Oxyplot on Xamarin forms Android :

i have line chart in a scroll view (With horizontal scroll). chart width is set using "WidthRequest" binding (MVVM) in xaml. i am updating width of the chart based on number of data points (e.g number of data points * 25)

following piece of code shows my chart binding:

<ScrollView Orientation="Horizontal" HorizontalOptions="FillAndExpand"> <oxy:PlotView Model="{Binding PlotModel}" WidthRequest="{Binding ChartWidth}" /> </ScrollView>

this line chart has 3 line series with line style solid and axis line style solid.

everything work well (chart is drawn correct, lines are displayed, axis lines are displayed, chart scrolls), until chart width goes beyond certain value (when data points increase over the time).

on android device (Xiomi Redmi 2 Prime), after width crosses 2475 points, series lines and axis lines disappear (data points are still shown, scroll works perfect, just series lines and axis lines disappear) .

i did test on different android devices and noticed that lines disappear at different widths on different devices (not fixed 2475 points).

following are couple of screens:
http://www.screencast.com/t/8p8AC5KWokw
http://www.screencast.com/t/XOkZ51nIQB

i would really appreciate any help, i will try and create a demo project and submit a link with this
problem.

Missing constructor (IntPtr,JniHandleOwnership) in Android.PlotView

Strange. I just updated to XF 2.2 now that both OxyPlot and DevExpress supports it. I ran into a new issue on Android.

My app needs to be able to tap on an OxyPlot and get plot objects that were tapped. Since this isn't builtin, I extended PlotView like this:

public class TapPlotView : PlotView
{
    public static BindableProperty DrillDownCommandProperty = BindableProperty.Create<TapPlotView, ICommand>(x => x.TapCommand,
        null,
        BindingMode.OneWay
    );
    public ICommand TapCommand {
        get { return (ICommand)GetValue(DrillDownCommandProperty); }
        set { SetValue(DrillDownCommandProperty, value); }
    }

    public void OnItemTapped(IEnumerable<HitTestResult> results)
    {
        if (TapCommand != null)
            TapCommand.Execute (results);
    }
}

I then implemented Renderers for both iOS and Android. iOS renderer adds a TapGestureRecognizer and works fine. However, my Android renderer:

public class TapPlotViewRenderer : PlotViewRenderer
{
    private const int HIT_TOLERANCE = 15;

    protected override void OnElementChanged (ElementChangedEventArgs<PlotView> e)
    {
        base.OnElementChanged (e);
        if (Control != null) {
            Control.Touch += delegate(object sender, TouchEventArgs tea) {
                //Don't steal touch event which prevents pan/zoom
                tea.Handled = false;
                double scale = OxyPlot.Xamarin.Android.PlotView.Scale;
                if(tea.Event.Action != MotionEventActions.Down)
                    return;
                IEnumerable<HitTestResult> results = Control.Model.HitTest(new HitTestArguments(new ScreenPoint(tea.Event.GetX() / scale,tea.Event.GetY() / scale),HIT_TOLERANCE));
                ((TapPlotView)Element).OnItemTapped(results);
            };
        }
    }
}

is failing with XF2.2 complaining about "Missing constructor (IntPtr,JniHandleOwnership) in Android.PlotView". My google searches says this means something else is bad. Strange that this worked fine on Android for XF2.1.

I wonder if OxyPlot had builtin support for Tapping on a plot would cause this issue to go away.

Pan and Zoom not working

Hi all,

I have a problem with my plotview in Xamarin forms, i see it but when i try to pan or zomm on it, it's not work.

This is my code in C#:

        var model = new PlotModel { Title = "Hello, Forms!", PlotAreaBorderColor = OxyColors.Transparent };

        var BottomAxis = new TimeSpanAxis();
        BottomAxis.Position = AxisPosition.Bottom;
        model.PlotAreaBorderThickness = new OxyThickness(0, 0, 0, 0);
        BottomAxis.IntervalLength = TimeSpanAxis.ToDouble(new TimeSpan(1,0,0));

        var LeftAxis = new LinearAxis();
        LeftAxis.Position = AxisPosition.Left;
        LeftAxis.Minimum = 0d;
        LeftAxis.Maximum = 50d;
        var myController = new PlotController();
        plotview.Controller = myController;
        
        model.Axes.Add(LeftAxis);
        model.Axes.Add(BottomAxis);

        var Serie = new LineSeries();
        Serie.Points.Add(new DataPoint(TimeSpanAxis.ToDouble(DateTime.Now.TimeOfDay.Subtract(new TimeSpan(0, 0, 20))),10d ));
        Serie.Points.Add(new DataPoint(TimeSpanAxis.ToDouble(DateTime.Now.TimeOfDay.Subtract(new TimeSpan(0, 3, 20))),55d ));
        Serie.Points.Add(new DataPoint(TimeSpanAxis.ToDouble(DateTime.Now.TimeOfDay.Subtract(new TimeSpan(0, 4, 20))),15d ));

        model.Series.Add(Serie);
        plotview.Model = model;

And this is View on XAML:

<oxy:PlotView x:Name="plotview" VerticalOptions="FillAndExpand" HorizontalOptions="FillAndExpand" Grid.Row="0" Grid.Column="1" Grid.ColumnSpan="3"/>

Any idea for resolve that?

Thanks in advance

Unable to scroll page when adding OxyPlot to ContentPage

Steps to reproduce

  1. Create a cross-platform (Xamarin Pages) project in VS 2015 with 4.0 Framework.
  2. Now add multiple charts to your ContentPage. And Add guester listeners to few charts.
  3. Now try to launch your app on IOS devices either Iphone or Ipad.
  4. Now try to scroll the page.
  5. At-least try to perform tap on the charts those are having tap guster listeners.

Platform: Xamarin.Forms
.NET version: 4.0

Expected behaviour

Page should scroll and can perform tapping operations which are working smooth in Android.

Actual behaviour

Unable to scroll the page. Or even Can't perform click operations on charts.

Error During Compile

Hi,

I have OxyPlot.Xamarin.Andriod (v1.0.0-unstable1983) installed with OxyPlot.Core (v2015.1.708-alpha)

When I compile the sample code I get the following Error. Please help.

Unable to resolve interface type 'OxyPlot.IPlotView'. Are you missing an assembly reference?

The element 'LinearLayout' has invalid child element 'OxyPlot.Xamarin.Android.PlotView'.

I am using Visual Studio 2015 Update 3 with Xamarin 4.1.1.3.

TapGestureRecognizer not working for IOS

I'm using OxyPlot.Xamarin.Forms 1.0.0, Xamarin.Forms 2.4.0.38779.
TapGestureRecognizer does work for Android, but it doesn't for IOS.
Also please update the documentation, it's severely lacking or I am looking in the wrong place, but there is nothing to find about e.g. HandleGesture

<oxy:PlotView Model="{Binding PlotModel}" VerticalOptions="FillAndExpand" HorizontalOptions="FillAndExpand" > <View.GestureRecognizers> <TapGestureRecognizer Command="{Binding Source={x:Reference GraphPage}, Path=BindingContext.toggleLegend}" CommandParameter="{Binding .}"/> </View.GestureRecognizers> </oxy:PlotView>

Missing ticks and tick labels on DateTimeAxis

Hey everybody!

I'm having a weird issue with ticks and tick labels on a DateTimeAxis.
With most of the data everything is working fine, but with some data neither ticks nor labels are rendered although its the same code. No errors whatsoever.

I'm using the 1.0.0 release NuGet package on Xamarin.Forms 2.3.3.180.

If it helps anything here is a data set that does not render correctly:
[0] {42747,5478548611 4,54493808746338} OxyPlot.DataPoint
[1] {42747,5471228299 5,50381946563721} OxyPlot.DataPoint
[2] {42747,5465667824 4,02142429351807} OxyPlot.DataPoint
[3] {42747,5457809317 6,08734893798828} OxyPlot.DataPoint
[4] {42747,531548235 4,56216859817505} OxyPlot.DataPoint
[5] {42747,5309475984 4,28897380828857} OxyPlot.DataPoint
[6] {42747,5303068866 3,35946083068848} OxyPlot.DataPoint
[7] {42747,5296827257 4,86148357391357} OxyPlot.DataPoint
[8] {42747,5289272859 2,85382986068726} OxyPlot.DataPoint

My plot model looks like this:

plotModel = new PlotModel ();
      plotModel.Axes.Add (new DateTimeAxis {
        Position = AxisPosition.Bottom,
        Unit = "Datum",
        IntervalType = DateTimeIntervalType.Days,
        MinimumMajorStep = 1,
        AbsoluteMinimum = dataPoints.Min (m => m.X) - 1,
        Maximum = dataPoints.Max (m => m.X),
        Minimum = dataPoints.OrderByDescending (o => o.X).Take (7).Last ().X,
        AbsoluteMaximum = dataPoints.Max (m => m.X) + 1,
        StringFormat = "dd.MM."
      });
      plotModel.Axes.Add (new LinearAxis {
        Position = AxisPosition.Left,
        AbsoluteMinimum = 0,
        Minimum = 1,
        Maximum = 9,
        AbsoluteMaximum = 10,
        IsPanEnabled = false,
        IsZoomEnabled = false
      });
      plotModel.Series.Add (new LineSeries {
        ItemsSource = dataPoints,
        Color = Color.FromHex (Constants.Color.Accent).ToOxyColor (),
        MarkerType = MarkerType.Cross,
        MarkerFill = Color.FromHex (Constants.Color.Primary).ToOxyColor (),
        MarkerStroke = Color.FromHex (Constants.Color.Primary).ToOxyColor (),
        MarkerStrokeThickness = 1,
      });

Any ideas? Thanks in advance :-)

Cheers

David

MouseDown event does not fire on Xamarin Mac graph points

I am trying to implement a handling clicks on points marked on the graph in Xamarin Mac application. However, the MouseDown event is never call when a point displayed on the graph is clicked.
The same code works fine on Windows version of the same application.

var pointAnnotation = new LineSeries
{
Title = GetYAxisName(graphType),
StrokeThickness = 0,
LineLegendPosition = LineLegendPosition.None,
MarkerFill = OxyColors.DarkTurquoise,
MarkerStroke = OxyColors.DarkTurquoise,
MarkerType = MarkerType.Circle,
TrackerKey = "Calculations",
MarkerSize = 5
};

/// Adding points in the loop
pointAnnotation.Points.Add(new DataPoint((double)valueX, (double)valueY);
//

//adding event handler
pointAnnotation.MouseDown += (s, e) =>
{
if (e.ChangedButton == OxyMouseButton.Left)
{
e.Handled = true;
}
};

Change plot Actual size

Hi! I'm using oxyplot in xamarin.android and the screen is too small to contain the plot.
is there any way I can fix it?

How to install from nuget (UWP)

Are there instructions how to install OxyPlot for Xamarin.Forms for UWP platform?

This is what I tried, without success:
I installed OxyPlot.Xamarin.Forms v1.0.0-unstable1983 to both portable and UWP project of my Xamarin.Forms solution. Then I tried to install OxyPlot.Windows v1.0.0 to UWP project of my Xamarin.Forms solution, but got this error:

Version conflict detected for OxyPlot.Core. 
 BlankAppXamlXamarinForms.UWP (>= 1.0.0) -> OxyPlot.Windows (>= 1.0.0) -> OxyPlot.Core (= 1.0.0) 
 BlankAppXamlXamarinForms.UWP (>= 1.0.0) -> OxyPlot.Xamarin.Forms (>= 1.0.0-unstable1983) -> OxyPlot.Core (= 1.0.0-unstable1983).

UILongPressGestureRecognizer & UITapGestureRecognizer don't work just on iPhone 7

The UILongPressGesture & UITapGestureRecognizer won't be triggered on Oxyplot (PlotView) in iPhone 7 (iOS 10.3.2) though it works on all other iOS devices and even on iPhone 7 simulator.

I also made sure it's not an issue of the touch duration or the state of touch.

It is observed that they work when the default PanZoomGestureRecognizer is removed from the PlotView but that will disable the pan and zoom gestures of the plot. This can be seen by uncommenting the commented part of the code below.

using System;
using OxyPlot;
using OxyPlot.Axes;
using OxyPlot.Series;
using OxyPlot.Xamarin.iOS;    
using UIKit;

namespace longpress.iOS
{
  public partial class ViewController : UIViewController
  {
    public ViewController(IntPtr handle) : base(handle)
    {
    }

    public override void ViewDidLoad()
    {
        base.ViewDidLoad();

        var plotView = new PlotView
        {
            Model = CreatePlotModel(),
            Frame = this.View.Frame
        };
        View.AddSubview(plotView);

        //foreach (UIGestureRecognizer recognizer in plotView.GestureRecognizers)
        //{
        //    if (recognizer is PanZoomGestureRecognizer)
        //    {
        //        plotView.RemoveGestureRecognizer(recognizer);
        //    }
        //}

        plotView.AddGestureRecognizer(new UILongPressGestureRecognizer((obj) => { Console.WriteLine("LongPress triggered"); }));
        plotView.AddGestureRecognizer(new UITapGestureRecognizer((obj) => { Console.WriteLine("Tap triggered"); }));
    }

    public override void DidReceiveMemoryWarning()
    {
        base.DidReceiveMemoryWarning();
        // Release any cached data, images, etc that aren't in use.		
    }

    private PlotModel CreatePlotModel()
    {

        var plotModel = new PlotModel { Title = "OxyPlot Demo" };

        plotModel.Axes.Add(new LinearAxis { Position = AxisPosition.Bottom });
        plotModel.Axes.Add(new LinearAxis { Position = AxisPosition.Left, Maximum = 10, Minimum = 0 });

        var series1 = new LineSeries
        {
            MarkerType = MarkerType.Circle,
            MarkerSize = 4,
            MarkerStroke = OxyColors.White
        };

        series1.Points.Add(new DataPoint(0.0, 6.0));
        series1.Points.Add(new DataPoint(1.4, 2.1));
        series1.Points.Add(new DataPoint(2.0, 4.2));
        series1.Points.Add(new DataPoint(3.3, 2.3));
        series1.Points.Add(new DataPoint(4.7, 7.4));
        series1.Points.Add(new DataPoint(6.0, 6.2));
        series1.Points.Add(new DataPoint(8.9, 8.9));

        plotModel.Series.Add(series1);

        return plotModel;
    }
 }
}

However, there is no explanation as to why this happens on no other device but iPhone 7.

Increasing TitleFontSize on Axis overlaps the axis labels

If I set TitleFontSize = 24 on the axis, the title overlaps the tick labels. At commit 24ac93a. Using Xamarin.Forms on Android.

Xamarin.Forms version 2.2.0.45
Android SDK: 23 rev 3
Device: Motorola Nexus 6 running Android 6.0.

Sample code:

       var plotModel = new PlotModel { Title = $"Last {list.Count - i} Trips", TitleFontSize = 48 };

        CategoryAxis bottomAxis = new CategoryAxis { Position = AxisPosition.Bottom, Title = "Trip", TitleFontSize = 36, IsPanEnabled = false, IsZoomEnabled = false, GapWidth = 0.2 };
        plotModel.Axes.Add(new LinearAxis { Position = AxisPosition.Left, Maximum = 100, Minimum = 0, Title = "Score", TitleFontSize = 36, IsPanEnabled = false, IsZoomEnabled = false });
        plotModel.Axes.Add(bottomAxis);

        var series1 = new ColumnSeries() { StrokeThickness = 0 };

        string[] dates = new string[list.Count - i];

        while (i < list.Count)
        {                
            dates[series1.Items.Count] = list[i].StartTime;
            series1.Items.Add(new ColumnItem { Value = list[i].Score * 100});
            i++;
        }

        bottomAxis.ItemsSource = dates;
        plotModel.Series.Add(series1);

Example image attached.
screenshot_20160610-125137

Charts dont display on Xamarin Forms UWP

Steps to reproduce

  1. Create a new Xamarin Forms Blank App
  2. Add OxyPlot libraries via Nuget (Oxyplot.Xamarin.Forms) as per documentation
  3. Add initialization code to each project as per the documentation
  4. Generate a graph data using the code behind and bind to it in the XAML. e.g.
<?xml version="1.0" encoding="utf-8" ?>
<ContentPage xmlns="http://xamarin.com/schemas/2014/forms"
             xmlns:x="http://schemas.microsoft.com/winfx/2009/xaml"
             xmlns:oxy="clr-namespace:OxyPlot.Xamarin.Forms;assembly=OxyPlot.Xamarin.Forms"
             xmlns:local="clr-namespace:OxyPlotTestApp"
             x:Class="OxyPlotTestApp.MainPage">

    <AbsoluteLayout>
        <oxy:PlotView Model="{Binding PieModel}" AbsoluteLayout.LayoutBounds="20,0,.9,.9" 
                      AbsoluteLayout.LayoutFlags="WidthProportional,HeightProportional" />
    </AbsoluteLayout>

</ContentPage>
namespace OxyPlotTestApp
{
    public class PieViewModel
    {
        public PlotModel PieModel { get; set; }

        public PieViewModel()
        {
            PieModel = CreatePieChart();

        }

        private PlotModel CreatePieChart()
        {
            var model = new PlotModel { Title = "World Population By Content" };
            var ps = new PieSeries
            {
                StrokeThickness = .25,
                InsideLabelPosition = 0.25,
                AngleSpan = 360,
                StartAngle = 0
            };
            ps.Slices.Add(new PieSlice("Africa", 1030) { IsExploded = false });
            ps.Slices.Add(new PieSlice("Americas", 929) { IsExploded = false });
            ps.Slices.Add(new PieSlice("Asia", 4157));
            ps.Slices.Add(new PieSlice("Europe", 739) { IsExploded = false });
            ps.Slices.Add(new PieSlice("Oceania", 35) { IsExploded = false });
            model.Series.Add(ps);
            return model;
        }

    }
    public partial class MainPage : ContentPage
    {
        public PieViewModel vm { get; set; }
        public MainPage()
        {
            InitializeComponent();
            vm = new PieViewModel();
            this.BindingContext = vm;
        }

    }
}
  1. Run the UWP version of the application

Platform: Xamarin Forms UWP
.NET version:

Expected behaviour

Graph should display as per other platforms

Actual behaviour

Nothing is displayed on screen. According to this thread on StackOverflow another user can see this but if they resize the window the chart renders. However, this does not happen for me.

Tested on two machines (custom built desktop and a Surface Pro 4) and experience the same behaviour. Tested on Android, both the emulator and a physical device, and both work as expected, so it would seem to be just the UWP version.

Tons of errors on Resource.Designer.cs after adding OxyPlot to the project

These the steps to reproduce it:

1 - Create a new Blank App (Xamarin.Forms.Portable) on VS 2015 Update 3 (Xamarin 4.2.0.703 and Xamarin.Android 7.0.1.3)

2 - On Nuget Package Manager update Xamarin.Forms to latest version (currently v2.3.3.152-pre2)

3 - Run the application to confirm that everything is working.

4 - Back to Nuget, add a referente of OxyPlot.Xamarin.Forms to both my projects (portable and droid). It installs OxyPlot.Xamarin.Forms and OxyPlot.Xamarin.Android version 1.0.0-unstable1983 and 'OxyPlot.Coreversion2015.1.708-alpha`)

5 - On my Droid project, in MainActivity.cs I add OxyPlot.Xamarin.Forms.Platform.Android.PlotViewRenderer.Init(); after the call to Forms.Init()

6 - Now if I try to compile my application again I have ~150 errors on Resource.Designer.cs:

image

If I remove OxyPlot from the project, the errors go away and the application compiles again.

My target SDK versions are the following:

image

WindowsPhone8.1 Support

I looked nuget definition file,
oxyplot-xamarin/Source/OxyPlot.Xamarin.Forms/OxyPlot.Xamarin.Forms.nuspec.

I could not find for wp81 platform.

% OxyPlot already supports wp80 , so I think it will be done just to add about wp81 platform description in *.nuspec file.... too optimistic?

UWP plotview not showing until resizing

In my case I have 2 situations:

1 My app is in landscape: The plotview is showing
2 My app is in portrait: Plotview not showing until resizing (on PC) or rotate to landscape and back on phone.

If I, as a workaround, could force a SizeChanged event firing without user interaction just after setting the plotview's model, then I think the plotview will show.

ToCGColor() should use sRGB colorspace on iOS

Currently I see a different color on iOS 10 if I use the same hex background color for a chart as another control on the page (e.g. "#25373E"). Using the Srgb color space seems to fix the issue for me.

var space = CoreGraphics.CGColorSpace.CreateSrgb();
var cgColor = new CGColor(space, new nfloat[] { c.R / 255f, c.G / 255f, c.B / 255f, c.A / 255f });
return cgColor;

Setting up chart while invisible does not render when become visible

I have a page that shows either a chart or a spreadsheet view. The user can toggle between the two which just sets the chart visible and spreadsheet invisible or vice versa. When the Xamarin.Forms page is first constructed and the chart plot model is built with LineSeries and stuff, everything works as long as the page is in chart mode with the chart being visible. However, if the page is constructed while in spreadsheet mode, everything is the same as far as the chart goes and the building of the plot model, EXCEPT, the chart is invisible at the time. Therefore, when the user toggles back to chart mode, the chart is blank.

I am guessing that the rendering logic of oxyplot detects that the chart is invisible so it doesn't actually draw anything. However, if it is going to be smart like that, I would also expect it to detect that the chart was just made visible and render the chart.

Am I correct on my assumptions?

Recommend Projects

  • React photo React

    A declarative, efficient, and flexible JavaScript library for building user interfaces.

  • Vue.js photo Vue.js

    🖖 Vue.js is a progressive, incrementally-adoptable JavaScript framework for building UI on the web.

  • Typescript photo Typescript

    TypeScript is a superset of JavaScript that compiles to clean JavaScript output.

  • TensorFlow photo TensorFlow

    An Open Source Machine Learning Framework for Everyone

  • Django photo Django

    The Web framework for perfectionists with deadlines.

  • D3 photo D3

    Bring data to life with SVG, Canvas and HTML. 📊📈🎉

Recommend Topics

  • javascript

    JavaScript (JS) is a lightweight interpreted programming language with first-class functions.

  • web

    Some thing interesting about web. New door for the world.

  • server

    A server is a program made to process requests and deliver data to clients.

  • Machine learning

    Machine learning is a way of modeling and interpreting data that allows a piece of software to respond intelligently.

  • Game

    Some thing interesting about game, make everyone happy.

Recommend Org

  • Facebook photo Facebook

    We are working to build community through open source technology. NB: members must have two-factor auth.

  • Microsoft photo Microsoft

    Open source projects and samples from Microsoft.

  • Google photo Google

    Google ❤️ Open Source for everyone.

  • D3 photo D3

    Data-Driven Documents codes.