Generate common charts with extremely simple functions. Functions return SVG objects which can be customized as needed using D3.js syntax.
bower install d3xter
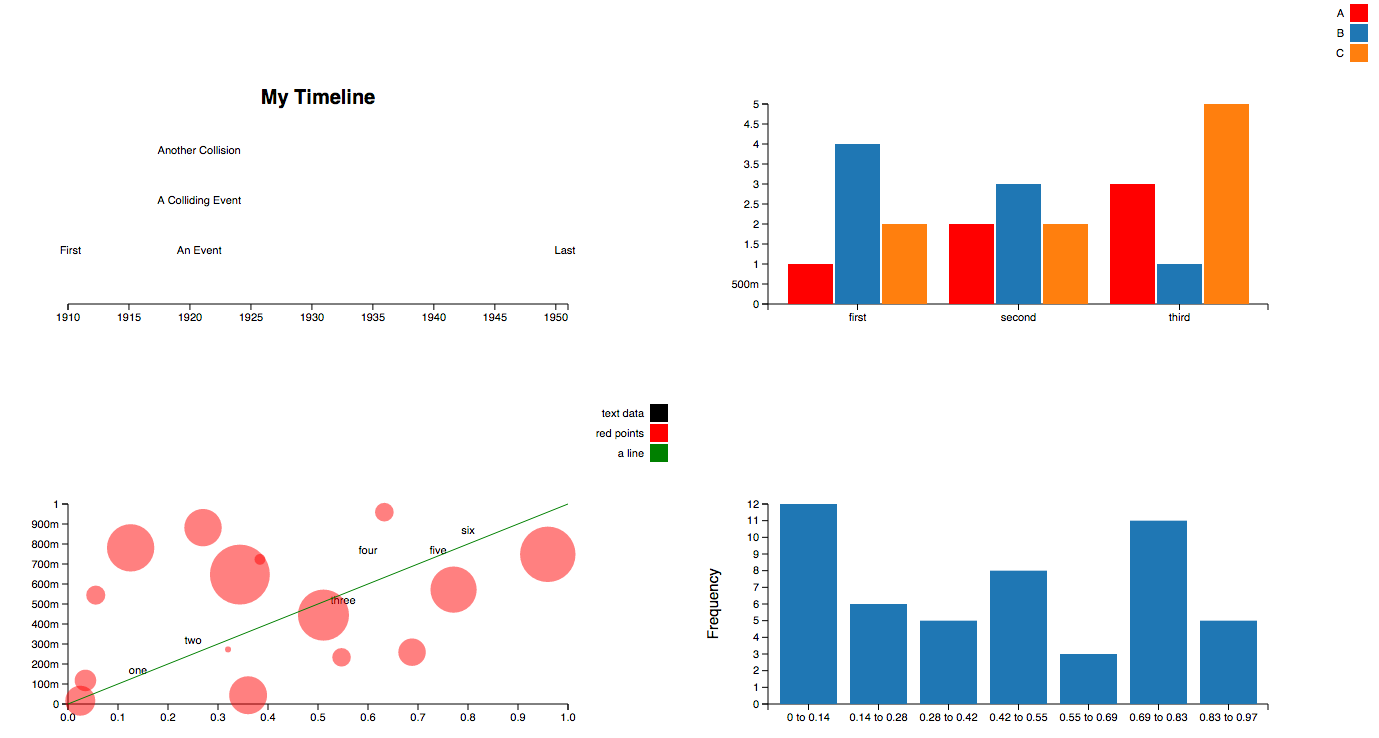
Why use D3xter? Because configuration is optional, charts with sensible defaults can be generated with as little as a single line.
Functions take the data to plot and an optional configuration object.
###Basic Examples (no configuration)
<html>
  <head>
    <script src="bower_components/d3/d3.js" charset="utf-8"></script>
    <script src="bower_components/d3xter/js/lib.js" charset="utf-8"></script>
    <link rel="stylesheet" href="bower_components/d3xter/css/style.css">
  </head>
  <body>
    <script type="text/javascript">
      // data for pie
      var p = [12,43,13,32];
      // data for histo, xyPlot, and scatter
      var x = [-0.8234, 0.0952, 1.9594, -0.2831, -0.4147, 1.5859, 0.5326, 0.0925, 0.3293, 1.3635, 0.3396, 0.0677, -0.6739, 0.4084, -1.4487, -0.1101, -0.7521, -1.2118, 1.7191, 0.2020, -0.1573, -0.2298, -0.8230, 1.7924, 0.4511];
      var y = [-1.4166, 1.353, -0.6294, 0.0567, 1.4157, 0.32806, 0.2377, -0.2262, -1.0602, -1.8150, 0.1075, -1.3516, 1.0137, 0.0183, -0.5466, 0.6416, -0.6655, 0.6874, -0.4616, -0.2808, 1.3443, -1.0518, -0.1332, -1.0097, 0.3643];
      var index = [];
      x.forEach(function(elem,i){
        index.push(i);
      });

      var pieChart = pie(p);
      var histogram = histo(x);
      var lineGraph = xyPlot(index,y);
      var scatterPlot = scatter(x,y);

    </script>
  </body>
</html>Creates a pie chart from an array of data (like the bottom-left example).
<html>
  <head>
    <script src="bower_components/d3/d3.js" charset="utf-8"></script>
    <script src="bower_components/d3xter/js/lib.js" charset="utf-8"></script>
    <link rel="stylesheet" href="bower_components/d3xter/css/style.css">
  </head>
  <body>
    <div id='elementID'></div>
    <script type="text/javascript">
      var config = {
        selector: '#elementID', //selector for DOM element to append the plot to (defaults to < body >)
        width: 500, //pixel width (defaults to 500)
        height: 500, //pixel height (defaults to 500)
        labels: ["A","B","C","D"] //labels for the pie chart slices
      }
      var data = [12,32,23,13]; //array of numeric values

      var pieChart = pie(data, config);

    </script>
  </body>
</html>Creates a histogram from an array of data (like the top-left example).
<html>
  <head>
    <script src="bower_components/d3/d3.js" charset="utf-8"></script>
    <script src="bower_components/d3xter/js/lib.js" charset="utf-8"></script>
    <link rel="stylesheet" href="bower_components/d3xter/css/style.css">
  </head>
  <body>
    <div id='elementID'></div>
    <script type="text/javascript">
      var config = {
        xLab: 'Standard Normal', //x-axis label (defaults to '')
        selector: '#elementID', //selector for DOM element to append the plot to (defaults to < body >)
        width: 500, //pixel width (defaults to 500)
        height: 500, //pixel height (defaults to 500)
      }
      var data = [-0.823440, 0.09522, 1.9594, -0.2831, -0.4147, 1.5859, 1.2537, 0.09257, 0.3293, 1.1635, 0.3396, 0.0677, 0.6739, 0.4084, -1.4487, -0.1101, -0.75217, -1.218, 1.719, 0.2020, -0.15732, -0.2298, -0.8230, 1.7924, 0.4511]; //array of numeric values

      var histogram = histo(data, config);

    </script>
  </body>
</html>Create a standard x-y scatter plot, or specify an additional array of values to map to the size of the circles (like the top-right example)
<html>
  <head>
    <script src="bower_components/d3/d3.js" charset="utf-8"></script>
    <script src="bower_components/d3xter/js/lib.js" charset="utf-8"></script>
    <link rel="stylesheet" href="bower_components/d3xter/css/style.css">
  </head>
  <body>
    <div id='elementID'></div>
    <script type="text/javascript">
      var x = [-0.8234, 0.0952, 1.9594, -0.2831, -0.4147, 1.5859, 0.5326, 0.0925, 0.3293, 1.3635, 0.3396, 0.0677, -0.6739, 0.4084, -1.4487, -0.1101, -0.7521, -1.2118, 1.7191, 0.2020, -0.1573, -0.2298, -0.8230, 1.7924, 0.4511];
      var y = [-1.4166, 1.353, -0.6294, 0.0567, 1.4157, 0.32806, 0.2377, -0.2262, -1.0602, -1.8150, 0.1075, -1.3516, 1.0137, 0.0183, -0.5466, 0.6416, -0.6655, 0.6874, -0.4616, -0.2808, 1.3443, -1.0518, -0.1332, -1.0097, 0.3643];
      var z  = [1.1011, 0.8724, -1.5972, -0.2027, -1.2296, -0.0543, 0.2415, 0.3584, 1.0202, -1.7524, -0.6787, 0.8113, 0.0206, -1.9769, 1.2008, 1.0440, 1.0141, -0.6452, -0.6115, 0.6687, 2.9415, -1.1146, -1.2889, -0.2562, -1.1781];


      var config = {
        xLab: 'random x-values', //x-axis label (defaults to '')
        yLab: 'random y-values', //y-axis label (defaults to '')
        selector: '#elementID', //Selector for DOM element to append the plot to (defaults to < body >)
        width: 500, //pixel width (defaults to 500)
        height: 500, //pixel height (defaults to 500)

        //size and sizeLab are used in bubble charts like the top-right example.
        size: z, //array of numeric values which map to sizes of the circles plotted at the corresponding x-y point (defaults to undefined for a standard scatter)
        sizeLab: 'random size values' //label for size values (defaults to '')
      }

      var scatter = scatter(x,y,config);

    </script>
  </body>
</html>Create a standard x-y line graph (like the bottom left example).
<html>
  <head>
    <script src="bower_components/d3/d3.js" charset="utf-8"></script>
    <script src="bower_components/d3xter/js/lib.js" charset="utf-8"></script>
    <link rel="stylesheet" href="bower_components/d3xter/css/style.css">
  </head>
  <body>
    <div id='elementID'></div>
    <script type="text/javascript">
      var config = {
        xLab: 'Standard Normal 1', //x-axis label (defaults to '')
        yLab: 'Standard Normal 2', //y-axis label (defaults to '')
        selector: '#elementID', //Selector for DOM element to append the plot to (defaults to < body >)
        width: 500, //pixel width (defaults to 500)
        height: 500 //pixel height (defaults to 500)
      }
      var x = [];
      var y = [-1.4166, 1.353, -0.6294, 0.0567, 1.4157, 0.32806, 0.2377, -0.2262, -1.0602, -1.8150, 0.1075, -1.3516, 1.0137, 0.0183, -0.5466, 0.6416, -0.6655, 0.6874, -0.4616, -0.2808, 1.3443, -1.0518, -0.1332, -1.0097, 0.3643];
      y.forEach(function(elem,index){
        x.push(index)
      })

      var lineGraph = xyPlot(x,y,config);

    </script>
  </body>
</html>Functions in D3xter are intended to extend (rather than replace) D3. D3xter functions return SVG objects which can be modified with regular D3 code.
<html>
  <head>
    <script src="bower_components/d3/d3.js" charset="utf-8"></script>
    <script src="bower_components/d3xter/js/lib.js" charset="utf-8"></script>
    <link rel="stylesheet" href="bower_components/d3xter/css/style.css">
  </head>
  <body>
    <script type="text/javascript">
      var array = [-0.8234, 0.0952, 1.9594, -0.2831, -0.4147, 1.5859, 0.5326, 0.0925, 0.3293, 1.3635, 0.3396, 0.0677, -0.6739, 0.4084, -1.4487, -0.1101, -0.7521, -1.2118, 1.7191, 0.2020, -0.1573, -0.2298, -0.8230, 1.7924, 0.4511];

      var hist = histo(array);

      //modify the color of the histogram rectangles with D3 syntax
      hist.selectAll('rect').style('fill','red');

    </script>
  </body>
</html>Run unit tests by opening test/test.html in the browser.
Pull requests (additional testing, new plots, etc.) welcome.
The MIT License (MIT)
Copyright (c) 2014 Nathan Epstein
Permission is hereby granted, free of charge, to any person obtaining a copy of this software and associated documentation files (the "Software"), to deal in the Software without restriction, including without limitation the rights to use, copy, modify, merge, publish, distribute, sublicense, and/or sell copies of the Software, and to permit persons to whom the Software is furnished to do so, subject to the following conditions:
The above copyright notice and this permission notice shall be included in all copies or substantial portions of the Software.
THE SOFTWARE IS PROVIDED "AS IS", WITHOUT WARRANTY OF ANY KIND, EXPRESS OR IMPLIED, INCLUDING BUT NOT LIMITED TO THE WARRANTIES OF MERCHANTABILITY, FITNESS FOR A PARTICULAR PURPOSE AND NONINFRINGEMENT. IN NO EVENT SHALL THE AUTHORS OR COPYRIGHT HOLDERS BE LIABLE FOR ANY CLAIM, DAMAGES OR OTHER LIABILITY, WHETHER IN AN ACTION OF CONTRACT, TORT OR OTHERWISE, ARISING FROM, OUT OF OR IN CONNECTION WITH THE SOFTWARE OR THE USE OR OTHER DEALINGS IN THE SOFTWARE.


