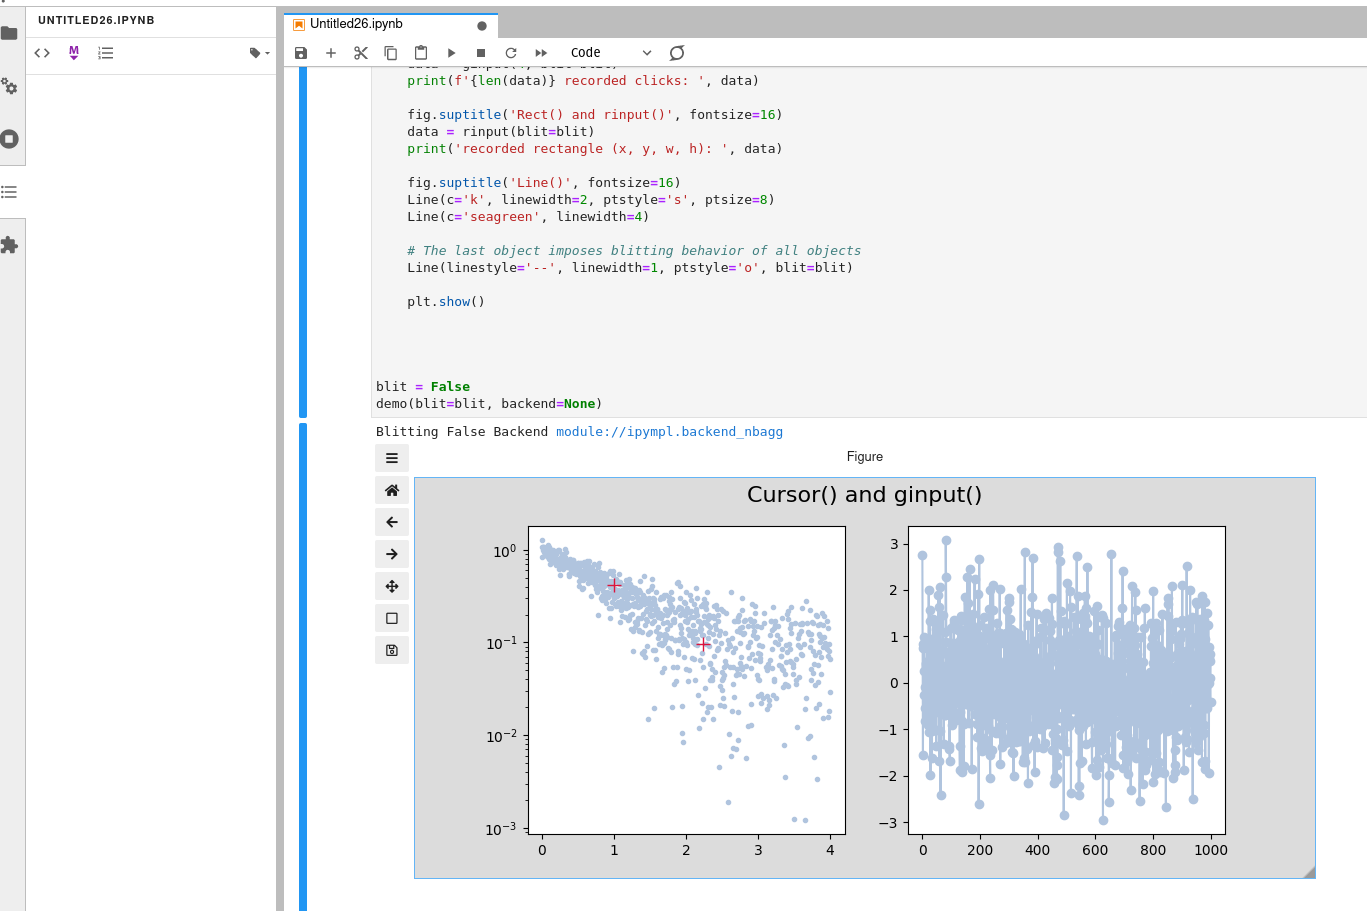
drapo (draggable plot objects) is a Python 3 package that provides a set of interactive graphical objects on Matplotlib figures: draggable line (Line), draggable rectangle (Rect), moving cursor (Cursor), and interactive click to define active figure/axes (ClickFig).
Based on these tools, the package also provides graphical input functions for measuring/extracting data interactively from a figure, such as ginput() (get location of clicks), linput() (extract position from interactive line) and rinput() (get region of interest from interactive rectangle).
Matplotlib must be using an interactive backend such as Qt or Tk. In Jupyter, use %matplotlib qt or %matplotlib tk (or simply %matplotlib). The MacOSX backend can cause problems (see Tips and Troubleshooting below).
- Line is a class that creates a draggable line.
- Rect is a class that creates a draggable rectangle.
- Cursor is a class that creates a cursor that follows the mouse
- ginput is a function based on the Cursor class that returns position data from clicks/keystrokes.
- linput is a function based on the Line class that returns position data of the edges of an interactive line.
- rinput is a function based on the Rect class that returns position data delimited by an interactive rectangle.
- ClickFig is a class that activates figures and axes (makes them the current ones) by mouse hovering and clicking.
pip install drapoBelow is a brief overview on how to use the package contents with the most basic features. For full documentation, see DOCUMENTATION.md. For background code and development info, see DEVELOPMENT.md.
For a brief demo of various objects:
python -m drapo.demo(it is possible to specify a backend and/or to turn on/off blitting using the --backend and --blit flags, see help with python -m drapo.demo -h)
To use individual objects and functions:
from drapo import Line, Cursor, Rect, ClickFig, ginput, linput, rinputLine() creates a line in the current axes of the current figure (creates new figure if none existing) that is draggable by left-clicking on it. Motion is different whether click is done on the line ends or on the line itself. To remove the line, right-click on it.
Rect() creates a draggable rectangle in the current or specified figure. Motion is triggered by left-clicking on the edges (lines), vertices (corner points), or in the center (marked by a cross). Right-click to delete.
See documentation for options to change the appearance of these objects. See ClickFig below to activate axes interactively to be able to create the objects in specific axes as needed.
Cursor() creates a cursor in the current figure, but contrary to the draggable objects, the cursor is not bound to specific axes. It is however bound to a figure, and will appear on whatever axes the mouse is currently on; it will switch axes if the mouse goes over other axes. No cursor is visible if the mouse is not currently on axes.
- Use Alt + left/right arrow keys to change color.
- Use Alt + up/down keys to change thickness.
- Use the space bar to toggle visibility on/off.
ginput() will return the data coordinates (x, y) of one click on any axes of the current figure.
- Use
ginput(n)to record exactly n data points (returns list of tuples). - Use
ginput(-1)for an undefined amount of points. - Left click or press a to add point.
- Right click or press z to remove point.
- Middle click or press enter to finish input.
linput() will instantiate an interactive line and return its position as a tuple ((x1, y1), (x2, y2)) when the enter key is pressed.
rinput() will instantiate an interactive rectangle and return its position as a tuple (xmin, ymin, width, height) when the enter key is pressed.
Sometimes the current figure/axes are not the ones where one wants to create the objects. To solve this problem, it is possible to use the ClickFig class.
ClickFig() will make all existing figures and axes clickable (hovering the mouse should highlight the fig/ax under it with a light blue color). Simply left-click in the ones you would like to activate. By default, activation stops after one click.
ClickFig(-1) will keep all fig/ax active for an undefined amount of clicks. Since ClickFig is non-blocking, this is a way to be able to be able to keep activating axes during a work session, without having to instantiate a ClickFig every time. In this situation, deactivation of the ClickFig is done by right-click.
ClickFig(highlight=False) allows not using color highlighting of the fig/ax if it is bothersome.
-
When instantiating an object from the command line on an existing figure, Matplotlib figures need to not block the console. For this, use
plt.show(block=False)when creating the figure. -
If selecting objects is difficult, either increase the
pickersizeproperty, or upgrade drapo and/or Matplotlib (see Requirements below).
If encountering problems, try the following:
-
Use a different matplotlib backend, e.g.
matplotlib.use('Qt5Agg'),matplotlib.use('Qt4Agg')ormatplotlib.use('TkAgg'). -
Similarly, in Jupyter, an interactive backend needs to be used, with the command
%matplotlib qtor%matplotlib tk(or simply%matplotlib). -
Pass
blit=Falsein the argument of any class or function (except ClickFig) to see if the problem comes from the blitting strategy used for fast rendering.
The MacOSX backend of Matplotlib seems to cause problems where the figure crashes, or objects get duplicated on the figure, among other things. If encountering problems on a Mac, usually they are solved by either turning off blitting for fast rendering, or by choosing a different backend (see above).
- matplotlib
- importlib-metadata
- numpy (optional, only needed to run demos and examples)
Note: a bug in drapo < 1.0.5 makes it very difficult to select objects when using Matplotlib <3.3. This has been corrected in drapo >= 1.0.5.
Python : >= 3.6
Olivier Vincent
3-Clause BSD (see LICENSE file).


