Git Product home page Git Product logo

openownership / visualisation-tool Goto Github PK

View Code? Open in Web Editor NEW
20.0 9.0 4.0 6.29 MB

A visualisation library for beneficial ownership structures

Home Page: https://www.openownership.org/en/publications/beneficial-ownership-visualisation-system/bods-data-visualiser/

License: Apache License 2.0

JavaScript 98.03% CSS 1.55% Shell 0.42%
beneficial-ownership-data visualisation beneficial-ownership open-data open-source

visualisation-tool's Introduction

BODS-Dagre

BODS-Dagre is a small javascript library for automatic generation of directed graphs representing Beneficial Ownership Data for the web. It relies on d3, dagre-d3 and bezier-js to do all the heavy lifting.

The tool accepts Beneficial Ownership Data Standard (BODS) JSON as an input and outputs SVG content on a webpage which contains the appropriate placeholder HTML.

For a hosted version you can use directly, see our main website's installation

Installation & Usage

Through your package manager:

$ npm install @openownership/bods-dagre

Or as a script tag:

<script src="https://unpkg.com/@openownership/bods-dagre/dist/bods-dagre.js"></script>

Then in your application:

// Your BODS data
const data = JSON.parse('some JSON string');
// Where you want the SVG drawn
const container = document.getElementById('some-id');
// Where you're serving the bundled images from (see below)
const imagesPath = '/some/folder';
// Set a node limit above which labels will no longer be shown 
const labelLimit = 8

BODSDagre.draw(data, container, imagesPath);

Full demo applications are hosted from this repo:

Images

The library includes license-free SVG images for world flags, as well as some generic icons from our Beneficial Ownership Visualisation System.

You can find these inside the dist/images folder, but you need to make them available at some URL path in your application and tell the library what that path is when you call it.

Zoom

The functionality has been included for two zoom buttons. These must be added to the page, along with the placeholder, with the correct IDs for the code to pick them up:

<button id="zoom_in">+</button>
<button id="zoom_out">-</button>

Save

The functionality has been included for two save buttons. These must be added to the page, along with the placeholder, with the correct IDs for the code to pick them up:

<button id="download-svg">Download SVG</button>
<button id="download-png">Download PNG</button>

It should be noted that the PNG output will provide an image that is scaled to the canvas. The resolution is likely to be poor.

The SVG download button provides the complete graph in the SVG markup format.

Node types

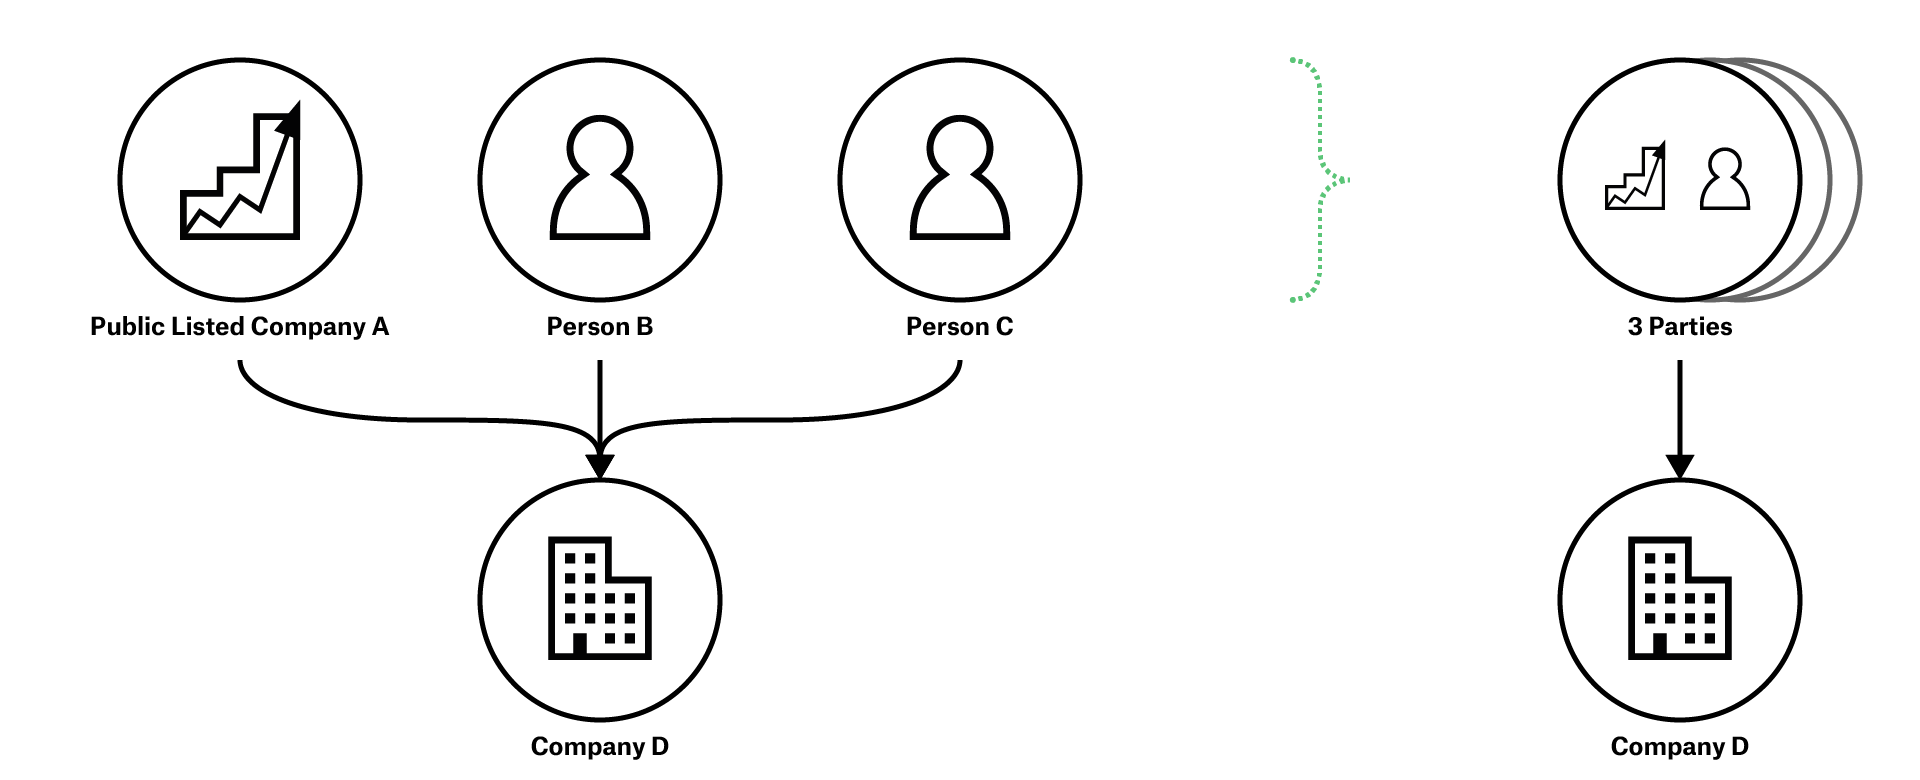
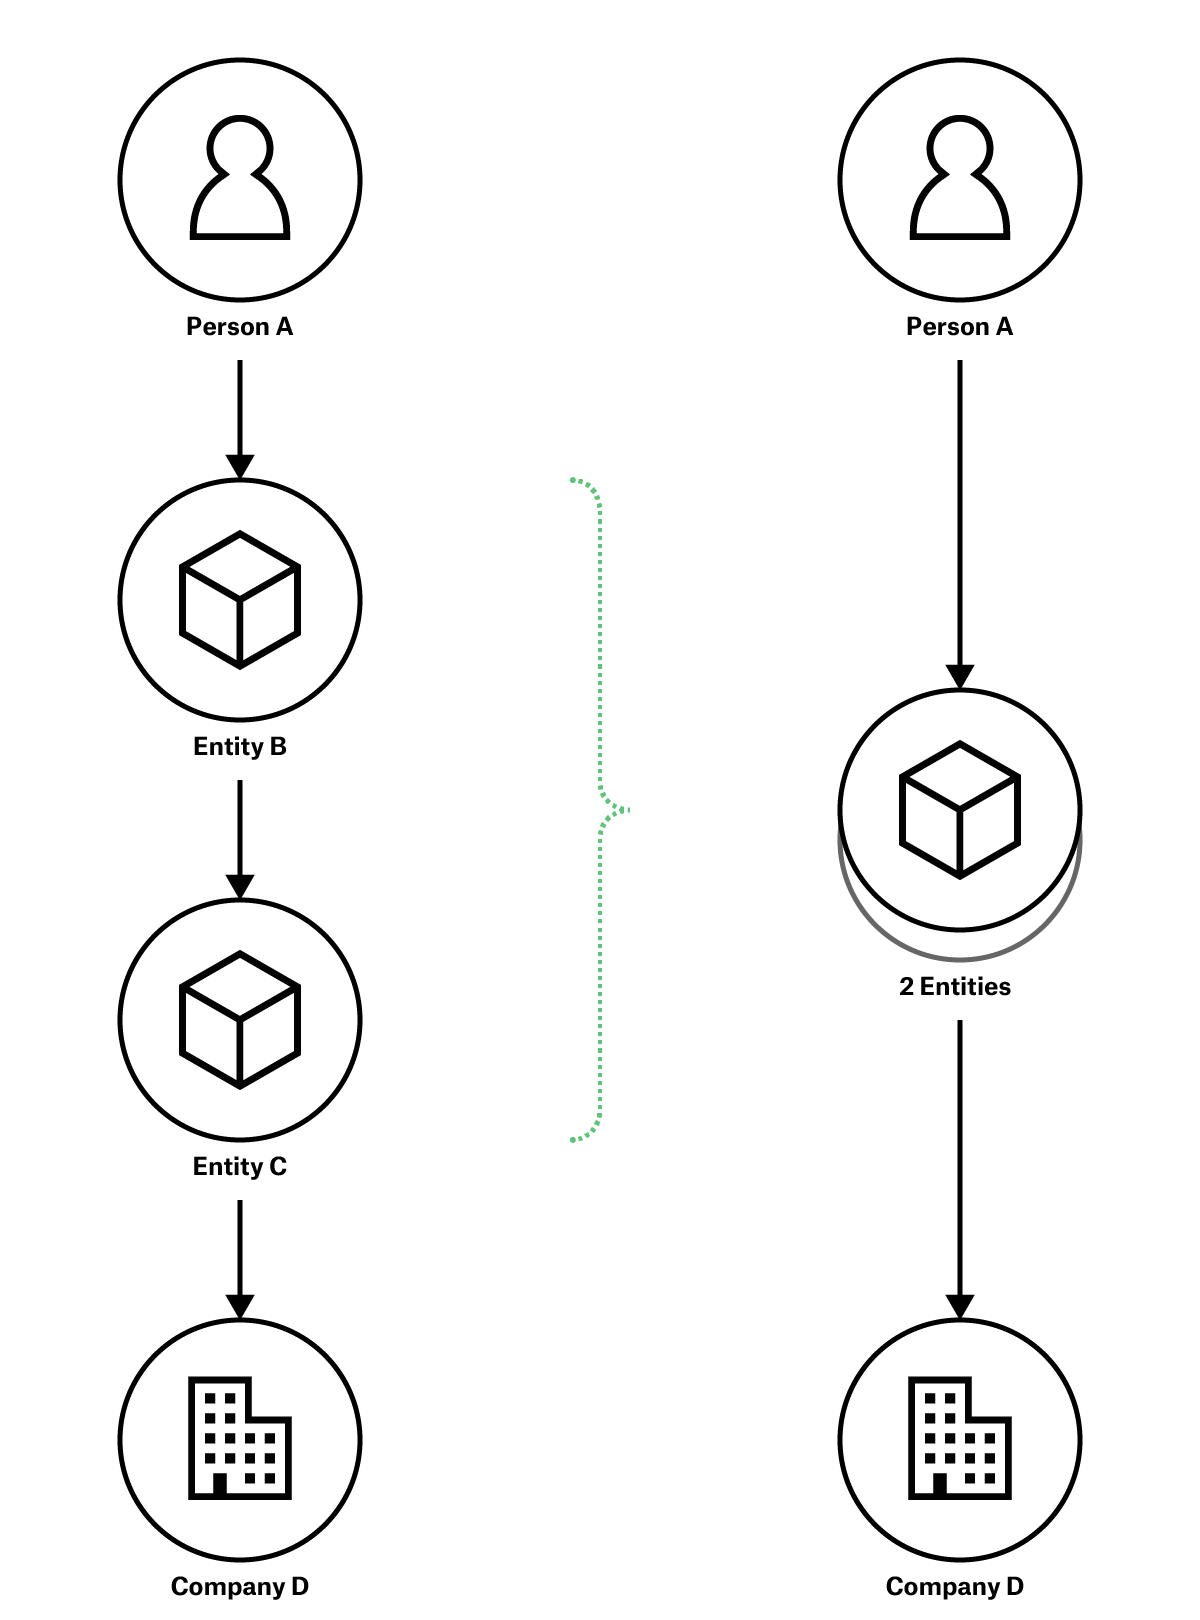
At present the tool provides visualisation of the following entity types (based on personStatements and entityStatements):

  • knownPerson
  • anonymousPerson
  • unknownPerson
  • registeredEntity
  • registeredEntityListed
  • legalEntity
  • arrangement
  • anonymousEntity
  • unknownEntity
  • state
  • stateBody

If the entity type is not recognised then it will default to the unknown type.

Country flags

If the country is not present or is not recognised then no flag will be displayed.

Development

Please see the developer guide for more information.

Specification

Please see the visualiser specification for an outline of functionality and requirements.

visualisation-tool's People

Contributors

codemacabre avatar dependabot[bot] avatar lgs85 avatar stephenabbott avatar stevenday avatar timgdavies avatar

Stargazers

 avatar  avatar  avatar  avatar  avatar  avatar  avatar  avatar  avatar  avatar  avatar  avatar  avatar  avatar  avatar  avatar  avatar  avatar  avatar  avatar

Watchers

 avatar  avatar  avatar  avatar  avatar  avatar  avatar  avatar  avatar

visualisation-tool's Issues

Showing indirect interests with a dashed line

The visualisation language draft states:

You may choose to add Arrows that connect distant Parties, and annotate these. These are indirect Arrows.

Indirect Arrows are drawn with a dotted or dashed line.
This Arrow must be annotated with the compounded interest of the first Party in the last.

In addition, an explicit relationship between two nodes in BODS can be tagged as indirect using the interestLevel parameter (direct or indirect).

A dashed line should be used whenever a relationship is tagged as indirect.

Node labels assume a fullName property will exist

We've had an example of data which has givenName and familyName but not the combined fullName. Given this data, which is technically valid BODS, the tool errors and can't draw a network.

We can't always figure out how to combine the various components correctly (ordering may vary in different places) but I think on balance it's better to show the name parts in the wrong order than not have anything to show at all.

We also need to account for when people don't include any name at all.

Add labels to relationship edges which follow the path of the edge

I'm splitting this out from #3 (and the subsequent #12) to allow us to prioritise it separately, but this is currently in scope for our MVP.

The details of where to obtain the values for labels are mostly in #12, but here we should show the exact share value or something like (25-50%) based on the minimum and maximum fields.

In the case of 'other' ownership (i.e. not shareholding or voting-rights), I think we can use something generic like Other ownership or control.

Add flag labels to the top right corner of node labels

Following on from #4, the only icon we can be sure we need for the MVP is a nationality/jurisdiction flag, which we'll place in the top right corner.

On the register, we use these flags: https://github.com/behdad/region-flags which have nice licensing and both PNG and SVG versions. I've tried various others previously (e.g. square format ones) but always found a few were missing. The addition of some sub-national flags in this dataset is also useful because they correspond to important places with separate company registers (e.g. Delaware).

In terms of where to get the flag from, optional fields in the data make this a little tricky. The register code is here for people and here for entities. I think we can say that only using the code values (if they're present) is ok for the MVP. I.e. looking up countries by name is out of scope.

In our review call @timgdavies highlighted that our visual language allows for multiple icons:
image

This is quite important for nationalities of people in particular, where our data standard allows multiple. We decided that implementing this is out of scope for the MVP, but we don't want to make it impossible to add later.

Tool erroneously treats interests array as required

If an ownership-or-control statement contains an empty interests array:

"interests": []

... then the diagram is drawn without problem.

If the interests property is left out entirely no diagram is drawn and the error 'Sorry, there was an error drawing your data. Is it valid BODS?' pops us. (It is valid BODS, btw.)

Add additional edges to show direct/ultimate ownership

In the following image, the grey dashed line is an example of a concept for distinguishing between direct and indirect ownership:

image

The grey line shows who the ultimate owner is and is annotated with a calculated percentage showing their eventual share ownership. (For the purposes of this ticket, ignore the other details in the image.) Technically, this would be driven by the isComponent and componentStatementIDs fields in the data standard.

For the purposes of this experiment, we can assume that calculating the percentage ownership is out of scope. We solely want to understand if it's possible to display these additional edges in a way that is understandable. Especially in a way that works in more complex graphs (i.e. Kwik Fit https://register.openownership.org/entities/59b9197d67e4ebf340d33ddc/graph).

Layout and style: convey direction of relationships

At the moment, it's often unclear:
a) whether company A owns/controls company B or the converse
b) which company (or potentially companies) is at the 'root' of a tree

For example, go to this Armenian declaration and use the 'Download as JSON' button (top right). The visualiser displays this data as:

image

BOVS deals with directionality and clarity of the graph by:

  1. Using arrows
  2. Layout-wise, essentially using columns or rows to order series of nodes

We need at least (1) and ideally (2), IMO.

Option not to hide percentages / edge annotations

At the moment the graph hides edge annotations (e.g. percentages of ownership) when there are more than a particular number of nodes, or more than a given complexity.

This is problematic for some use-cases. It would be useful to have:

(a) Option to toggle edges annotations on or off (even if starting state is determined by graph complexity)

and/or

(b) A default or optional layout algorithm that makes space for labels even in complex graphs.

(This comes from Louise's comment that:

I was looking to screenshot the Armenia ZCMC graph for a presentation i'm giving, to demonstrate the need to visualise complex declarations. Because there's no metadata on the graph edges it's not telling us things that would be useful to see at a glance (e.g. % ownership, also nature of OOC if that's captured in the declaration).)

Transpile the code using babel so that it's IE11 compatible

Currently, with our use of ES6 features, we're probably only compatible with Edge, but IE11 is ~5% of the OO website's traffic in the last year, so should be supported. (Versions lower than that are vanishingly small percentages, so ok to ignore I think).

Make statement properties available/viewable

This is a feature request which would really help when supporting people's use of BODS. When helping countries like Latvia and Armenia, who are working towards publishing their BO declarations in BODS json, being able to view (and interact with - e.g. copy text) statement properties would be really helpful.

Suggested functionality:

  • Click on a node or edge to reveal a popup with key properties* shown.
  • The active/clicked node or edge is highlighted.
  • Pop-up is closed only by clicking close (X) icon in popup, or by clicking on another edge or node. (Only one popup can be visible at a time.
  • Users can select (and copy) text within a pop-up.

Alternatively, rather than a popup, there could be a 'Details' display area.

* Key properties TBD for each statement type, but ideally these would be easy to configure/change in the back-end.

Explore using HTML instead of SVG

Many of the limitations discussed in our prototype findings document seem to stem from the initial specification of generating SVG diagrams, such that they could be edited directly.

After further thought, we've realised that this aspiration should be revisited, because it's possible that we're constricting the value of this automated tool without gaining anything significant for our manual drawings.

In particular, we'd like to explore whether this would have any effect on:

  • Controlling intersection points with odd-shaped nodes
  • Text labels
  • Required node shapes

But in addition, whether this change would make any of the other tickets in this sprint easier/possible.

When producing nodes for unspecified interestedParties, make a new one for each

Currently we share a single node between them all, which could make it seem as if the same shadowy figure controls them all when we really have no idea.

To fix this, we can use a function to generate unknown nodes, passing in the ownershipOrControlStatement, and generate an id for them by appending the O-o-C's id to 'unknown'

Where BODS JSON contains schemeName "OpenOwnership Register", link entity name and knownPerson fullName to Register uris

As a user of the BODS Visualiser tool where we recommend going to the Open Ownership Register to grab examples of BODS JSON data, I would like to be able to click from the names of entities and people back to their pages on the Register where the uris for those pages are available in the identifiers array.

This would give me the ability to explore the more detailed information and data about those entities and individuals that we hold on the Open Ownership Register by clicking through from the BOVS visualisation.

Explore whether dagre can draw diagrams horizontally rather than vertically

This just came out of our review call on the design work. Virgil (the designer) feels quite strongly that sometimes a horizontal layout is a better presentation and it got me thinking that maybe it could work better for situations like Kwik-Fit where you have loads of owners. My reasoning being that you want to quickly scroll a whole level in a diagram, which is easier vertically, then it's more of a mental jump to go down/across a level in the hierarchy, so might be better suited to the more difficult horizontal direction.

In any case, I thought it was worth exploring if this is even something Dagre can do @Lathrisk - do you think you have time to take a quick look in the options?

Split up data parsing, modelling and rendering better

Moving this from the initial code review in #17. Currently we mix these concerns a little, but as we grow the app we'll need to refactor things so that we have a clear data parsing step, models for nodes/edges derived from BODS data and rendering code, all in their own places and wired together into the UI. This should probably be accompanied by some unit tests and an overall test of the library using something like jsdom.

Understand better the constraints around text labels and layout

In the prototype document from our first sprint, we discovered that:

We can generate SVG elements for the nodes but these will typically be fixed width which prevents Dagre from dynamically resizing them based on labels. This could make variable length strings harder to handle.

We'd like to explore this further to understand if there are any ways we can deal with variable length strings and dynamically resizing them.

Explore styling edges and adding labels, to show ownership and control

The following example image gives an idea of the kinds of labels we might want to apply and a design idea for how we show the relative scale of 'ownership' vs 'control' interest types.

Screenshot 2020-03-30 at 20 38 40

A simpler version would be something like:

Screenshot 2020-03-30 at 20 40 33

We'd like to explore this kind of multiple-line edge styling to see how possible it is and find out what the limitations are with labelling/label positioning. The overarching aim of this element of the design is to demonstrate the relative 'importance' of a particular relationship, broken down along two axes of ownership (i.e. shares) and control (i.e. voting rights). There are many other types of control, but they're usually more binary (i.e. can appoint directors, has casting vote, etc). Ideally we'd indicate these with a third coloured line that's always a fixed width.

If this is tricky to implement, it would help inform the design process if we could know what options (if any) there are for styling edges.

Automatically draw on paste of data

I think the 'Clear' button is no longer needed (pressing draw seems to clear the existing drawing out anyway) and I'm wondering if we even need 'Draw'.

If #18 is addressed, could we have a redraw trigger by any valid change to the BODS JSON in the input area?

entityStatements without names should be handled

'name' not a required property of entityStatements, but the tool won't render valid BODS which has any entityStatements without a name property. Try:

[{
    "addresses": [
      {
        "type": "registered"
      }
    ], 
    "entityType": "registeredEntity", 
    "incorporatedInJurisdiction": {}, 
    "isComponent": true, 
    "publicationDetails": {
      "bodsVersion": "0.2", 
      "license": "http://creativecommons.org/publicdomain/zero/1.0/", 
      "publicationDate": "2022-04-06", 
      "publisher": {
        "name": "The Register of Country X", 
        "url": "https://www.countryX.gov/"
      }
    }, 
    "source": {
      "assertedBy": [
        {
          "name": "A big legal firm"
        }
      ], 
      "type": [
        "selfDeclaration", 
        "officialRegister"
      ]
    }, 
    "statementDate": "2018-11-12", 
    "statementID": "g0drd90a-a97b-11eb-a83a-27d507fc432fg-356gas", 
    "statementType": "entityStatement"
  }]

How long would this take to fix?

Add Stacks as a feature and enable by default for any complex graph

BOVS allows nodes to be stacked together into a single node: https://www.openownership.org/visualisation/core/stacks/

There are Entity and Owner stacks, which go down the chain or across the chain respectively. Going across (i.e. multiple parties all interested in the same node) is hte simplest candidate to implement and arguably the most useful too.

Owner stacks

Auto stacking

  • Where multiple parties of the same type (e.g. multiple People) are all interested in the same entities (e.g. Companies A to C), those parties should be automatically stacked together, especially in larger diagrams.

Stack inspection

  • The user can click a Stack to see in a popup which parties are in it, and their key details.

Stack expansion

  • The user can click individual parties within the popup to remove them from the stack.
  • A button is offered to expand the entire stack i.e. remove all entities from the stack.

Collapsing entities

A much more complex addition to this feature.

  • There is a way for the user to select nodes within the graph.
  • If the selection encompasses multiple parties all of whom are interested in the same entities, a button is offered to collapse them into a stack.

Entity stacks

More complex and less important but equivalent features could be implemented here. In particular:

  • Whenever multiple entities are connected in direct, unbroken, unbifurcating ownership chains, they can be automatically reduced to a stack – in complex diagrams.

Improve error message(s)

If the visualiser can't parse the BODS data, we have a message box pop up saying "Sorry, there was an error drawing your data. Is it valid BODS?" There are times, however, when a bug in the visualiser means that users get this error message even when the BODS is valid.

Could any additional info or error report be generated and shared with the user to help with troubleshooting and bug reporting?

Improvements to layout algorithm

The current layout algorithm creates some odd results and issues at present that it would be good to avoid.

The two I've noted so far include:

  • Text paths around sharp curves

image

(Source)

  • Unnecessary crossing lines

The 'Owns 60%' link below should be possible to draw in a way that avoids the crossing lines.

image

(Source)

Create a prototype visualisation tool for BODS data

We have parallel tracks of work to improve our visualisation of BODS data:

  • (a) developing a consistent visual language - see spec
  • (b) developing tools to generate data-driven SVG components using that visual language; and
  • (c) developing an updated component which will layout example and real-world ownership structures;

In this prototype stage, we are looking to carry out prototype work for (b) and (c) (noting that the fully visual language is not yet fully developed).

Functional requirements

  • (1) Accept BODS data as input
  • (2) Generate key components of an ownership graph in SVG
  • (3) Run in the browser without a requirement for hosting
  • (4) Layout the components to show the relationship between them
  • (5) Allow the user to easily edit the resulting diagram and layout in a commonly available user-friendly application (e.g. draw.io / an SVG editor / inkscape etc.)

Example user stories

As an analyst I want to provide a blob of BODS data and get a set of visual elements so that I can produce a slide explaining a particular ownership structure

As a country manager I want to select a BODS example and get a laid out ownership diagram so that I can talk through different ownership structures

As a developer I want a re-useable javascript component that I can feed with BODS data and get back SVG components of an ownership diagram so that I can use these components in my own layout algorithm

Adding support for 'stacks' for nationality (and other properties)

The visual language has the concept of 'stacks' to allow display of multiple properties of an entity, person or relationship.

At present, we only have overlays for nationality/jursidiction (?) (using flags), but these do not display as stacks when multiple are present.

For example, Person 1 below is both Ukranian and British nationality, but only the first of these is shown on the diagram.

image

"personType": "knownPerson",
        "names": [
            {
                "type": "individual",
                "fullName": "Person 1"
            }
        ],
        "nationalities": [
            {
                "name": "Ukrainian",
                "code": "UA"
            },
            {
                "name": "British",
                "code": "GB"
            }
        ]

Support for vertical diagrams

The visual language rules allow for horizontal and vertical diagrams.

Is it possible to implement a simple switch to choose between these layout options?

Shareholding interest with no share property generates error

It's valid BODS to have a shareholding interest with no share property and interestLevel unknown:

[
    {
        "statementID": "xregi-ps-00003264080892880844165",
        "statementType": "personStatement",
        "statementDate": "2020-11-30",
        "personType": "knownPerson",
        "names": [
            {
                "type": "individual",
                "fullName": "Peter Michael Hall",
                "familyName": "Hall",
                "givenName": "Thomas Peter"
            },
            {
                "type": "former",
                "fullName": "Harry Thomas",
                "familyName": "Thomas",
                "givenName": "Harry"
            }
        ],
        "placeOfBirth": {
            "address": "Doncaster",
            "country": "GB"
        },
        "birthDate": "1961-05-26T00:00:00+00:00",
        "nationalities": [
            {
                "name": "United Kingdom of Great Britain and Northern Ireland (the)",
                "code": "GB"
            },
            {
                "name": "Colombia",
                "code": "CO"
            }
        ],
        "placeOfResidence": {
            "address": "247 High Street, Newtown, Borsetshire",
            "postCode": "EG1 1AA",
            "country": "GB"
        },
        "hasPepStatus": false,
        "isComponent": false,
        "publicationDetails": {
            "publicationDate": "2020-09-08",
            "bodsVersion": "0.2",
            "license": "https://creativecommons.org/licenses/by/2.0/legalcode",
            "publisher": {
                "name": "X Register",
                "url": "http://www.register.example"
            }
        },
        "source": {
            "type": [
                "selfDeclaration"
            ],
            "description": "Information is from the declaring party, inputted here by a data entry worker.",
            "assertedBy": [
                {
                    "name": "Declaring Agent B",
                    "uri": "http://www.declaring-agent-b.com"
                }
            ]
        },
        "addresses": [
            {
                "type": "service",
                "address": "Calle 27 29-74, Barrio Nuevo, Palmira, Valle del Cauca",
                "country": "CO"
            }
        ],
        "identifiers": [
            {
                "id": "5962034002",
                "scheme": "GBR-PASSPORT"
            },
            {
                "id": "5436201338",
                "scheme": "COL-IDCARD"
            }
        ],
        "taxResidencies": [
            {
                "name": "United Kingdom of Great Britain and Northern Ireland (the)",
                "code": "GB"
            }
        ]
    },
    {
        "statementID": "xregi-es-00001596281980570844165",
        "statementType": "entityStatement",
        "statementDate": "2020-11-30",
        "isComponent": false,
        "entityType": "registeredEntity",
        "name": "Business A",
        "incorporatedInJurisdiction": {
            "name": "United Kingdom of Great Britain and Northern Ireland (the)",
            "code": "GB"
        },
        "identifiers": [
            {
                "id": "123456789",
                "scheme": "GB-COH",
                "schemeName": "Companies House",
                "uri": "http://www.companieshouse.gov.uk/"
            },
            {
                "id": "9876543210",
                "scheme": "XE-EXAMPLE",
                "schemeName": "Example Data Prefix ",
                "uri": "http://org-id.guide/list/XE-EXAMPLE"
            }
        ],
        "foundingDate": "2002-02-02T00:00:00+00:00",
        "uri": "http://www.business-a.com",
        "publicationDetails": {
            "publicationDate": "2020-09-08",
            "bodsVersion": "0.2",
            "license": "https://creativecommons.org/licenses/by/2.0/legalcode",
            "publisher": {
                "name": "X Register",
                "url": "http://www.register.example"
            }
        },
        "source": {
            "type": [
                "selfDeclaration"
            ],
            "assertedBy": [
                {
                    "name": "Declaring Agent B",
                    "uri": "http://www.declaring-agent-b.com"
                }
            ]
        },
        "addresses": [
            {
                "type": "registered",
                "address": "136, Hill Road, Bridgeport",
                "postCode": "EG2 2BB",
                "country": "GB"
            }
        ]
    },
    {
        "statementID": "xregi-oocs-00005584456675332044097",
        "statementType": "ownershipOrControlStatement",
        "statementDate": "2020-09-23",
        "subject": {
            "describedByEntityStatement": "xregi-es-00001596281980570844165"
        },
        "interestedParty": {
            "describedByPersonStatement": "xregi-ps-00003264080892880844165"
        },
        "interests": [
            {
                "type": "shareholding",
                "interestLevel": "unknown"
            }
        ],
        "isComponent": false,
        "publicationDetails": {
            "publicationDate": "2020-09-08",
            "bodsVersion": "0.2",
            "license": "https://creativecommons.org/licenses/by/2.0/legalcode",
            "publisher": {
                "name": "X Register",
                "url": "http://www.register.example"
            }
        },
        "source": {
            "type": [
                "selfDeclaration"
            ],
            "assertedBy": [
                {
                    "name": "Declaring Agent B",
                    "uri": "http://www.declaring-agent-b.com"
                }
            ]
        }
    }
]

Paste that into the visualiser and it falls over. (In fact, if you click OK on the error message then some elements are rendered. In the case of the above code, you pretty much see everything. With bigger snippets you don't get a navigable diagram.)

Adding a share property to the interest in the code above makes the visualiser happy again:

                "share": {
                    "exact": 50,
                    "maximum": 50,
                    "minimum": 50
                }

Publish a package to NPM and build a tagged release

Ideally, the following would happen automatically when we push a new tag:

  • the code is compiled/built (to the library version) using the appropriate webpack config
  • this makes a versioned release available from github
  • this release is pushed to NPM.

However, we can do this manually for a version 0.0.1, which we should do pretty much immediately to learn the ropes and figure out what we need to do to automate it. In particular, there's an open question from the MVP (#17) about whether we need to commit folders like demo-build into the repo or not.

Write some tests

In some kind of order of priority:

  • A general 'does it work' acceptance test, driving the main library through JSDOM, and/or driving the whole demo app through a headless browser.
  • Unit tests for data parsing and sanitising data
  • Unit tests for template rendering
  • Unit tests for D3 rendering

Create png (or similar) export option

This would be useful in all kinds of situations. At the moment, resizing the page, the diagram etc so that you can take a screenshot (which then needs to be cropped) is time-consuming and - more importantly - beyond some potential users of the tool.

Display issues in visualization in Safari

Expected

Chrome

Screen Shot 2020-10-13 at 3 47 31 PM

Actual

Safari Version 14.0 (15610.1.28.1.9, 15610) on macOS Catalina 10.15.7 (19H2)

Screen Shot 2020-10-13 at 3 47 22 PM

Sample input

From BODS documentation:

[
  {
    "statementID": "1dc0e987-5c57-4a1c-b3ad-61353b66a9b7",
    "statementType": "entityStatement",
    "isComponent": false,
    "statementDate": "2017-11-18",
    "entityType": "registeredEntity",
    "name": "CHRINON LTD",
    "foundingDate": "2010-11-18",
    "identifiers": [
      {
        "scheme": "GB-COH",
        "id": "07444723"
      }
    ],
    "addresses": [
      {
        "type": "registered",
        "address": "Aston House, Cornwall Avenue, London, N3 1LF",
        "country": "GB",
        "postCode": "N3 1LF"
      }
    ],
    "incorporatedInJurisdiction": {
      "code": "GB"
    },
    "publicationDetails": {
      "publicationDate": "2018-11-18",
      "bodsVersion": "0.2",
      "publisher": {
        "name": "CHRINON LTD"
      }
    }
  },
  {
    "statementID": "26e786f0-54c5-497d-a52d-b83439ce3dad",
    "statementType": "entityStatement",
    "isComponent": false,
    "statementDate": "2018-01-05",
    "entityType": "arrangement",
    "name": "Joint shareholding",
    "publicationDetails": {
      "publicationDate": "2018-11-18",
      "bodsVersion": "0.2",
      "publisher": {
        "name": "CHRINON LTD"
      }
    }
  },
  {
    "statementID": "676ce2ec-e244-409e-85f9-9823e88bc099",
    "statementType": "ownershipOrControlStatement",
    "isComponent": false,
    "statementDate": "2018-01-05",
    "subject": {
      "describedByEntityStatement": "1dc0e987-5c57-4a1c-b3ad-61353b66a9b7"
    },
    "interestedParty": {
      "describedByEntityStatement": "26e786f0-54c5-497d-a52d-b83439ce3dad"
    },
    "interests": [
      {
        "type": "shareholding",
        "interestLevel": "direct",
        "beneficialOwnershipOrControl": false,
        "startDate": "2018-01-01",
        "share": {
          "exact": 100
        }
      }
    ],
    "publicationDetails": {
      "publicationDate": "2018-11-18",
      "bodsVersion": "0.2",
      "publisher": {
        "name": "CHRINON LTD"
      }
    }
  },
  {
    "statementID": "17bfeb0d-4a63-41d3-814d-b8a54c81a1f",
    "statementType": "personStatement",
    "isComponent": false,
    "personType": "knownPerson",
    "statementDate": "2018-01-05",
    "names": [
      {
        "fullName": "Natalie Coleman"
      }
    ],
    "publicationDetails": {
      "publicationDate": "2018-11-18",
      "bodsVersion": "0.2",
      "publisher": {
        "name": "CHRINON LTD"
      }
    }
  },
  {
    "statementID": "d1eb52de-ff02-4690-8359-f4bbf9c128b1",
    "statementType": "personStatement",
    "isComponent": false,
    "personType": "knownPerson",
    "statementDate": "2018-01-05",
    "names": [
      {
        "fullName": "Roberto López"
      }
    ],
    "publicationDetails": {
      "publicationDate": "2018-11-18",
      "bodsVersion": "0.2",
      "publisher": {
        "name": "CHRINON LTD"
      }
    }
  },
  {
    "statementID": "c222fe05-2bf3-4cc0-b126-f665109d7211",
    "statementType": "ownershipOrControlStatement",
    "isComponent": false,
    "statementDate": "2018-01-05",
    "subject": {
      "describedByEntityStatement": "26e786f0-54c5-497d-a52d-b83439ce3dad"
    },
    "interestedParty": {
      "describedByPersonStatement": "17bfeb0d-4a63-41d3-814d-b8a54c81a1f"
    },
    "interests": [
      {
        "type": "shareholding",
        "interestLevel": "direct",
        "beneficialOwnershipOrControl": true,
        "startDate": "2018-01-01",
        "share": {
          "exact": 50
        }
      }
    ],
    "publicationDetails": {
      "publicationDate": "2018-11-18",
      "bodsVersion": "0.2",
      "publisher": {
        "name": "CHRINON LTD"
      }
    }
  },
  {
    "statementID": "c222fe05-2bf3-4cc0-b126-f665109d7211",
    "statementType": "ownershipOrControlStatement",
    "isComponent": false,
    "statementDate": "2018-01-05",
    "subject": {
      "describedByEntityStatement": "26e786f0-54c5-497d-a52d-b83439ce3dad"
    },
    "interestedParty": {
      "describedByPersonStatement": "d1eb52de-ff02-4690-8359-f4bbf9c128b1"
    },
    "interests": [
      {
        "type": "shareholding",
        "interestLevel": "direct",
        "beneficialOwnershipOrControl": true,
        "startDate": "2018-01-01",
        "share": {
          "exact": 50
        }
      }
    ],
    "publicationDetails": {
      "publicationDate": "2018-11-18",
      "bodsVersion": "0.2",
      "publisher": {
        "name": "CHRINON LTD"
      }
    }
  }
]

Automate NPM publishing on tags

I set up the basics in #46, but it's still a manual process, it would be nice if we could automatically publish to NPM whenever we push a new tag to github.

Revisit whether SVG downloads and by necessity a 'pure' SVG diagram are required

In the MVP process and particularly #8 we made a decision to use HTML inside a larger SVG diagram to get better presentation of nodes in a graph. This meant that directly downloading and editing a generated diagram in an SVG editor would be tricky.

We removed the prototype code we had for this in 5f54d03, but acknowledged in #17 that it was worth checking back in on this decision in the future to see if we wanted to resurrect it. This ticket is a reminder of that.

Draw edges all the way to the centre of nodes

This came up as a suggestion by @timgdavies to lay the foundations for future approaches to #5. The basic reasoning was that we could then hide intermediate/component nodes and change path styles to represent calculated/indirect/ultimate ownership - skirting the issue of drawing new edges on the graph for that purpose.

Technically we think this means:

  • Not having any arrow heads on edges
  • Giving our HTML labels a background colour, to maintain the current visual style of edges ending at the outside of nodes
  • Potentially having to alter some of the node shape settings we give to Dagre, so that edges start and end in the centre.

Explore placing additional icons around a central 'entity type' icon

The following are some mockups from our recent design workshop showing a candidate for a more detailed version of nodes within a graph:

image

The basic idea is that concepts such as nationality/jurisdiction, or whether an entity will be covered by specific legislation, can be conveyed through smaller icons placed around the main entity type icon, perhaps in '4 corners'. The total set of icons will be larger than 4, but we'd perhaps pick a default set for generic visualisations.

I think our main question here is whether this idea will cause any major issues with laying out the graph. If not, we don't need to work it up fully at this stage. If so, again it would be useful to know if the same concept of additional 'modifier' icons on nodes could be achieved in a different way.

Add bar graphs to nodes with the total known ownership & control

The following image is a concept for providing a detailed breakdown of how much of a particular entity's ownership is declared (i.e. known to us) vs undeclared:

Screenshot 2020-03-30 at 21 18 36

The general idea is that these graphs could be stacked bars (for different owners), with some empty space signifying how much is unknown/undeclared. They could also be presented as multiple bars:

Screenshot 2020-03-30 at 21 21 35

For the purposes of this experiment, we'd like to explore how we could display some kind of bar around the node when the user has signalled an interest in a specific node. Thinking of touch compatibility, this would probably be via selecting the node on click/tap.

Draw ownership and control interests as two offset lines of different colours with thickness relative to the percentage

I'm breaking this out of #3 as it's the concrete feature we've decided to implement for our MVP and it needs some more detail fleshing out. There is still some uncertainty about how we implement it, so this is our desired feature set and may change.

Assuming a relationship which has both ownership and control interests:

  • To turn the single SVG path Dagre-D3 creates between nodes into two by adding a new SVG path which is offset from the first with no gaps between.
  • To colour one path blue for ownership, the other purple for control
  • To scale each path's width between 1-5px, representing the known percentage value of the interest

In cases where there is only ownership or only control, we'll only draw that line, but still colour it and scale the thickness.

In cases where there is only a non-quantifiable and non-categorisable type of relationship we'll represent it with the single default line from dagre-d3 (i.e. no special colours or thickness).

Ownership is defined by the shareholding interest type in ownershipOrControlStatements while control is defined by voting-rights.

The value to map to the thickness should come from the exact or minimum fields in the shares declared in the associated interest.

If no shares are present, a 1px line should be used.

A simple page where you can upload or paste BODS data, click a button and see the visualisation

Adding this as we haven't made it explicit in all the talk of visualisation specifics, we'd like to get to the point of having a page we can actually host somewhere that allows people to play with the visualisation.

A textarea and a button to visualise it would probably be preferable to a file 'upload' for the MVP, because then it allows you to edit things and see the changes, but I think we'd happily take whichever is easiest.

Recommend Projects

  • React photo React

    A declarative, efficient, and flexible JavaScript library for building user interfaces.

  • Vue.js photo Vue.js

    🖖 Vue.js is a progressive, incrementally-adoptable JavaScript framework for building UI on the web.

  • Typescript photo Typescript

    TypeScript is a superset of JavaScript that compiles to clean JavaScript output.

  • TensorFlow photo TensorFlow

    An Open Source Machine Learning Framework for Everyone

  • Django photo Django

    The Web framework for perfectionists with deadlines.

  • D3 photo D3

    Bring data to life with SVG, Canvas and HTML. 📊📈🎉

Recommend Topics

  • javascript

    JavaScript (JS) is a lightweight interpreted programming language with first-class functions.

  • web

    Some thing interesting about web. New door for the world.

  • server

    A server is a program made to process requests and deliver data to clients.

  • Machine learning

    Machine learning is a way of modeling and interpreting data that allows a piece of software to respond intelligently.

  • Game

    Some thing interesting about game, make everyone happy.

Recommend Org

  • Facebook photo Facebook

    We are working to build community through open source technology. NB: members must have two-factor auth.

  • Microsoft photo Microsoft

    Open source projects and samples from Microsoft.

  • Google photo Google

    Google ❤️ Open Source for everyone.

  • D3 photo D3

    Data-Driven Documents codes.