Git Product home page Git Product logo

react-native-pure-chart's Introduction

React Native Pure Chart

NPM Version npm License

Pure react native chart library that not using svg or ART but only using react-native components.
(You don't have to import drawing library with react-native link or add ART to your project!)

Demo

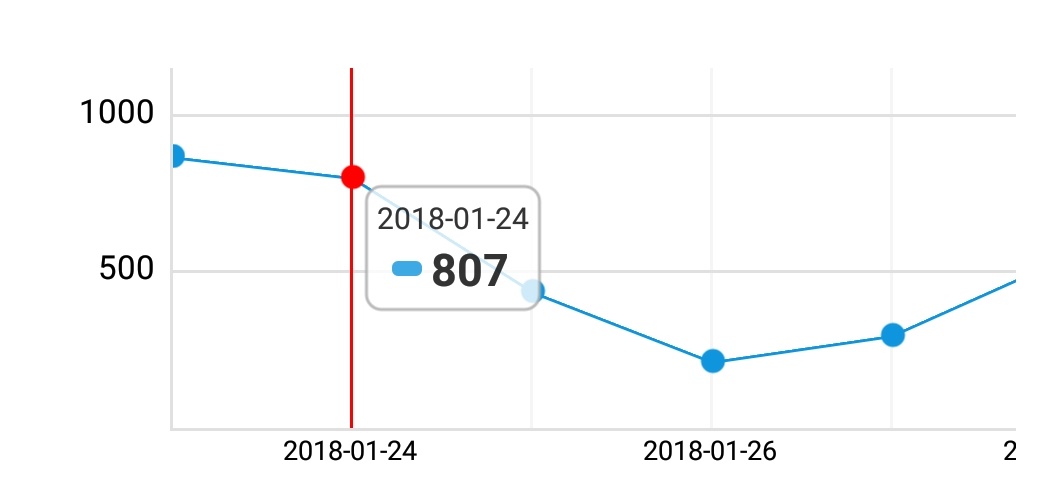
  • LineChart alt tag

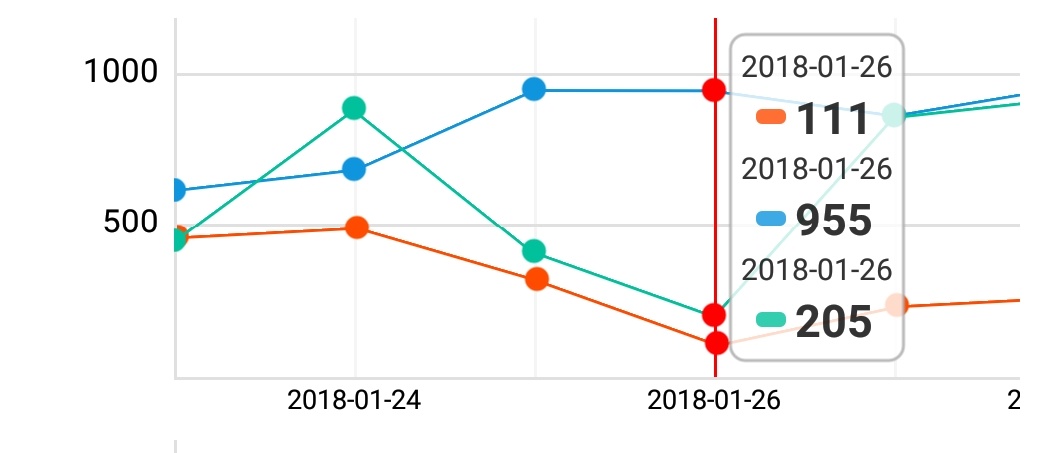
  • LineChart (Multi series) alt tag

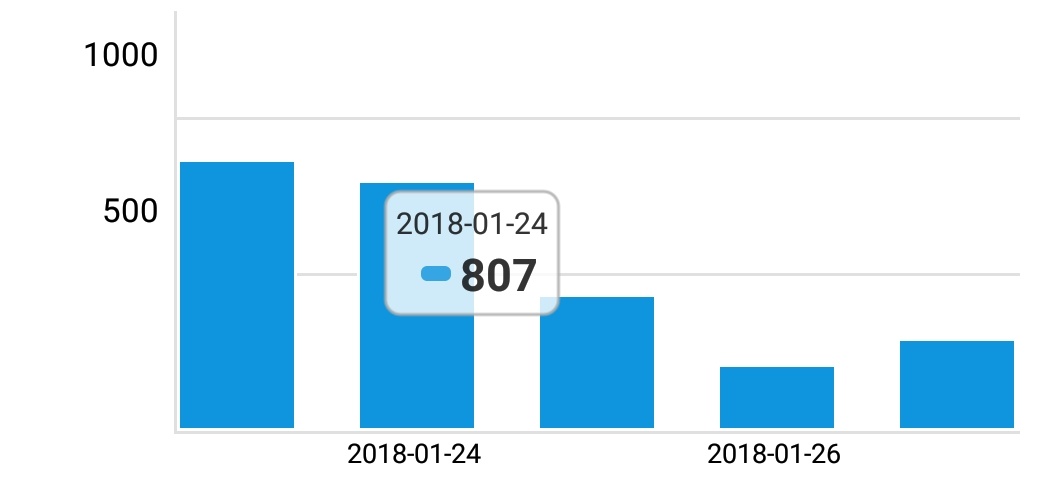
  • BarChart alt tag

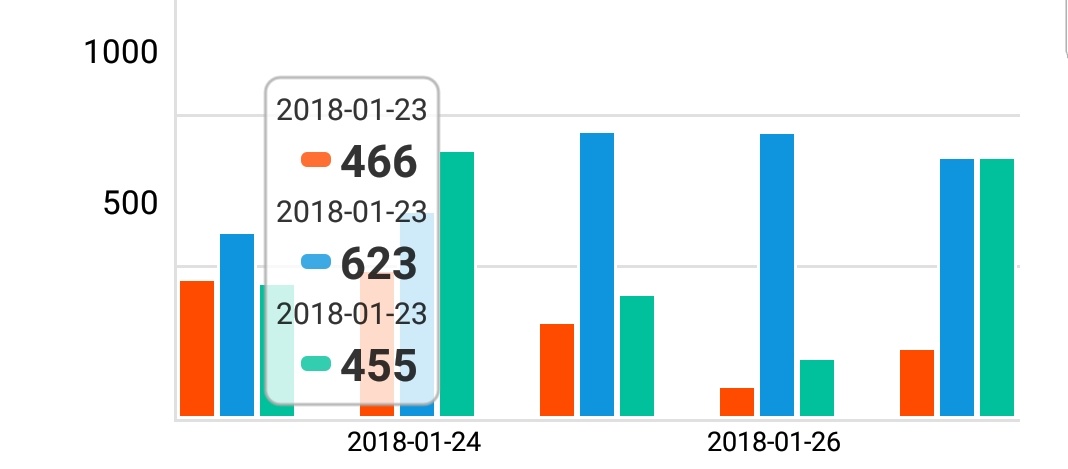
  • BarChart (Multi series) alt tag

  • PieChart (Beta)
    alt tag

Installation

yarn add react-native-pure-chart

Alternatively with npm:

npm install react-native-pure-chart --save

Required

import PureChart from 'react-native-pure-chart';

Usage

Single Series: Simple

render(
  ...
  let sampleData = [30, 200, 170, 250, 10]
  <PureChart data={sampleData} type='line' />
  ...
);

Single Series: with labels

render(
  ...
  let sampleData = [
      {x: '2018-01-01', y: 30},
      {x: '2018-01-02', y: 200},
      {x: '2018-01-03', y: 170},
      {x: '2018-01-04', y: 250},
      {x: '2018-01-05', y: 10}
  ]
  <PureChart data={sampleData} type='line' />
  ...
);

Multi Series: Simple

render(
  ...
  let sampleData = [
      [
        {seriesName: 'series1', data: [30, 200, 170, 250, 10], color: '#297AB1'},
        {seriesName: 'series2', data: [20, 100, 150, 130, 15], color: 'yellow'}
      ]
  ]
  <PureChart data={sampleData} type='line' />
  ...
);

Multi Series: with labels

render(
  ...
  let sampleData = [
    {
      seriesName: 'series1',
      data: [
        {x: '2018-02-01', y: 30},
        {x: '2018-02-02', y: 200},
        {x: '2018-02-03', y: 170},
        {x: '2018-02-04', y: 250},
        {x: '2018-02-05', y: 10}
      ],
      color: '#297AB1'
    },
    {
      seriesName: 'series2',
      data: [
        {x: '2018-02-01', y: 20},
        {x: '2018-02-02', y: 100},
        {x: '2018-02-03', y: 140},
        {x: '2018-02-04', y: 550},
        {x: '2018-02-05', y: 40}
      ],
      color: 'yellow'
    }
  ]
  <PureChart data={sampleData} type='line' />
  ...
);

Pie chart

render(
  ...
  let sampleData = [
    {
      value: 50,
      label: 'Marketing',
      color: 'red',
    }, {
      value: 40,
      label: 'Sales',
      color: 'blue'
    }, {
      value: 25,
      label: 'Support',
      color: 'green'
    }

  ]
  <PureChart data={sampleData} type='pie' />
  ...
);

Props

type: string

type of chart. ['line' | 'bar' | 'pie'] is now available

height: number

height of chart

data: array

data for chart

  var data = [30, 200, 170, 250, 10] 
  var dataWithLabel = [
    {x: '2017-10-01', y: 30}, 
    {x: '2017-10-02', y: 200}, 
    {x: '2017-10-03', y: 170} ... 
  ]

multi series data for chart

  var data = [
    {seriesName: 'series1', data: [30, 200, 170, 250, 10], color: '#297AB1'},
    {seriesName: 'series2', data: [40, 250, 110, 290, 14], color: 'blue'}
  ]
  var dataWithLabel = [
    {
      seriesName: 'series1',
      data:[
        {x: '2017-10-01', y: 30}, 
        {x: '2017-10-02', y: 200}, 
        {x: '2017-10-03', y: 170} ...
      ],
      color: '#297AB1'
    },
    .... 
  ]
customValueRenderer: func

add custom value on the point

  <PureChart type={'line'}
    data={data}
    width={'100%'}
    height={200}
    customValueRenderer={(index, point) => {
      if (index % 2 === 0) return null
      return (
        <Text style={{textAlign: 'center'}}>{point.y}</Text>
      )
    }}/>

alt tag

numberOfYAxisGuideLine: number

set number of Y Axis guide line

Contributing

Contributions are welcome. Any kind of contribution, such as writing a documentation, bug fix, or solving issues are helpful.

The master branch of this repository contains the latest stable release of react-native-pure-chart. In general, pull requests should be submitted from a separate branch starting from the develop branch.

License

MIT

react-native-pure-chart's People

Contributors

kingwang09 avatar oksktank avatar overpresentme avatar zxcv551133 avatar

Stargazers

 avatar  avatar  avatar  avatar  avatar  avatar  avatar  avatar  avatar  avatar  avatar  avatar  avatar  avatar  avatar  avatar  avatar  avatar  avatar  avatar  avatar  avatar  avatar  avatar  avatar  avatar  avatar  avatar  avatar  avatar  avatar  avatar  avatar  avatar  avatar  avatar  avatar  avatar  avatar  avatar  avatar  avatar  avatar  avatar  avatar  avatar  avatar  avatar  avatar  avatar  avatar  avatar  avatar  avatar  avatar  avatar  avatar  avatar  avatar  avatar  avatar  avatar  avatar  avatar  avatar  avatar  avatar  avatar  avatar  avatar  avatar  avatar  avatar  avatar  avatar  avatar  avatar  avatar  avatar  avatar  avatar  avatar  avatar  avatar  avatar  avatar  avatar  avatar  avatar  avatar  avatar  avatar  avatar  avatar  avatar  avatar  avatar  avatar  avatar  avatar

Watchers

 avatar  avatar  avatar  avatar  avatar  avatar  avatar  avatar  avatar  avatar  avatar

react-native-pure-chart's Issues

Show all X-axis labels, X-axis start offset

Can I display all X-axis labels, not only every second label? Something like numberOfXAxisGuideLine would be enough.

Also, can I add a start offset to X-axis (left margin?) so the first X-axis value would not lay on the Y-axis?

Btw. thank you for this library.

prop type `height` is invalid

Warning: Failed prop type: PureChart: prop type height is invalid; it must be a function, usually from the prop-types package, but received number.

  • node_modules/fbjs/lib/warning.js:33:20 in printWarning
  • node_modules/fbjs/lib/warning.js:57:25 in warning
  • node_modules/prop-types/checkPropTypes.js:52:18 in checkPropTypes
  • node_modules/react/cjs/react.development.js:1171:19 in validatePropTypes
  • node_modules/react/cjs/react.development.js:1268:22 in createElementWithValidation
  • pages/Living.js:16:24 in render
  • node_modules/react-proxy/modules/createPrototypeProxy.js:44:35 in proxiedMethod
  • node_modules/react-native/Libraries/Renderer/ReactNativeRenderer-dev.js:7866:21 in finishClassComponent
  • ... 18 more stack frames from framework internals

If data is all 0, then axis is NaN

let graph = [0,0,0,0,0] 
render() {
    <View>
         <PureChart data={graph} type='line' />
    </View>
}

renders this:
nan

Am I doing something wrong or there is an issue?

Thanks :)

axis spacing

Love the library! Is there an easy way to customise the chart or is it all set (ie i need to reduce the spacing between data points)

Updating values on chart with setState

Hi,

I am trying to update the data on the chart every second, using setState. I can see that the state is updating as expected, but the chart values are not changing with it. Why might this be?

Thanks,

Alex

How can i add min value to line chart ?

Currently line chart y axis starts from 0 to max value. Is it possible to replace 0 with some other value so that y axis line will be between custom min value to max value ?

Chart does not resize when device rotated

There is no documented way to specify width='100%' or style prop for PureChart components so when you rotate a device, the width of the view changes to match the available space in the view.

Skip the value for x-axis point in line chart.

Is there a way to skip the value for x-axis point ? For example , i want to pass 7 x-axis points , but i have data for 5 points only. So that can we skip drawing line chart for those 2 points.
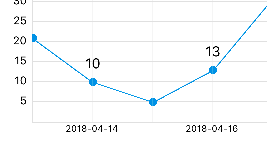
In the given image as there is no data for 10th and 12th April it just connects to next line. Is it possible to draw like this ?
line chart

Default borderColor for BarChart.

I think there should be a prop for defaultBorderColor in Barchart as now it is fixed to #FFFFFF . If someone have white background for chart then only the selected bar will be visible.

range bar chart

bar
I want bar chart like this. Please give me solution how to get this result using pure bar chart

styling the grid?

Cool package, especially for no requiring react link.

Is there a way to style the grid? Or styling the font families of labels and stuff?

Bar Chart colors

Hi,

Thanks for the amazing Library, it looks really nice and performs well too. Just a question. Is there a way to change the colours of the individual barchats instead of rendering them uniformly in 1 color?

e.g:
let sampleData = [ { seriesName: 'test2', data: [140, 160], color: [colors.lightNavy, colors.Red], }, ];

So that both the charts have their own individual colors?. I've tried passing primaryColor, secondary and other props, but nothing seems to be working. Any help or advice would be appreciated.

Thanks

How to fit the data within the graph

I am graphing some data on the line chart. The entire data is not visible within the graph's width and I have to scroll to see all the data. Is there a way to fit the entire data within the visible graph? I don't want to scroll to see the data. Thanks!

Pie Chart Rendering Issue.

screenshot from 2018-08-18 14-25-17

  1. Values not properly separate in the pie chart. Sales have a value of 2000(22.4 %) but in the pie chart, it has less space.
  2. Some strang borderline appear in the chart as well

LineChart - Add option to not draw points

Hi,
It would be nice to have the option to not draw points. I was able to accomplish this by commenting out drawPoint calls in drawCoordinates call in LineChart component. Thanks!

How to draw the chart without grid lines, set the axis and label colors and...

Hi,

  1. Is it possible to draw the chart without the grid lines? If the option is not available via the API, can you point me to where I can modify the source code to accomplish this?

  2. Is it possible to set the X and Y axis and label colors? If the options is not available via the API, can you point me to where I can modify the source code to accomplish this?

  3. Is it possible to draw real-time data with this chart? Basically, I would like to "append" data as it comes in to the chart.

Thanks for all your help and all your hard work for this library.

there is a problem with scroll

Hi,

After the last updating to 0.0.14, all works well if you can resolve this problem of scrolling, thank's

Ps: I use it with CRNA and expo projet, so you can test it with to figure out the problem.

purecharteissue

minus data (-x)

how to show minus value in graph

for example
number = [0,10,-20,45,33,55,-90,86];

  • I use minValue props but i couldn't show minus value in my graph
    ========
    thanks pure chart developers

AmbiguousModuleResolutionError

Hi

my app when using react native pure chart with react native, saying that react_native_information.js tries to require accessibilityinfo.js but there is several fils providing this modules, asking to fix it or delet it; and giving a full url of it (accessibilityinfo.android.js) in react native chart part folder;
I delete it but the error remains.

How can I fix it , please ?

Single data Point Bug

First, great work on the components!

Passing a single data point does not render properly.
<PureChart type={'line'} data={
[{ x: '2018-01-01', y: 30 }]
} />

image

and when I tap on the graph, it crashes:

image

Passing multiple points works fine
<PureChart type={'line'} data={
[{ x: '2018-01-01', y: 30 }, { x: '2018-01-01', y: 30 }]
} />

image

Remove the excess of the chart

Hi,

issue

Specifically what should I do to remove this redundancy when rendering the chart? Can anyone help me !

Thanks,

Toby

permanent labels

is their a prop (boolean) to make the label in PIe Chart visible all the time

Width 100%??

I am trying to set the width of the chart to 100%, but nothing is happening. Is it possible to do with your charts?

My Code:
<View>
<PureChart data={sampleData} type='line' width='100%'/>
</View>

Real-time Line Chart

Hi,

I was wondering if you have any ideas on how to make the line chart real-time? Right now, the chart always re-renders (Redraws the entire point list) when new data is set on the chart. Of course, currently there is no way to append new data so that would be something that would need to be added for a real-time chart. Let's imagine we can append new data point to the line chart. I have not been able to figure out how to just render the last point added to the list and not rerender the entire point list/chart. Obviously re-rendering the entire point list each time is very performance intensive and very very slow. Would I need to use setNativeProps() or should I just add a new Animated.View with a new key for each new data appended.

Any hints you can give me would be much appreciated. Thanks again.

width '100%' ???

i don't understand this grammar, and It was wrong in my react-native(0.42).

Error when dataset is not available

Hey,

it's a pretty nice library and thank you for it, but once my dataset is empty I get an error.

It would be great if the dataset is unavailable it wont break and a simple Text field will be appeared instead like No dataset available

I am new in RN but have a short fix for myself right now, but hopefully you can add this feature to the library in the near future.

Attached a photo how my first app handle the empty dataset with your lib.

image 1

Thank you,
Máté

Recommend Projects

  • React photo React

    A declarative, efficient, and flexible JavaScript library for building user interfaces.

  • Vue.js photo Vue.js

    🖖 Vue.js is a progressive, incrementally-adoptable JavaScript framework for building UI on the web.

  • Typescript photo Typescript

    TypeScript is a superset of JavaScript that compiles to clean JavaScript output.

  • TensorFlow photo TensorFlow

    An Open Source Machine Learning Framework for Everyone

  • Django photo Django

    The Web framework for perfectionists with deadlines.

  • D3 photo D3

    Bring data to life with SVG, Canvas and HTML. 📊📈🎉

Recommend Topics

  • javascript

    JavaScript (JS) is a lightweight interpreted programming language with first-class functions.

  • web

    Some thing interesting about web. New door for the world.

  • server

    A server is a program made to process requests and deliver data to clients.

  • Machine learning

    Machine learning is a way of modeling and interpreting data that allows a piece of software to respond intelligently.

  • Game

    Some thing interesting about game, make everyone happy.

Recommend Org

  • Facebook photo Facebook

    We are working to build community through open source technology. NB: members must have two-factor auth.

  • Microsoft photo Microsoft

    Open source projects and samples from Microsoft.

  • Google photo Google

    Google ❤️ Open Source for everyone.

  • D3 photo D3

    Data-Driven Documents codes.