You will build analytics system that would present usage analytics about a website by collecting events sent to the platform (similar to Mixpanel.com).
Clone this repo and build your project on top of it.
-
Setup server
cd servernpm inpm startin/server. (yes, in server)npm run test- runs backend tests (required to pass).
-
Setup client
cd clientnpm inpm startin/client. this can take a while
-
After installing all dependencies, you can also use
npm run devin in either folder to run both concurrently. -
Note: do not delete the root folder's package.json, it is necessary.
- /server
npm run db:seed- reseed the database (does not affect tests.) you can determine different parameters in .env. Useful in case the existing data is has very old dates and you want newer entries.
- Make the following layout for tiles and make it compatible with different tile sizes and different screen sizes.

- Add controls for time-ranges in relevant charts (you can implement it in any way that still works with the default requirements)
- Showing events on Google Map (cluster events).
you can use whichever library you choose, but this one is recommended) - Showing time per url per user
- Showing time spent on each page by all users.
- Showing graph with unique sessions by day with option to change date
- Showing graph with unique sessions by hour with option to change date
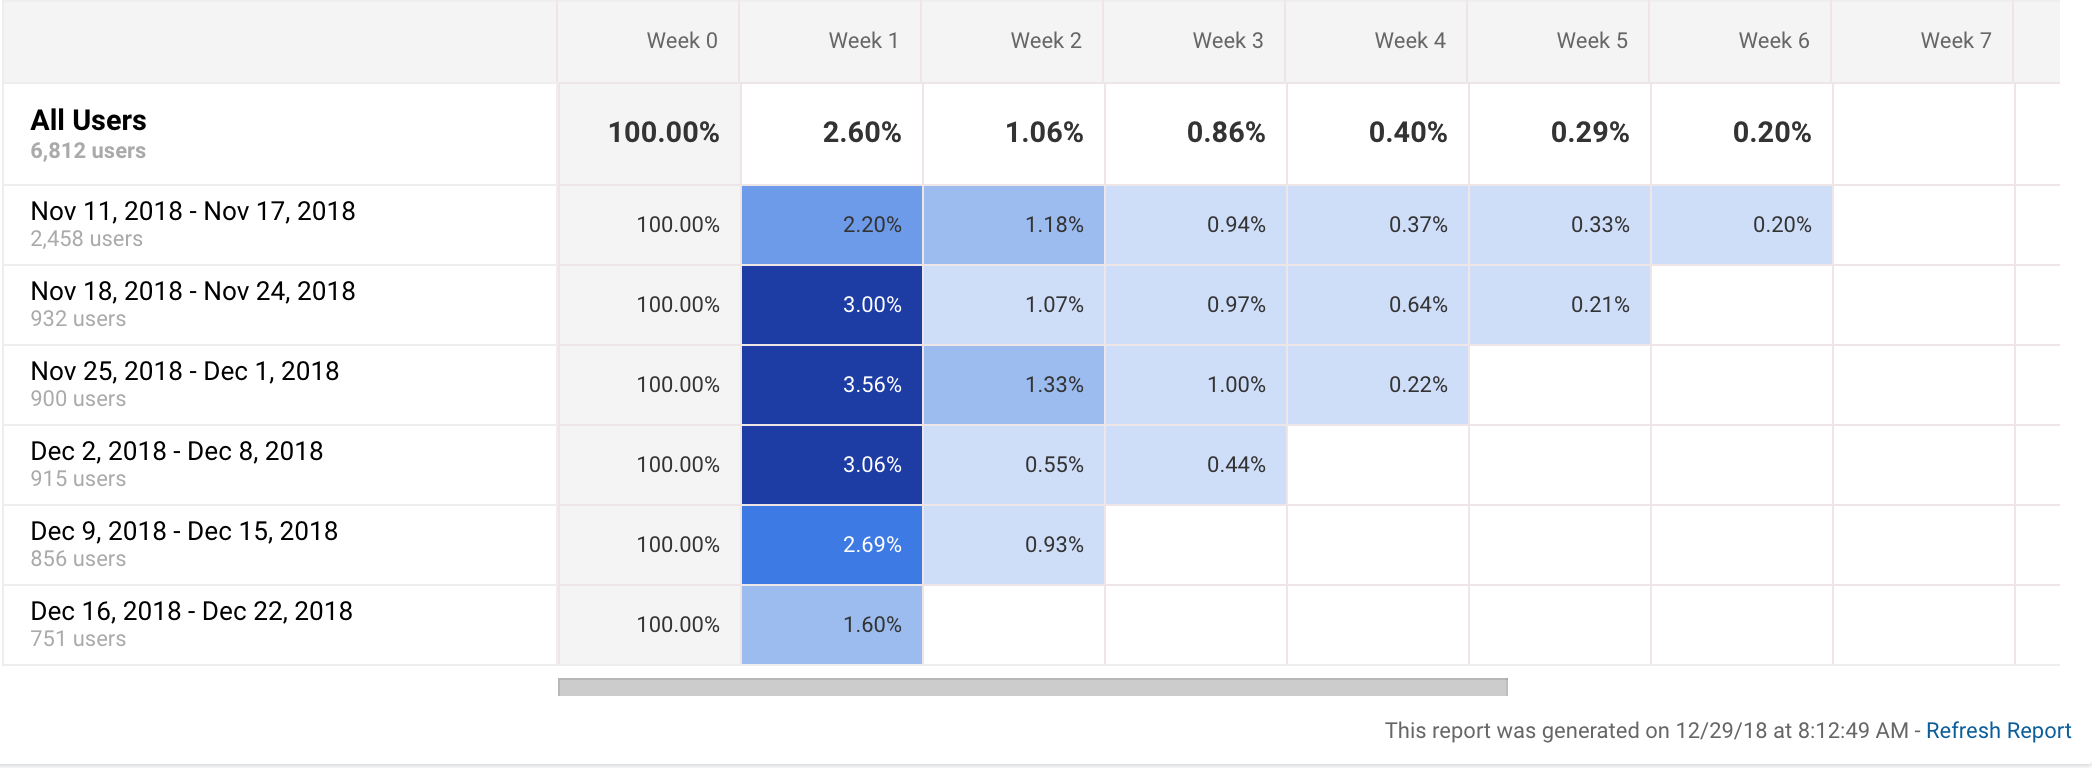
- Showing retention cohort week by week
- Showing log of all events - search option and filter by event name using regex.


The Events Log should load only 10 events, and load more only when the client scrolls down the log.

- Showing page views for on each page.
- Showing pie charts with users by operating system usage.
- POST "/event" - adding new event to event collection.
- An event should be registered on:
- signup
- login
- pageview
- the more the merrier
- Implement the existing endpoints in /events in the following way
- Any other entry point needed.
- Use lowdb and create functions for the 'event' endpoints.
Sample of event (you can add any other properties you if wish):
{
  "_id": "VATb6bdcOEW",
  "session_id": "d788bae3-6909-49a2-a54a-6d50d35b3c70",
  "name": "signup",
  "distinct_user_id": "O-5mFsaxp9",
  "date": 1603316369846,
  "os": "ios",
  "browser": "chrome",
  "geolocation": {
    "location": {
      "lat": 81,
      "lng": 86
    },
    "accuracy": 1708
  },
  "url": "http://localhost3000/signup"
}
note- the repo uses 'husky' and you might find you can't push to github while there are errors in the code.
- All system will be coded using Typescript.
- Add Error Boundaries around each tile (chart).
- Use Styled Components for styling.
- The site uses
xstatestate machines for its data. you can use another method to send out AJAX if you prefer. - Make it responsive for any screen size.
- LINT YOUR CODE
- Passing backend tests will pass the challenge, but other requirements will be inspected.
- Make your own custom tiles.
- Make the tiles resizable.
- Creating piece of code that send events from clients to the server and save it.
- Add an option to change chart type (pie | bars | line) in the same tile
- Make the tiles move by drag and drop.
- Make the time-frame adjustable on all charts
- While loading data show loading indicator you built using canvas tag
- Add any feature you wish
- Add tests for your features
