Git Product home page Git Product logo

go-dcgm's Introduction

Bindings

Golang bindings are provided for NVIDIA Data Center GPU Manager (DCGM). DCGM is a set of tools for managing and monitoring NVIDIA GPUs in cluster environments. It's a low overhead tool suite that performs a variety of functions on each host system including active health monitoring, diagnostics, system validation, policies, power and clock management, group configuration and accounting.

You will also find samples for these bindings in this repository.

Issues and Contributing

Checkout the Contributing document!

go-dcgm's People

Contributors

3xx0 avatar berkaroad avatar bstollenvidia avatar cmurphy avatar dbeer avatar decayofmind avatar dran-dev avatar drauthius avatar dualvtable avatar elezar avatar flx42 avatar glowkey avatar guptanswati avatar jjacobelli avatar klueska avatar maxkochubey avatar mjpieters avatar moconnor725 avatar nikkon-dev avatar nvjmayo avatar nvvfedorov avatar patrungel avatar preved911 avatar renaudwastaken avatar rohit-arora-dev avatar sanjams2 avatar shivamerla avatar squidwarrior avatar srikiz avatar treydock avatar

Stargazers

 avatar  avatar  avatar  avatar  avatar  avatar  avatar  avatar  avatar  avatar  avatar  avatar  avatar  avatar  avatar  avatar  avatar  avatar  avatar  avatar  avatar  avatar  avatar  avatar  avatar  avatar  avatar  avatar  avatar  avatar  avatar  avatar  avatar  avatar  avatar  avatar  avatar  avatar  avatar  avatar  avatar  avatar  avatar  avatar  avatar  avatar  avatar  avatar  avatar  avatar  avatar  avatar  avatar  avatar  avatar  avatar  avatar  avatar  avatar  avatar  avatar  avatar  avatar  avatar  avatar  avatar  avatar  avatar  avatar  avatar  avatar  avatar  avatar  avatar  avatar  avatar  avatar  avatar  avatar  avatar

Watchers

 avatar  avatar  avatar  avatar  avatar  avatar  avatar  avatar

go-dcgm's Issues

monitor job statistic

Hello, i want to use go-dcgm to monitor job statistic which may use API "dcgmJobStartStats" and "dcgmJobStopStats". Do you have a plan to implements it? Hope your reply.

Occasional metric loss and hangs in DCGM Exporter

I encountered a problem with DCGM Exporter where metrics occasionally go missing or hang. I have noticed that this issue does not occur consistently but happens intermittently, causing difficulties in monitoring and data analysis.

Environment Information

  • DCGM Exporter version: 3.1.7-3.1.4
  • Operating system: Ubuntu 20.04
  • GPU model: NVIDIA A100-PCIE-80GB
  • Other relevant software and hardware environment information: run dcgm-exporter as daemonset in kubernetes.

Expected Behavior

I expected DCGM Exporter to consistently collect and export metric data according to the configuration, without experiencing occasional loss and hangs.

Actual Behavior

All GPU metrics suddenly hang.
GPU Metrics hang

dcgm-exporter metrics lost gpu2 util metric.
DCGM metrics lost gpu2

no weired logs for dcgm-exporter and no kernel issues at that point.
dcgm-exporter pod log

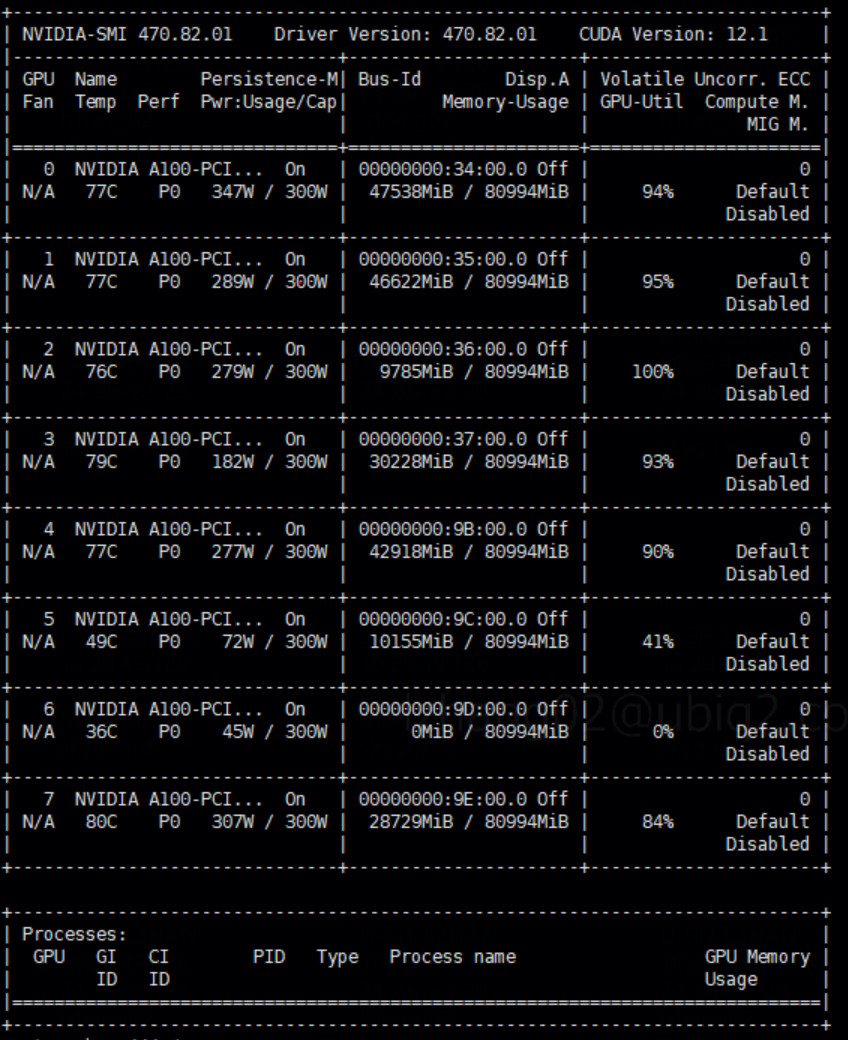
nvidia-smi can display real statistic.

After restart dcgm-exporter pod, everything works fine.

Guess
After read some code about dcgm-exporter which call go-dcgm to fetch gpu metrics, I think there has some wrong with the go-exporter.

Please investigate this issue and provide support and guidance. Thank you!

Question regarding MIG UUID

Is there a way to programmatically get the MIG GPU instance(GI) UUID from GPU ID and GI instance ID? MigEntityInfo contains only the parent device UUID.
nvidia-smi gives the UUID (MIG-a65afc88-50b5-5ccf-b0a8-f93b3247ae9e):

$ nvidia-smi -L
GPU 0: NVIDIA A100 80GB PCIe (UUID: GPU-41255406-c9af-f94b-4ebf-9d57ad1853da)
  MIG 2g.20gb     Device  0: (UUID: MIG-a65afc88-50b5-5ccf-b0a8-f93b3247ae9e)
$

getSupportedMetricGroups function takes uint `grpid` and the value is not used

Hey,

We are looking to use getSupportedMetricGroups(grpid uint) to get the supported profiling fields of a GPU group.

On CLI, we can query the supported fields for different GPU groups, for example: dcgmi profile -g 470 -l.

Our expected usage in the code is:

  1. Create a GPU group and get the handle;
  2. Pass the handle to getSupportedMetricGroups and get the supported metric fields groups for that GPU group;

However, this function takes a uint grpid which is not clear to us how to get in the code. Looking at the implementation the uint grpid is also not used. Please advise.

Test injection events are not caught in embedded mode.

I'm trying to run this sample code in a GPU machine.

dcgm.Init(dcgm.Standalone,"localhost","0")

and I run injection with $ dcgmi test --inject --gpuid 0 -f 230 -v 64

$ ./health 
2024/05/10 23:57:38 Policy successfully set.
2024/05/10 23:57:38 Listening for violations...
2024/05/10 23:57:40 PolicyViolation      : XID Error
Timestamp  : 2024-05-10 23:57:41 +0000 UTC
Data       : {65}
2024/05/10 23:57:45 PolicyViolation      : XID Error
Timestamp  : 2024-05-10 23:57:46 +0000 UTC
Data       : {64}

dcgm.Init(dcgm.Embedded)

and I run injection with $ dcgmi test --inject --gpuid 0 -f 230 -v 64

$ ./health 
2024/05/10 23:57:38 Policy successfully set.
2024/05/10 23:57:38 Listening for violations...

I want to know if this is an issue with the test tool, or will embedding mode miss the events during real incidents as well?

side: I cannot run Standalone mode because I want to run this in a docker, and standalone is giving some systemctl errors

Error setting up dcgm with startHostEngine mode from a golang based container

I am creating a monitoring-agent based on golang using docker to build the image, and also install dcgm. My golang application uses startHostEngine mode to init dcgm client.

This agent image is pulled in a kubernetes pod as a daemonset. Inside the pod, I am getting below error.
error connecting to nv-hostengine: Host engine connection invalid/disconnected

Earlier, I had a separate container in the node to run my nvidia-dcgm image nvcr.io/nvidia/cloud-native/dcgm:3.3.5-1-ubuntu22.04, and used standAlone mode to connect- it worked fine.

I was able to successfully run it using embedded mode and eliminate the use of separate dcgm server container. But this broke my capability to ssh into the ec2 instance and run dcgmi test --inject commands to test error scenarios.

  1. Is there a way to run dcgmi test with embedded mode that could work for my setup? I have also tried to make it work by ssh'ing inside the kubernetes pod of monitoring-agent but that does not work and I get below error.
sh-4.2$ dcgmi test --inject --gpuid 0 -f 202 -v 99999
Error: unable to establish a connection to the specified host: localhost
Error: Unable to connect to host engine. Host engine connection invalid/disconnected.

Just FYI, in this setup, I do not get any errors for dcgm.Init(dcgm.Embedded)
2. I switched to using dcgm.Init(dcgm.StartHostEngine) as StartHostengine is the mode which starts nv-hostengine, and also gives me the hope that it would eliminate server container + able to test using dcgmi. But currently I am facing init errors.
Error connecting to nv-hostengine: Host engine connection invalid/disconnected

concurrent calls to the dcgm.GetProcessInfo() fucntion sometimes block

On T4 GPU machine, concurrent calls to the dcgm.GetProcessInfo() function sometimes block. The dcgm.GetProcessInfo() function allow concurrent reqeust to the DCGM module?

this is my code:

func (nm *nvidiaManager) doWork(numDevices int) {
	ticker := time.NewTicker(nm.processMetricsInterval)
	for {
		select {
		case <-nm.dcgmDone:
			klog.Warningf("update nvidia device process info task exit.")
			return
		case <-ticker.C:
		}

		pidCh := make(chan devicePidItem, numDevices*2)
		wg := sync.WaitGroup{}
		for _, item := range devicePids {
			pidCh <- devicePidItem{minor: item.minor, pid: item.pid}
			wg.Add(1)
			go nm.handleDevicePid(pidCh, wg.Done)
		}
		wg.Wait()
	}
}

func (nm *nvidiaManager) handleDevicePid(pidCh chan devicePidItem, done func()) {
	defer done()
	for {
		select {
		case item := <-pidCh:
			start := time.Now()
			groupId, err := dcgm.WatchPidFields()
			if err != nil {
				_ = dcgm.DestroyGroup(groupId)
				return
			}

			// wait for watches to be enabled
			time.Sleep(3000 * time.Millisecond)

			klog.V(4).Infof("Enabling DCGM watches to start collecting process %v stats. cost time: %v", item.pid, time.Since(start))

			start = time.Now()
			processInfo, err := dcgm.GetProcessInfo(groupId, uint(item.pid))
			if err != nil {
				_ = dcgm.DestroyGroup(groupId)
				return
			}
			....
		default:
			return
		}
	}
}

C.dcgmGetPidInfo method block.
image

C.dcgmGetPidInfo() block debug log.
image

default makefile build failure

ubuntu@ip-172-31-7-67:~/go-dcgm$ make
go build ./pkg/dcgm
go: downloading github.com/bits-and-blooms/bitset v1.2.1
go: downloading github.com/Masterminds/semver v1.5.0
cd samples/deviceInfo; go build
cd samples/dmon; go build
cd samples/health; go build
cd samples/hostengineStatus; go build
cd samples/policy; go build
cd samples/processInfo; go build
cd samples/restApi; go build
go: downloading github.com/gorilla/mux v1.8.0
cd samples/topology; go build
go test ./tests
/tmp/go-build4207065393/b001/tests.test: symbol lookup error: /tmp/go-build4207065393/b001/tests.test: undefined symbol: dcgmGetAllDevices
FAIL github.com/NVIDIA/go-dcgm/tests 0.003s
FAIL
make: *** [Makefile:32: test-main] Error 1

api Init error

there maybe an error in api.go Init function

only err is nil, dcgmInitCounter plus 1

if err == nil { dcgmInitCounter += 1 }

run topology sample error

i in the having nvlink gpu node, run sample dir topology file, but can't true get nvlink type,
expect topology is:

            GP0      GP1      GP2     GP3
GP0     X          NV2      NV1      NV2
GP1.    NV2     X           NV2      NV2
GP2    NV1.     NV2      X          NV1
GP3    NV2     NV2      NV1      X

but got is:

            GP0      GP1      GP2     GP3
GP0     X          N/A      N/A      N/A
GP1.    N/A     X           N/A      N/A
GP2    N/A.     N/A      X          N/A
GP3    N/A     N/A      N/A      X

Deadlock in ListenForPolicyViolations

Hi Team,

We have uncovered that a deadlock can occur when calling the ListenForPolicyViolations function. This happens when there are immediate (or pending) policy violations to a previously registered policy that is being subscribed to.

Here are the steps where this happens in the underlying registerPolicy function called by ListenForPolicyViolations

  1. Policy is created in set by the call to setPolicy (code)
  2. Policy violation occurs for the group (e.g. a PCIe replay counter increment)
  3. Callback is registered for the policy created in step (1) by calling dcgmPolicyRegister (code)

At this point, the callback is invoked BEFORE the dcgmPolicyRegister call completes. The dcgmPolicyRegister function cannot complete until the callbacks complete due to locking in the underlying dcgm c++ library (not exactly sure which locks are causing it but there is extensive locking going on — ex1, ex2). The callback function is ViolationRegistration which performs blocking writes to the underlying go channels (note: these go channels are only buffered by 1 item so this blocks when there are >1 notifications to send). However, nothing is reading from the callback go channels because the processing of the callback channels is not setup till AFTER the dcgmPolicyRegister function returns (code). This leads to the deadlock — the notification callbacks cannot proceed because nothing is processing them, but the notification processor cannot be started because the callbacks cannot complete (and therefore allow dcgmPolicyRegister to complete).

A few solutions I can quickly think of:

  1. Increase the buffer size of the channels — this would provide temporary - but not complete - relief from the problem since the callback function can write to the channels even if nothing is processing yet. However, the channels can still fill up before processing starts so this only reduces the probability of the issue occurring.
  2. Start processing the callbacks channels before registering the callback function on the policy — this solution would likely require that the library user pass the violation channel into the ListenForPolicyViolations function. They would also need to begin asynchronously processing notifications out of the passed channel before the call. This should prevent the channel writes from blocking since something is already processing.
  3. Drop messages when channel is full — Instead of blocking until a write to the channel can occur, the notifications could simply be logged and dropped when the channel is full
  4. Address issue in the underlying c++ library — There are some comments in the code which suggest this issue of processing the violations before the callback registration can complete is a known issue (code). Therefore, it seems that it's possible to handle such cases in the library itself — possibly by dropping the notifications similar to option (3). Perhaps the synchronization can also be improved to avoid this as well.

It is likely that all of these could be used together in unison as well.

Lost dcgm policy notifications

Hi Team,

I was looking into an issue we were seeing with only being able to receive one message at a time when setting up a policy for listening to DCGM notifications. I noticed some strange code that looks potentially buggy to me but it's likely Im just missing something.

The code in reference is here. I have also copied this below:

publisher := newPublisher()
_ = publisher.add()
_ = publisher.add()

// broadcast
go publisher.broadcast()

go func() {
	for {
		select {
		case dbe := <-callbacks["dbe"]:
			publisher.send(dbe)
		case pcie := <-callbacks["pcie"]:
			publisher.send(pcie)
		case maxrtpg := <-callbacks["maxrtpg"]:
			publisher.send(maxrtpg)
		case thermal := <-callbacks["thermal"]:
			publisher.send(thermal)
		case power := <-callbacks["power"]:
			publisher.send(power)
		case nvlink := <-callbacks["nvlink"]:
			publisher.send(nvlink)
		case xid := <-callbacks["xid"]:
			publisher.send(xid)
		}
	}
}()

// merge
violation = make(chan PolicyViolation, len(channels))
go func() {
	for _, c := range channels {
		val := <-c
		violation <- val
	}
	close(violation)
}()

There is some missing context here, but this is the important part. What I see happening is that the channels in the callbacks array are being read in two places at the same time: (1) in the go routine with the select statement (2) in the "merge" go routine with the for/range loop. This seems odd to me. Go doesnt duplicate messages in a channel for multiple readers so these two routines would appear to be fighting for the same messages as far as I can tell. Furthermore, if the "select" routine gets the messages, it will send them to the publisher, which appears to publish to two subscribers that are not being listened to (What exactly is going on there? Im not sure). The main issue I see is the duplicate simultaneous reading from the same channels

I would like to know if I am missing something here. It seems that notifications could get lost if the select statement receives them and they get sent to the publisher that has unused subscribers. Am I understanding things correctly?

restAPI example throws template error when hitting the /device/info endpoint

The restAPI example code is throwing this error when you attempt to hit the /device/info endpoint:

$> curl localhost:8070/dcgm/device/info/id/0
Driver Version         : 460.91.03
GPU                    : 0
DCGMSupported          : Yes
UUID                   : GPU-957108de-cfa3-9448-9bf9-62961b74aff3
Brand                  : Unknown
Model                  : Tesla T4
Serial Number          : 1560121400704
Vbios                  : 90.04.96.00.02
InforomImage Version   : G183.0200.00.02
Bus ID                 : 00000000:00:1E.0
BAR1 (MB)              : 256
FrameBuffer Memory (MB): 15109
Bandwidth (MB/s)       : 15760
Cores (MHz)            : template: :14:37: executing "" at <.Clocks.Cores>: can't evaluate field Clocks in type *dcgm.Device

The issue looks to be here:

Cores (MHz) : {{or .Clocks.Cores "N/A"}}
Memory (MHz) : {{or .Clocks.Memory "N/A"}}
where the template string is referencing .Clocks.Cores and .Clocks.Memory which are part of the DeviceStatus struct, not the Device struct.

dcgm.GetProcessInfo() function returns "No data is available"

I am trying to build a GPU stats collector into some of our tooling, and I am using the "dcgm.GetProcessInfo()" function to get data about various processes. I am trying to use DCGM in embedded mode so I do not have to install the full DCGM package into every host running in our system. However I am having trouble getting it to work reliably as I keep getting "No data is available" errors, similar to NVIDIA/gpu-monitoring-tools#32. I modeled my implementation off the RestAPI example, specifically this: https://github.com/NVIDIA/go-dcgm/blob/main/samples/restApi/handlers/dcgm.go#L114

I am testing by doing the following:

  1. Run nbody as myself in benchmark mode.
  2. Run my stats collector code as root, passing in the PID of nbody

In the stats collector, this function is called in a loop, with a sleep of 1-10s between each call:

func (g *gpuStatManagerImpl) GetProcessInfo(pid uint) ([]stats.GPUStat, error) {
	if g.dcgmWatchGroup == nil {
		if err := g.watchPidFields(); err != nil {
			return nil, err
		}
		// If this is the first time this function as been called, sleep for 1s to allow stats collection to init
		time.Sleep(1 * time.Second)
	}

	pInfo, err := dcgm.GetProcessInfo(*g.dcgmWatchGroup, pid)
	if err != nil {
		return nil, err
	}
	gpuStats := make([]stats.GPUStat, len(pInfo))
	for i, p := range pInfo {
		gpuStats[i] = stats.GPUStat{
			DeviceID:          p.GPU,
			SMUtilization:     p.ProcessUtilization.SmUtil,
			MemoryUtilization: p.ProcessUtilization.MemUtil,
			PowerUsageJoules:  p.ProcessUtilization.EnergyConsumed,
		}
	}

	if err := g.watchPidFields(); err != nil {
		return gpuStats, err
	}

	return gpuStats, nil
}

func (g *gpuStatManagerImpl) watchPidFields() error {
	group, err := dcgm.WatchPidFields()
	if err != nil {
		return err
	}
	g.dcgmWatchGroup = &group
	return nil
}

I have tried using the go-dcgm RestAPI example, and the processInfo example, and both get the same "No data is available" error. Here is the nvidia-smi output of the GPU. As you can see, the nbody process is running:

+-----------------------------------------------------------------------------+
| NVIDIA-SMI 460.91.03    Driver Version: 460.91.03    CUDA Version: 11.2     |
|-------------------------------+----------------------+----------------------+
| GPU  Name        Persistence-M| Bus-Id        Disp.A | Volatile Uncorr. ECC |
| Fan  Temp  Perf  Pwr:Usage/Cap|         Memory-Usage | GPU-Util  Compute M. |
|                               |                      |               MIG M. |
|===============================+======================+======================|
|   0  Tesla T4            Off  | 00000000:00:1E.0 Off |                    0 |
| N/A   72C    P0    69W /  70W |   1484MiB / 15109MiB |    100%      Default |
|                               |                      |                  N/A |
+-------------------------------+----------------------+----------------------+

+-----------------------------------------------------------------------------+
| Processes:                                                                  |
|  GPU   GI   CI        PID   Type   Process name                  GPU Memory |
|        ID   ID                                                   Usage      |
|=============================================================================|
|    0   N/A  N/A     14335      C   ./nbody                          1481MiB |
+-----------------------------------------------------------------------------+

Question related to GPU device attributes

Hi, I am looking for a programmatic way to get the Streaming Multiprocessor (SM) count for T4/A100(mig enabled, disabled) cards. Is there an API in go-dcgm or go-nvml that I can use?

How do i get the fields using golang?

Team,

there is no samples available in the repository to retrieve the information of fields.

Lets say I want to extract DCGM_FI_DEV_PCIE_LINK_WIDTH for all the GPUs on the server.

Can someone help me how to extract this value?

It might be simple but I am struggling to retrieve it using go-lang

DCGM_FI_DEV_PCIE_LINK_WIDTH = 238

Compile error, cannot use _Ctype_long(ts) (value of type _Ctype_long) as _Ctype_longlong

Env -
1/ go version go1.17.3 darwin/amd64
2/ macos Sonoma 14.3, kern.version: Darwin Kernel Version 23.3.0: Wed Dec 20 21:28:58 PST 2023; root:xnu-10002.81.5~7/RELEASE_X86_64
3/ package - datacenter-gpu-manager-3.3.3-1-x86_64.rpm (link - https://developer.download.nvidia.com/compute/cuda/repos/rhel9/x86_64/)

this DCGM package is added as a dependency to another package being build.

Compile failure message -


# github.com/NVIDIA/go-dcgm/pkg/dcgm
../AL2_x86_64/DEV.STD.PTHREAD/build/private/bgospace/Go3p-Github-NVIDIA-Go-dcgm/src/github.com/NVIDIA/go-dcgm/pkg/dcgm/internal.go:80:14: cannot use _Ctype_long(ts) (value of type _Ctype_long) as _Ctype_longlong value in struct literal
make: *** [install] Error 1

provide more flexible WatchPidFields API

I am using go-dcgm to estimate power consumption of processes running in MIG device. The current pid watch function watchPidFields doesn't track the MIG devices.

Would it be possible to create yet another API to pass group.handle directly? So caller can create device groups that consist MIG and call the dcgm API to watch pid.

A hypothetical prototype is like the following:

func WatchPidFieldsWithGroup(updateFreq, maxKeepAge time.Duration, maxKeepSamples int, groupId GroupHandle) error {
	result := C.dcgmWatchPidFields(handle.handle, groupId.handle, C.longlong(updateFreq.Microseconds()), C.double(maxKeepAge.Seconds()), C.int(maxKeepSamples))
	if err := errorString(result); err != nil {
		return &DcgmError{msg: C.GoString(C.errorString(result)), Code: result}
	}
	_ = UpdateAllFields()
	return nil
}

always return 0, when get GPU of process info by `dcgm.GetProcessInfo(XXX)`

Run benchmarks with 2 gpus, and compare with ./processInfo -pid 203639 and nvidia-smi.

'GPU ID' from ./processInfo -pid 203639 is GPU-0, GPU-0. But in nvidia-smi is GPU-0, GPU-1.

python3 ./benchmarks/scripts/tf_cnn_benchmarks/tf_cnn_benchmarks.py \
        --forward_only \
        --batch_size=16 \
        --model=resnet50  \
        --num_gpus=2 \
        --num_batches=500000 \
        --num_warmup_batches=10 \
        --data_name=imagenet \
        --allow_growth=True
root@k8s-node1:~/go-dcgm/samples/processInfo# ./processInfo -pid 203639
2024/04/07 11:51:51 Enabling DCGM watches to start collecting process stats. This may take a few seconds....
----------------------------------------------------------------------
GPU ID			     : 0
----------Execution Stats---------------------------------------------
PID                          : 203639
Name                         : tf_cnn_benchmar
Start Time                   : 2024-04-03 20:29:37 +0800 CST
End Time                     : Running
----------Performance Stats-------------------------------------------
Energy Consumed (Joules)     : 0
Max GPU Memory Used (bytes)  : 5453643776
Avg SM Clock (MHz)           : 1590
Avg Memory Clock (MHz)       : 5000
Avg SM Utilization (%)       : 21
Avg Memory Utilization (%)   : 16
Avg PCIe Rx Bandwidth (MB)   : 9223372036854775792
Avg PCIe Tx Bandwidth (MB)   : 9223372036854775792
----------Event Stats-------------------------------------------------
Single Bit ECC Errors        : N/A
Double Bit ECC Errors        : N/A
Critical XID Errors          : 0
----------Slowdown Stats----------------------------------------------
Due to - Power (%)           : 0
       - Thermal (%)         : 0
       - Reliability (%)     : 9223372036854775792
       - Board Limit (%)     : 9223372036854775792
       - Low Utilization (%) : 9223372036854775792
       - Sync Boost (%)      : 0
----------Process Utilization-----------------------------------------
Avg SM Utilization (%)       : 48
Avg Memory Utilization (%)   : 38
----------------------------------------------------------------------
----------------------------------------------------------------------
GPU ID			     : 0
----------Execution Stats---------------------------------------------
PID                          : 203639
Name                         : tf_cnn_benchmar
Start Time                   : 2024-04-03 20:29:37 +0800 CST
End Time                     : Running
----------Performance Stats-------------------------------------------
Energy Consumed (Joules)     : 0
Max GPU Memory Used (bytes)  : 227540992
Avg SM Clock (MHz)           : 585
Avg Memory Clock (MHz)       : 5000
Avg SM Utilization (%)       : N/A
Avg Memory Utilization (%)   : N/A
Avg PCIe Rx Bandwidth (MB)   : 9223372036854775792
Avg PCIe Tx Bandwidth (MB)   : 9223372036854775792
----------Event Stats-------------------------------------------------
Single Bit ECC Errors        : N/A
Double Bit ECC Errors        : N/A
Critical XID Errors          : 0
----------Slowdown Stats----------------------------------------------
Due to - Power (%)           : 0
       - Thermal (%)         : 0
       - Reliability (%)     : 9223372036854775792
       - Board Limit (%)     : 9223372036854775792
       - Low Utilization (%) : 9223372036854775792
       - Sync Boost (%)      : 0
----------Process Utilization-----------------------------------------
Avg SM Utilization (%)       : 0
Avg Memory Utilization (%)   : 0
----------------------------------------------------------------------
root@k8s-node1:~/go-dcgm/samples/processInfo# nvidia-smi 
Sun Apr  7 11:52:05 2024       
+-----------------------------------------------------------------------------+
| NVIDIA-SMI 470.82.01    Driver Version: 470.82.01    CUDA Version: 11.7     |
|-------------------------------+----------------------+----------------------+
| GPU  Name        Persistence-M| Bus-Id        Disp.A | Volatile Uncorr. ECC |
| Fan  Temp  Perf  Pwr:Usage/Cap|         Memory-Usage | GPU-Util  Compute M. |
|                               |                      |               MIG M. |
|===============================+======================+======================|
|   0  Tesla T4            Off  | 00000000:00:07.0 Off |                    0 |
| N/A   64C    P0    71W /  70W |   5204MiB / 15109MiB |      0%      Default |
|                               |                      |                  N/A |
+-------------------------------+----------------------+----------------------+
|   1  Tesla T4            Off  | 00000000:00:08.0 Off |                    0 |
| N/A   43C    P0    27W /  70W |    220MiB / 15109MiB |      0%      Default |
|                               |                      |                  N/A |
+-------------------------------+----------------------+----------------------+
                                                                               
+-----------------------------------------------------------------------------+
| Processes:                                                                  |
|  GPU   GI   CI        PID   Type   Process name                  GPU Memory |
|        ID   ID                                                   Usage      |
|=============================================================================|
|    0   N/A  N/A    203639      C   python3                          5201MiB |
|    1   N/A  N/A    203639      C   python3                           217MiB |
+-----------------------------------------------------------------------------+

DCGM exporter is not working on AWS A10 instances (G5.2xlarge, G5.12xlarge)

We recently added AWS G5(A10) tier to our Kubernetes clusters. The applications are running alright on the new tier. However the DCGM exporter pods are have a tough time with scheduling and going into CRASHLOOPBACKOFF.

DCGM Version: 2.3.2-2.6.3-ubuntu20.04
NVIDIA driver version: 460.106.00
OS/Flatcar version: 3139.2.0
Kernel: 5.15.32-flatcar

Logs:
root@bb23c6bb6001:/infrastructure# k logs dcgm-exporter-w9fhs -n monitoring dcgm-exporter time="2022-05-27T08:53:58Z" level=info msg="Starting dcgm-exporter" time="2022-05-27T08:53:58Z" level=info msg="DCGM successfully initialized!" time="2022-05-27T08:53:59Z" level=info msg="Collecting DCP Metrics" time="2022-05-27T08:53:59Z" level=fatal msg="Error watching fields: Feature not supported" root@bb23c6bb6001:/infrastructure#

Recommend Projects

  • React photo React

    A declarative, efficient, and flexible JavaScript library for building user interfaces.

  • Vue.js photo Vue.js

    🖖 Vue.js is a progressive, incrementally-adoptable JavaScript framework for building UI on the web.

  • Typescript photo Typescript

    TypeScript is a superset of JavaScript that compiles to clean JavaScript output.

  • TensorFlow photo TensorFlow

    An Open Source Machine Learning Framework for Everyone

  • Django photo Django

    The Web framework for perfectionists with deadlines.

  • D3 photo D3

    Bring data to life with SVG, Canvas and HTML. 📊📈🎉

Recommend Topics

  • javascript

    JavaScript (JS) is a lightweight interpreted programming language with first-class functions.

  • web

    Some thing interesting about web. New door for the world.

  • server

    A server is a program made to process requests and deliver data to clients.

  • Machine learning

    Machine learning is a way of modeling and interpreting data that allows a piece of software to respond intelligently.

  • Game

    Some thing interesting about game, make everyone happy.

Recommend Org

  • Facebook photo Facebook

    We are working to build community through open source technology. NB: members must have two-factor auth.

  • Microsoft photo Microsoft

    Open source projects and samples from Microsoft.

  • Google photo Google

    Google ❤️ Open Source for everyone.

  • D3 photo D3

    Data-Driven Documents codes.