![]()

The NBA Statistics Dashboard is an innovative and user-focused project that harnesses daily data scraping to create a dynamic platform for NBA enthusiasts, fantasy league participants, and sports bettors. This cutting-edge tool offers a rich set of functionalities, including head-to-head analytics, raw statistics exploration, interactive visualization, team ranking insights, probability distribution graphs, point difference analytics, real-time injury updates, and dynamic raw stats graphs. By providing a comprehensive and customizable view of NBA team dynamics, the dashboard redefines the landscape of NBA statistics, empowering users to make informed decisions in fantasy leagues and sports betting.
Explore a live demonstration of the NBA Statistics Dashboard! Watch the video to see the innovative features, interactive visualizations, and functionalities that empower NBA enthusiasts, fantasy league participants, and sports fanatics. From head-to-head analytics to real-time injury updates, this dashboard redefines the landscape of NBA statistics.
On Basketball Reference, you can find:
-
Player Statistics: Detailed individual player statistics, including points, rebounds, assists, steals, blocks, shooting percentages, and more.
-
Team Statistics: Comprehensive team performance metrics, standings, and historical data.
-
Game Logs: Game-by-game logs for both players and teams, showcasing their performance in each match.
-
Historical Data: Extensive historical data for seasons, playoffs, and championships.
-
Player and Team Comparisons: Tools for comparing the performance of different players or teams.
-
Advanced Statistics: Advanced analytics and metrics that go beyond basic box scores.
-
Player and Team Records: Records and milestones achieved by players and teams throughout NBA history.
-
Trade and Transaction History: Information on player trades and transactions.
-
Head-to-Head Analytics:
- Explore comprehensive head-to-head analytics, providing insights into the performance of two NBA teams when facing each other. Win/loss records, point differentials, and a point difference probability table based on the cumulative distribution function (CDF) of the points from both teams are available for user analysis.
-
Raw Statistics:
- Delve into detailed raw statistics for individual teams, offering information about recent performances, scoring trends, and historical data. The raw statistics section provides a granular view of team performance over a specified number of recent games.
-
Interactive and Dynamic Visualization:
- Enjoy an interactive and dynamically visualized experience. Users can select specific teams, time frames, and game types to view relevant data, making the exploration of statistics intuitive and user-friendly.
-
Team Ranking:
- Utilize the team ranking function to rank NBA teams based on specific criteria, gaining insights into the relative performance of teams within the league.
-
Probability Distribution and CDF Graphs:
- Access Probability Distribution Function (PDF) and Cumulative Distribution Function (CDF) graphs for team vs. team points data. These interactive graphs represent scaled points for the last 5, 10, 15, and all games in the season. Points are scaled to reflect the opposing team's strength, determined by a custom ranking algorithm.
-
Point Difference Interactive Graph:
- Explore an interactive graph displaying the point difference in head-to-head matchups. This graph offers a dynamic visualization of how the point difference between teams varies across different games.
-
Current Injury Table:
- Stay informed about the current injury status of NBA teams. The injury table provides real-time information on player injuries, helping users understand the potential impact on team performance.
-
Dynamic Raw Stats Graphs:
- Access dynamic graphs for raw stats such as win percentage, field goal percentage, 3-point attempts, defensive rebounds, and more. Users can customize the graphs based on their preferences and input criteria.
 The Streamlit-based NBA Statistics Dashboard provides a sleek and user-friendly interface for exploring intricate NBA statistics. Users can effortlessly select games, specify date ranges, and choose points of interest. Once data is processed, the dynamic dashboard unfolds, featuring head-to-head analytics, raw team statistics, and interactive visualizations. With customizable parameters, including team rankings, injury updates, and dynamic raw stats graphs, the interface ensures an immersive and tailored experience for fantasy league players, sports bettors, and basketball enthusiasts alike.
Our ETL (Extract, Transform, Load) pipeline orchestrates a seamless flow of data from Basketball Reference to our Azure Databricks SQL Warehouse, enriching it with analytics. Here's an in-depth breakdown:

- The process commences by extracting raw team data from Basketball Reference, a prominent sports statistics website.
- This data spans a variety of attributes, encompassing player statistics, team performance metrics, and detailed game information.
- Extracted data undergoes transformation using the powerful capabilities of Apache Spark.
- Leveraging Spark DataFrames, we structure, clean, and manipulate data efficiently, enabling complex calculations and aggregations on large datasets.
- Transformed data finds its home in our Azure Databricks SQL Warehouse, a scalable and performant database solution.
- Within the SQL Warehouse, structured tables facilitate easy querying, forming the foundation for subsequent analytics.
- The ETL workflow operates on a daily schedule, triggered precisely at 6 AM.
- This automated execution ensures our database receives regular updates, guaranteeing that analytics are consistently based on the latest information.
- A Python logic script serves as the orchestrator, connecting to our Azure Databricks cluster.
- This script acts as a bridge between stored data and the analytical functionalities, facilitating a seamless flow through the pipeline.
- The analytics phase encompasses a spectrum of calculations and insights derived from the processed team data.
- User-friendly interfaces on our web application provide a rich environment to explore player performance metrics, team comparisons, historical trends, and advanced analytics.
By synergizing the capabilities of Apache Spark, Azure Databricks, and a meticulously designed ETL pipeline, our sports analytics platform ensures a robust and up-to-date foundation. Users gain valuable insights and make informed decisions, navigating the intricate world of basketball with ease.
Probability Distribution and CDF Graphs:
Access Probability Distribution Function (PDF) and Cumulative Distribution Function (CDF) graphs for team vs. team points data. These interactive graphs represent scaled points for the last 5, 10, 15, and all games in the season. Points are scaled to reflect the opposing team's strength, determined by a custom ranking algorithm.
PDF GRAPHS:

CDF GRAPHS:

Point Difference Probabilites Table and Point Difference Interactive Graph:
The Point Difference Probabilities table anticipates future NBA game outcomes by providing a forecast based on cumulative distribution functions (CDF) for points scored by teams. On the other hand, the Point Difference Interactive Graph offers insights into historical trends, considering the point difference across the last 5, 10, and full season games. While the former is geared towards predictive analytics, the latter serves as a retrospective tool, capturing the dynamics of teams in recent matchups and the overall season.


Dynamic Raw Stats Graphs:
Access dynamic graphs for raw stats such as win percentage, field goal percentage, 3-point attempts, defensive rebounds, and more. Users can customize the graphs based on their preferences and input criteria.

Raw Stats Table:
Access raw stats in table form.

Current Injury Table:
Stay informed about the current injury status of NBA teams. The injury table provides real-time information on player injuries, helping users understand the potential impact on team performance.

In this project, we implemented logging to capture various events and activities. The log entries are timestamped and categorized by severity levels, including DEBUG, INFO, WARNING, ERROR, and CRITICAL. The log begins with a DEBUG message at 2023-12-10 14:42:01,325, followed by INFO, WARNING, ERROR, and CRITICAL messages. Subsequently, there is an INFO message indicating that logging is working. The logging then captures details about the processing of different NBA teams, such as ATL, BOS, CLE, NOP, CHI, DAL, DEN, GSW, HOU, LAC, LAL, MIA, MIL, MIN, BKN, NYK, ORL, IND, PHI, PHX, POR, SAC, SAS, OKC, TOR, UTA, MEM, WAS, and DET. Each team's processing includes DEBUG messages for starting HTTPS connections and INFO messages for finishing the processing. The log entries provide insights into the flow of the application, HTTP requests to the NBA stats API, and the successful completion of team processing tasks.

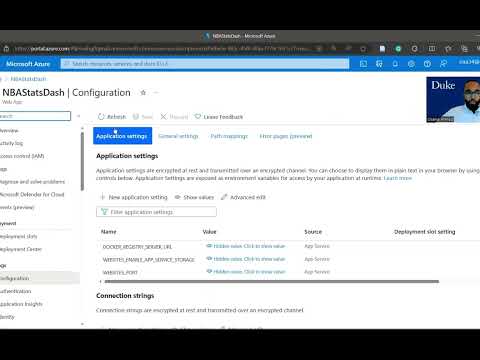
The subsequent deployment on Azure Web App adds another dimension to our architecture. Azure Web App provides a scalable and reliable platform for hosting containerized applications, and by utilizing the Docker image, our microservice seamlessly integrates into this environment. This deployment ensures that our microservice is not only efficiently hosted but also benefits from Azure's robust infrastructure. The use of the Docker image simplifies the deployment process, allowing us to harness the power of Azure Web App for orchestrating a comprehensive and efficient deployment pipeline. This pivotal step offers a public endpoint for our microservice, enhancing accessibility and showcasing the synergies between Docker and Azure Web App in facilitating a seamless integration process.
Docker Imaging and DockerHub
The utilization of Docker plays a pivotal role in achieving the seamless integration of our microservice with a data pipeline. By encapsulating our microservice and its dependencies into a Docker container, we ensure consistent performance across diverse environments. The choice of Python for development aligns with Docker's flexibility, allowing us to package and distribute our microservice effortlessly. Incorporating logging within the microservice enhances visibility into its performance and aids in troubleshooting.
Furthermore, containerizing our microservice with Docker images adds an additional layer of security and efficiency, stripping away unnecessary components and reducing the attack surface. The inclusion of a Dockerfile in the repository streamlines the containerization process and facilitates version control.
Uploading the Docker image to DockerHub serves as a centralized repository, enhancing collaboration and accessibility for future deployments. This step ensures that the functioning container is readily available, adhering to best practices in container management and versioning.

The provided Makefile orchestrates Continuous Integration (CI) and Continuous Deployment (CD) processes. It installs or upgrades project dependencies, runs tests, formats Python code using black, and performs linting with the fast ruff linter. The file includes a target for linting the Dockerfile using a containerized hadolint. Lastly, a placeholder deployment target
(deploy) is available for incorporating deployment steps when ready. Together, these targets offer a streamlined pipeline for maintaining code quality and automating deployment processes.
To evaluate the scalability and performance of the NBA Stats web application rigorously, a systematic load testing procedure was executed using the Locust framework. The objective was to emulate realistic usage scenarios by incrementally elevating the number of virtual users, ultimately reaching a load of 10,000 concurrent users. The resulting load testing diagrams meticulously captured the application's response time per request, demonstrating nuanced variations in performance as the user count escalated. These visual representations provide a substantive understanding of the application's resilience under diverse stress levels. The observed fluctuations in response times offer insights into potential system limitations and pinpoint areas for optimization. The load testing outcomes, presented through meticulous diagrams, furnish valuable data for refining the NBA Stats web application, ensuring robust performance and responsiveness even under high user loads.

Our project meticulously meets the specified requirements for Data Engineering and Infrastructure as Code (IaC), delivering a comprehensive and efficient sports analytics platform. In adherence to Data Engineering principles, we employ Apache Spark, a robust data engineering library, for the transformation phase. This ensures optimal structuring, cleaning, and manipulation of the extracted raw team data, encompassing player statistics, team metrics, and game details. The Azure Databricks SQL Warehouse serves as our scalable and performant database solution, forming the backbone for structured tables and seamless querying. Our ETL pipeline, orchestrated by a Python logic script, operates daily at 6 AM, automating the data flow to guarantee up-to-date analytics. Furthermore, our project excels in IaC by utilizing Azure Databricks for infrastructure setup and management. This integration provides a scalable, cloud-based environment for our ETL processes, aligning with the principles of Infrastructure as Code. The cohesive synergy of Spark, Azure Databricks, and IaC ensures a reliable, efficient, and up-to-date foundation for sports analytics, empowering users with valuable insights for informed decision-making.
In our project, Infrastructure as Code (IaC) is employed using Terraform with Azure to automate and standardize deployment and environment configurations. This approach ensures consistent infrastructure provisioning, minimizing manual errors and enhancing reproducibility across different environments. By leveraging Terraform's capabilities, the team can efficiently manage Azure resources, facilitating scalability and maintaining an agile development workflow.
To run this application from the command line, use the following command:
streamlit run mylib/nbastatsdash.py
This launchs the app on your local machine. Access the Streamlit app through your browser with the provided local URL and Network URL. Notably, the project employs a daily scheduled data retrieval process at 6 am through Databricks. This scheduler pulls NBA statistics data from Basketball Reference links, storing it in Databricks. Furthermore, the application is deployed on Azure Web App, extending its accessibility beyond local environments.
Copilot Contribution
Copilot played a pivotal role in streamlining various aspects of the project. Firstly, it served as an invaluable learning tool for constructing a Locust file tailored for load testing. Copilot generated essential commands and structures, enhancing the efficiency of load testing implementation. Additionally, Copilot proved instrumental in the creation of a Docker image, providing guidance on the necessary commands and configurations. Its assistance extended beyond initial development, aiding in the identification and resolution of errors within the codebase. The AI-powered suggestions significantly expedited the debugging process, contributing to the overall robustness of the application.
Databricks Assistant Integration
The integration of Databricks Assistant, a context-aware AI assistant native to Databricks Notebooks and other editors, substantially improved productivity within the Databricks environment. Leveraging a conversational interface, the Assistant facilitated querying data, generating SQL queries, and explaining complex code. Its seamless interaction with Unity Catalog metadata ensured a personalized experience by understanding tables, columns, and data assets. This functionality was particularly beneficial during the creation of the ETL Data Pipeline, streamlining the process of storing and managing data within Databricks. The Assistant's contextual awareness and query capabilities added a layer of intelligence to data-related tasks, enhancing the overall efficiency of the project.
Limitations:
- Deployment and exploration of Azure's capabilities were constrained by limited credits.
- Storage issues arose from Docker images consuming substantial space on individual laptops, necessitating the sharing of machines.
Improvements:
- Enhanced UI interface for the Streamlit app, incorporating more NBA images and detailed statistics.
- Utilization of additional time and resources to refine the user experience.
- Despite limitations, the current UI features interactive plots, ensuring a user-friendly interface.