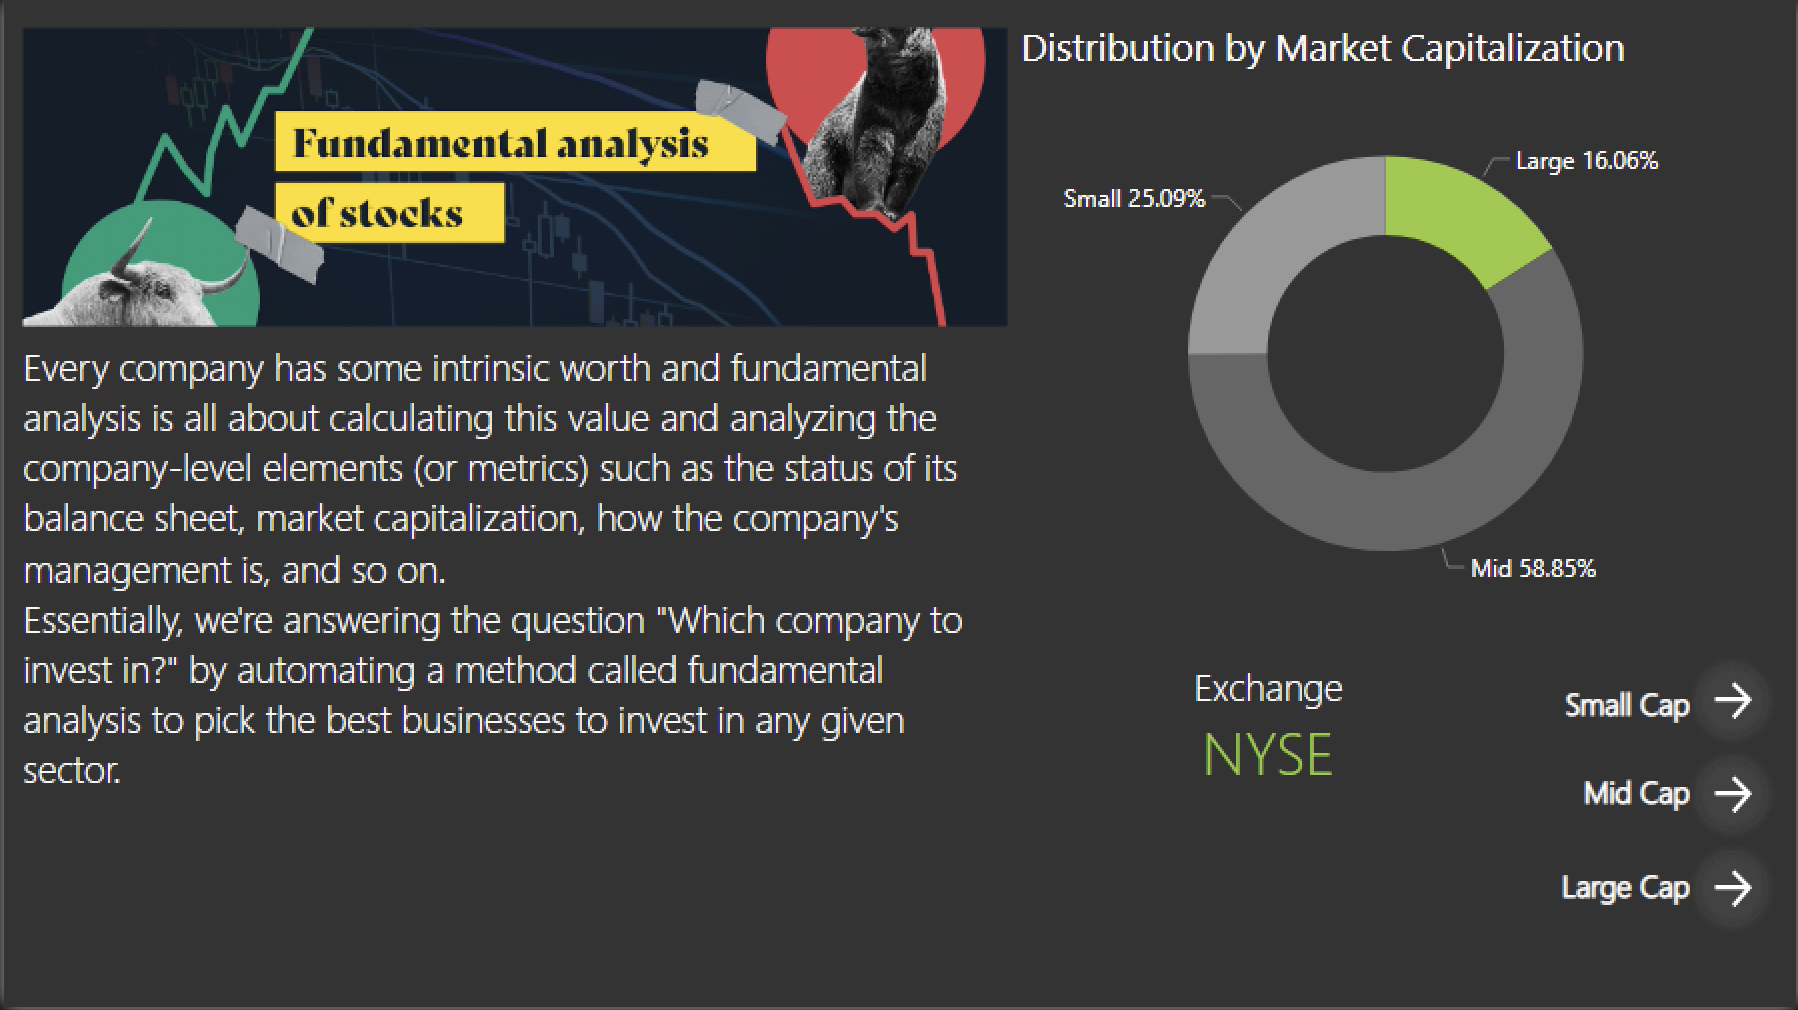
Here we are automating a method called fundamental analysis to pick the best stocks to invest in any given sector. Essentially, a screener which will pick the top stocks for us based on the underlying grading algorithm.
Data shows the fundamentals of various businesses in different sectors which help us in determining the corporate value and give us the top shares in which common investors can look into.
Data Source:
- https://eodhistoricaldata.com/ (You need a paid subscription for using the API)
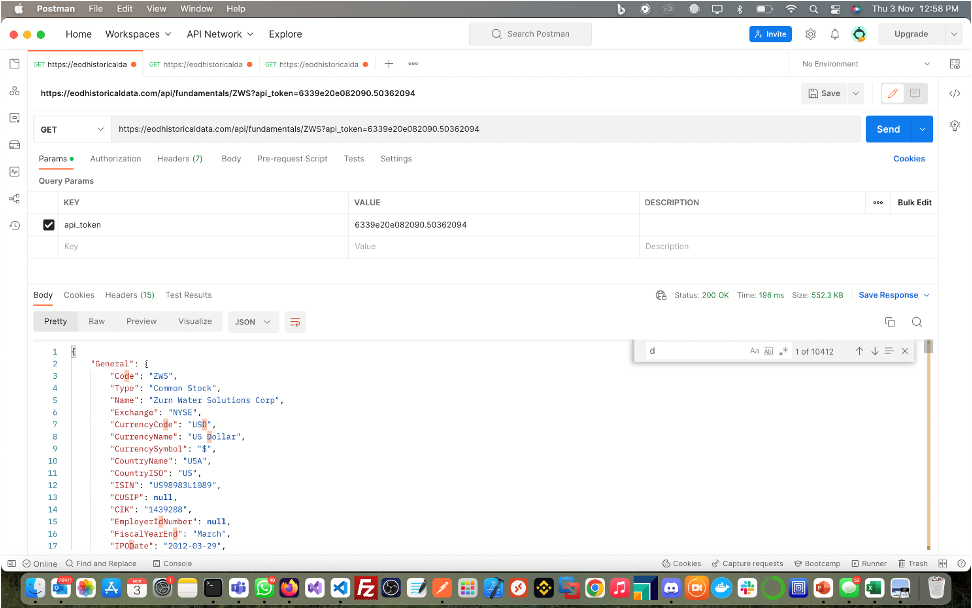
- Yahoo Finance (for ticker prices)
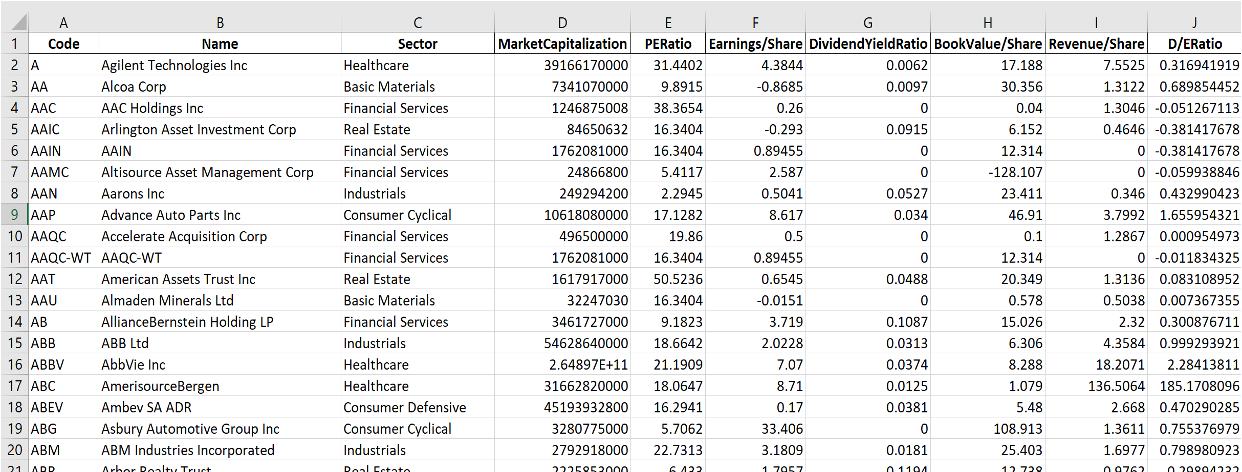
•Data cleaning using pandas and numpy libraries
•Removing null values
•Converting marketCap to billions
•Grouping according to the marketCap (Small, Medium, Large)
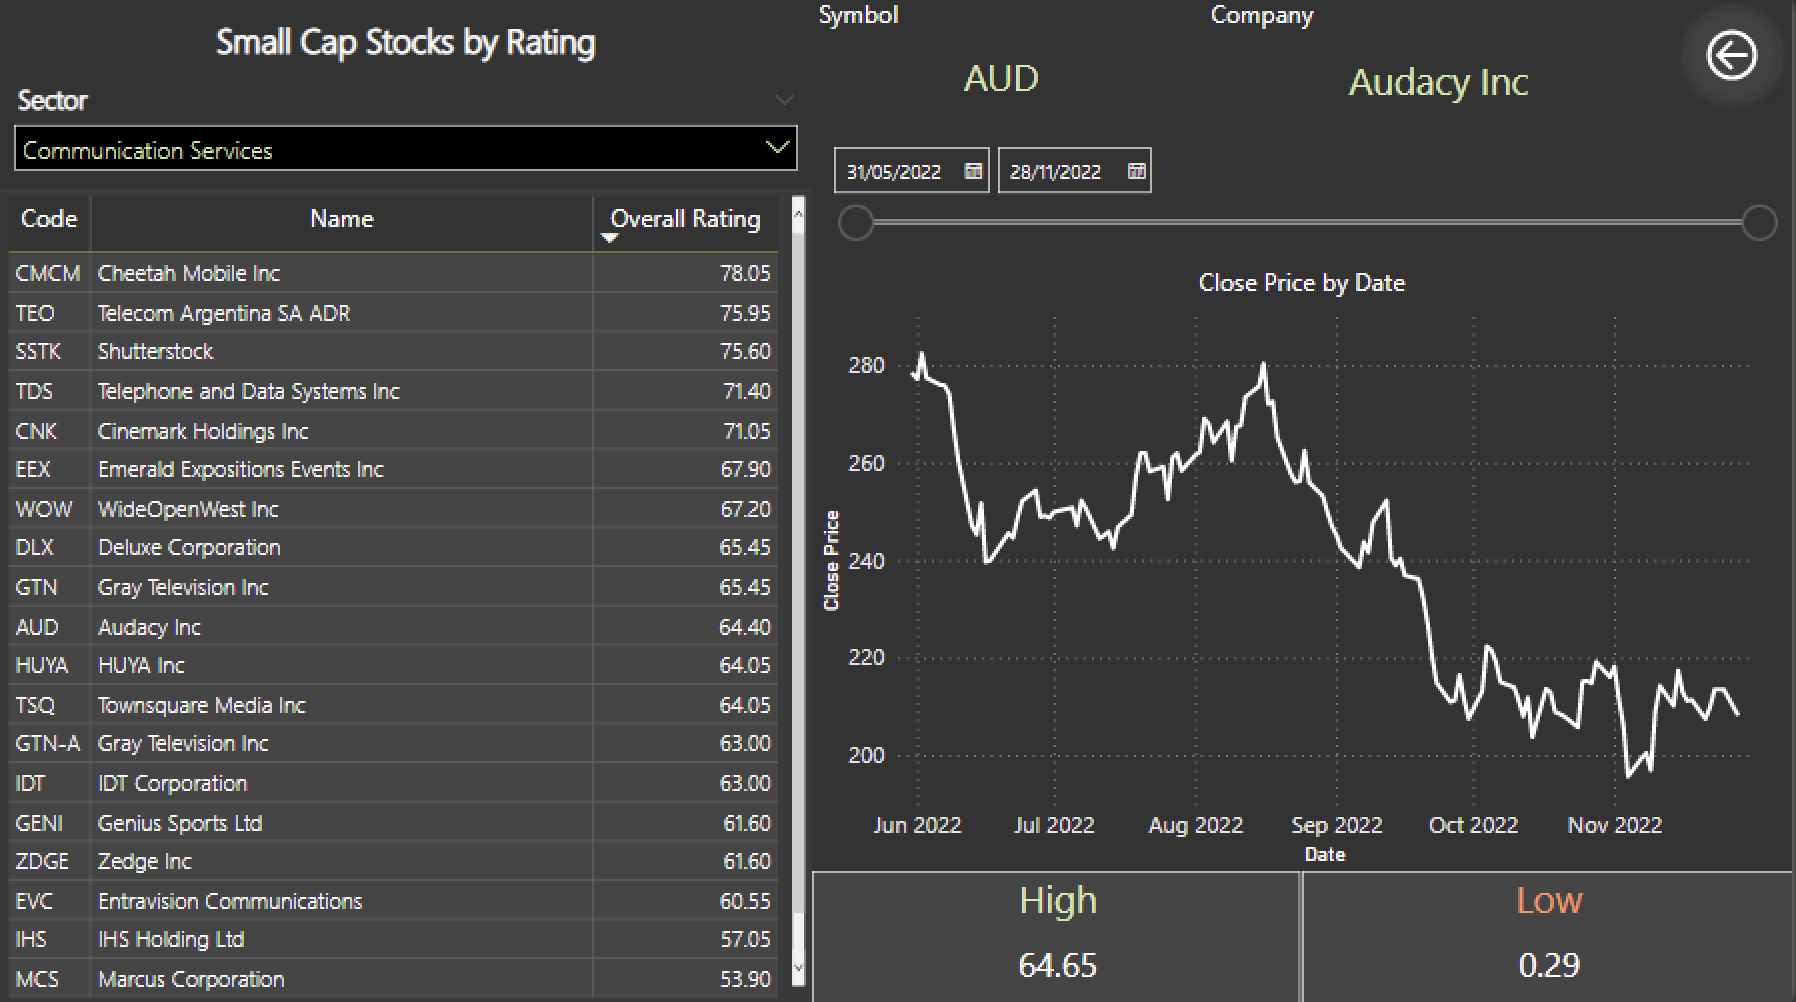
The grading algorithm is based on distribution analysis of values for a certain metric for a specific sector

For instance, to evaluate a stock's net margin, I would look at the net margins of all the stocks in the Communications sector and assign a percentile to the stock's net margin depending on where it falls in the distribution of values.

For metrics where a lower value is considered better, such as P/E ratios, the algorithm will use the 10th percentile as the basis for grading. So if a stock in the Industrials sector has a P/E ratio of 10 and that is in the 10th percentile of all P/E ratios for Industrials stocks, it will be rated A+.
To determine a stock's overall rating, the grades are then changed into numbers for each category, combined together, and multiplied.
Small Cap
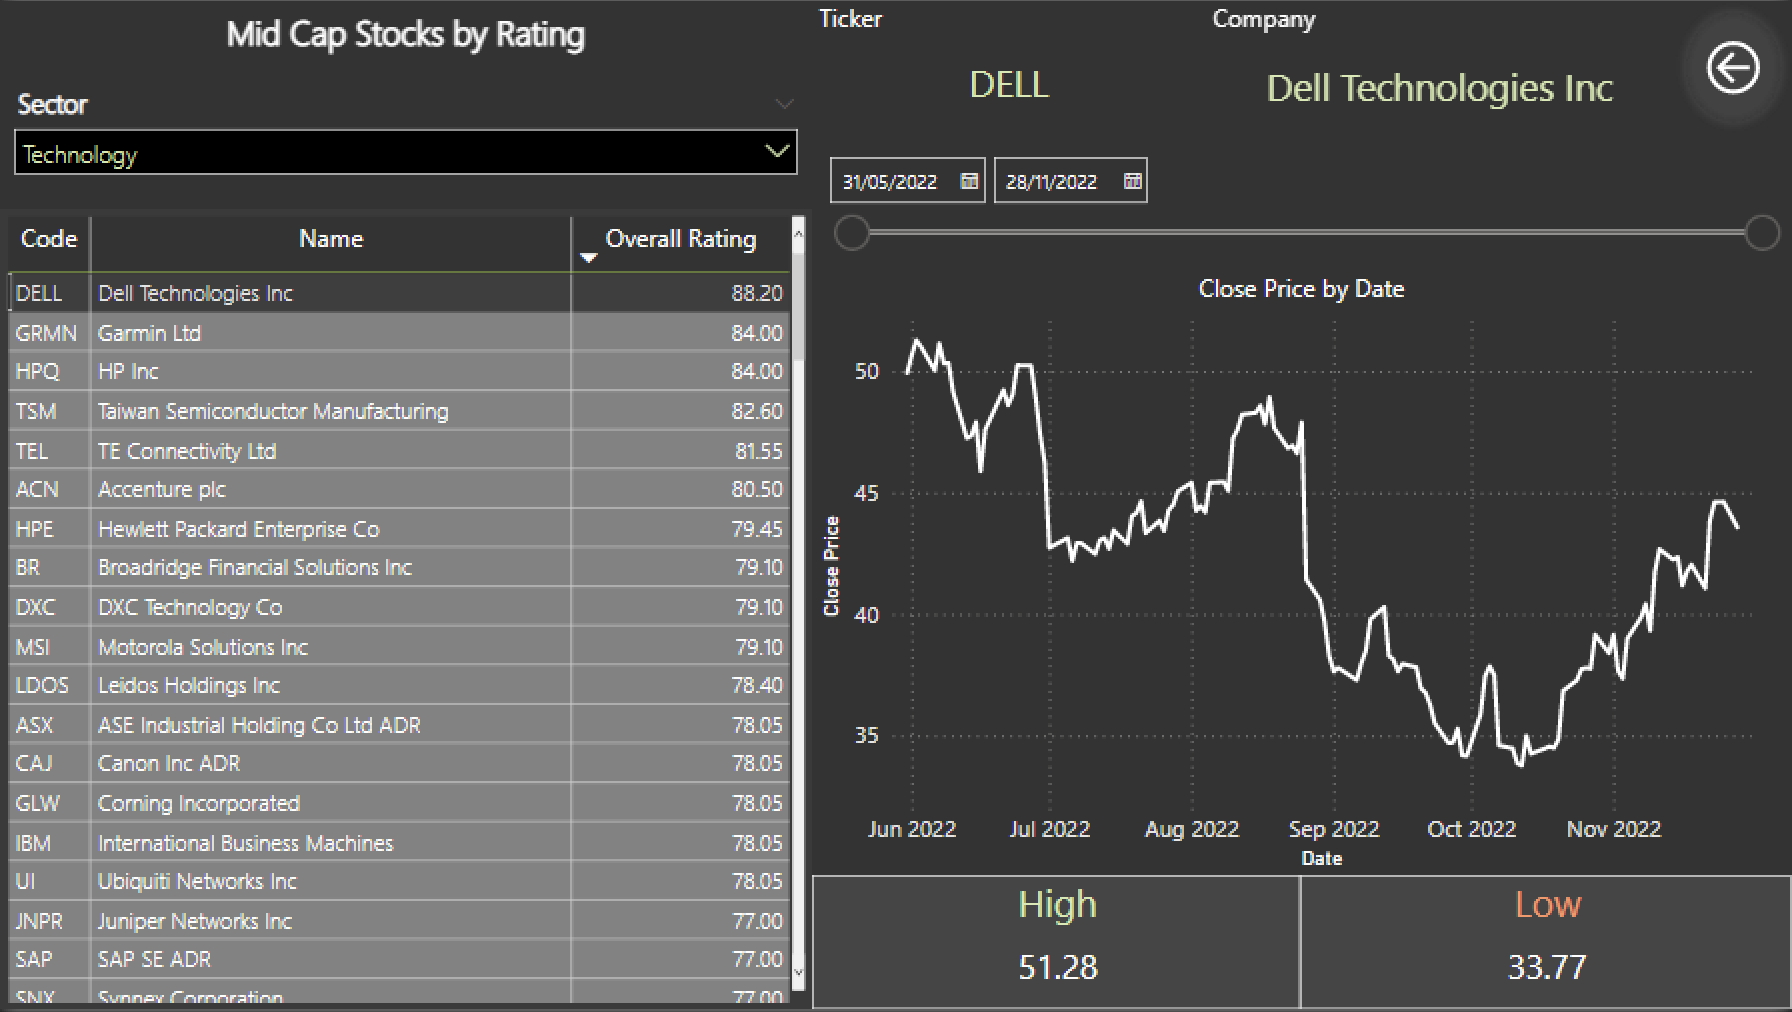
Mid Cap
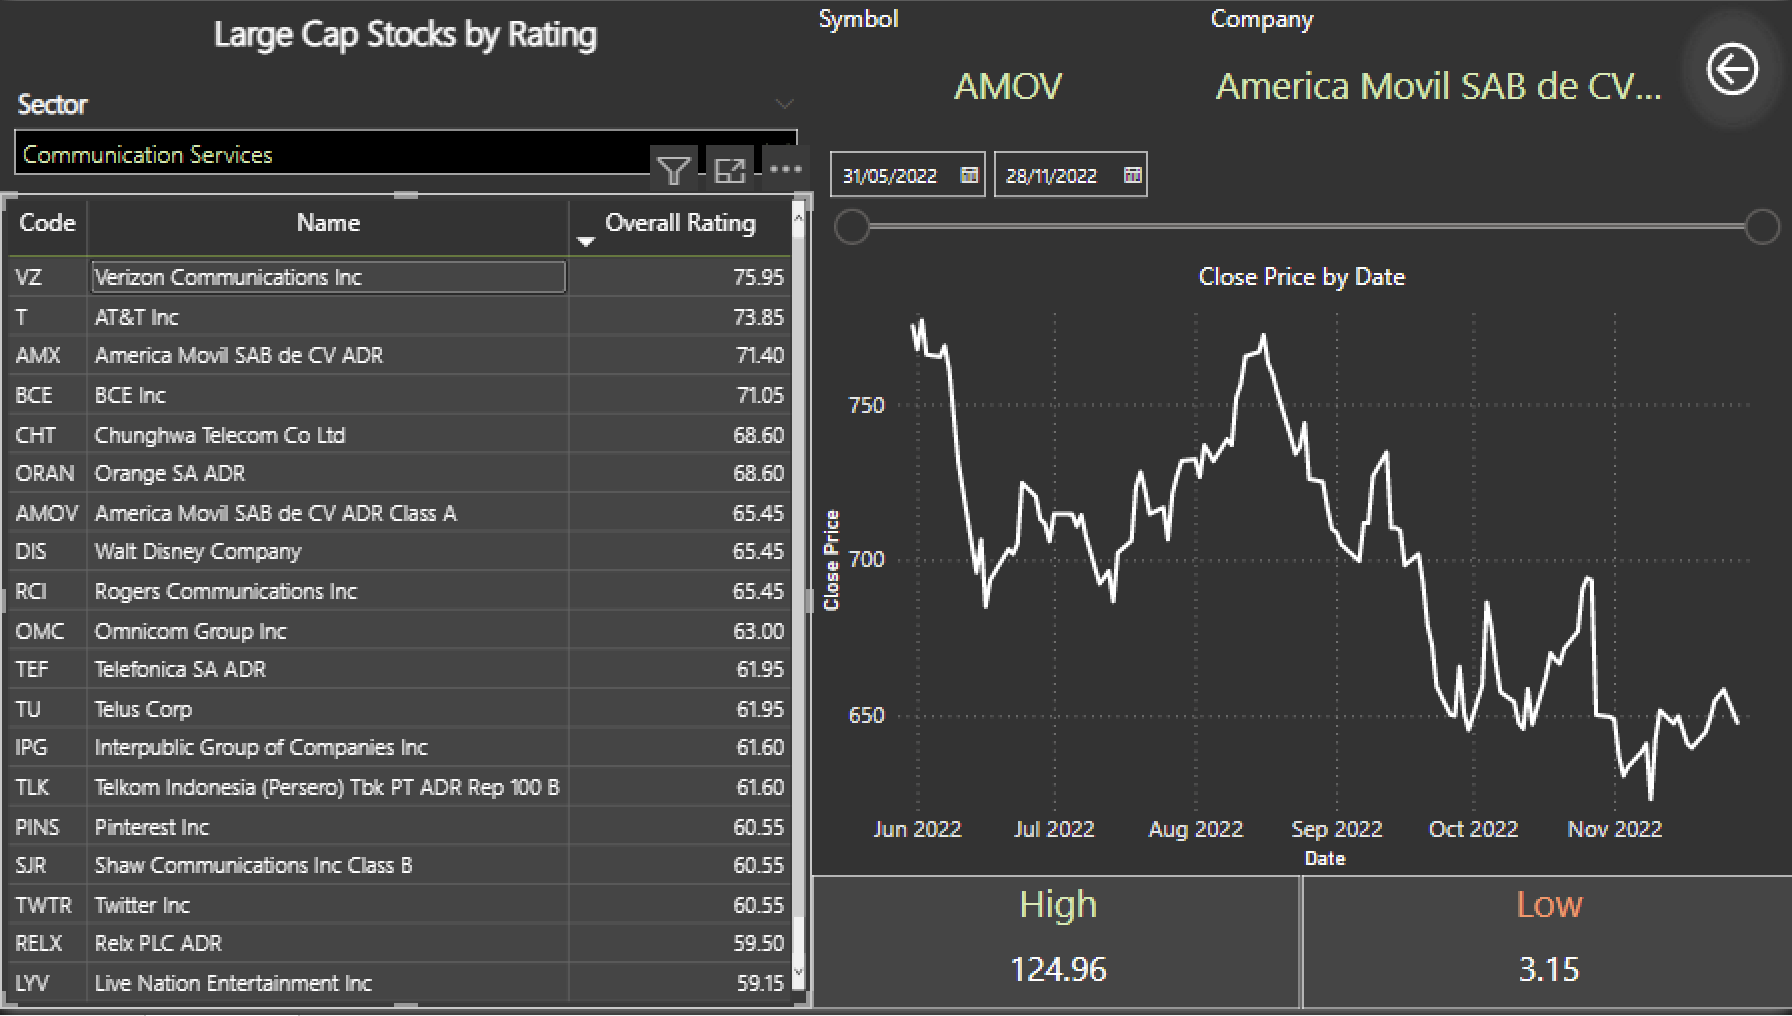
Large Cap
Note
•All the data required for the project is publicly available
•Fundamental analysis provides us the indicators to gauge our understanding on how suitable a company is for us to invest in
•The indicators by nature do not guarantee the returns. They, only help us in making better decisions
•From the perspective of an equity investor, the goal of fundamental analysis is to pick stocks with the right valuation and that have the potential for growth
•On the other hand, technical analysis with price charts can be used to find a profitable stock trade signal
