This book provides an introduction to graph statistics, with a focus on useful representations of graphs and their applications on real data.
Google Drive Brainstorm Book Proposal Compiled Jupyter Book
If you'd like to develop on and build the Network Machine Learning in Python book, you should:
- Clone this repository and run
- Run
pip install -r requirements.txt(it is recommended you do this within a virtual environment) - (Recommended) Remove the existing
network_machine_learning_in_python/_build/directory - Run
jupyter-book build network_machine_learning_in_python/
A fully-rendered HTML version of the book will be built in network_machine_learning_in_python/_build/html/index.html.
The html version of the book is hosted on the gh-pages branch of this repo. A GitHub actions workflow has been created that automatically builds and pushes the book to this branch on a push or pull request to main.
If you wish to disable this automation, you may remove the GitHub actions workflow and build the book manually by:
- Navigating to your local build; and running,
ghp-import -n -p -f network_machine_learning_in_python/_build/html
This will automatically push your build to the gh-pages branch. More information on this hosting process can be found here.
We welcome and recognize all contributions. You can see a list of current contributors in the contributors tab.
This project is created using the excellent open source Jupyter Book project and the executablebooks/cookiecutter-jupyter-book template.
- Sequential color scales: low
#fcfbfd, high#3f007d, discrete RColor Brewer Purples - Divergent: low
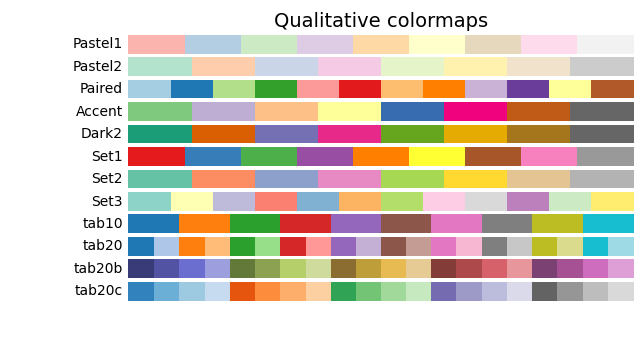
#b2182bmiddle#f7f7f7high#2166ac, discrete RColor Brewer RdBu - Qualitative: Matplotlib Tab10
Functions specific to this book - e.g., plotting functions we use regularly - has been stored in the subpackage below. https://github.com/neurodata/graphbook-code


