Git Product home page Git Product logo

nette / tracy Goto Github PK

View Code? Open in Web Editor NEW
1.7K 73.0 216.0 4.63 MB

๐Ÿ˜Ž Tracy: the addictive tool to ease debugging PHP code for cool developers. Friendly design, logging, profiler, advanced features like debugging AJAX calls or CLI support. You will love it.

Home Page: https://tracy.nette.org

License: Other

PHP 78.96% CSS 5.19% JavaScript 7.90% HTML 7.15% Shell 0.70% Batchfile 0.09%
nette nette-framework tracy dump-variables php debugger profiler ajax php-errors error-handling

tracy's Introduction

Tracy - PHP debugger

Downloads this Month Tests Build Status Windows Latest Stable Version License

Introduction

Tracy library is a useful helper for everyday PHP programmers. It helps you to:

  • quickly detect and correct errors
  • log errors
  • dump variables
  • measure execution time of scripts/queries
  • see memory consumption

PHP is a perfect language for making hardly detectable errors because it gives great flexibility to programmers. Tracy\Debugger is more valuable because of that. It is an ultimate tool among the diagnostic ones.

If you are meeting Tracy for the first time, believe me, your life starts to be divided into one before the Tracy and the one with her. Welcome to the good part!

Documentation can be found on the website.

Do you like Tracy? Are you looking forward to the new features?

Buy me a coffee

Thank you!

Installation and Requirements

The recommended way to is via Composer:

composer require tracy/tracy

Alternatively, you can download the whole package or tracy.phar file.

Tracy compatible with PHP compatible with browsers
Tracy 3.0 PHP 8.0 โ€“ 8.3 Chrome 112+, Firefox 117+, Safari 16.5+
Tracy 2.10 PHP 8.0 โ€“ 8.3 Chrome 64+, Firefox 69+, Safari 15.4+
Tracy 2.9 PHP 7.2 โ€“ 8.2 Chrome 64+, Firefox 69+, Safari 13.1+

Usage

Tracy is activated by calling the `Tracy\Debugger::enable()' method as soon as possible at the beginning of the program, before any output is sent:

use Tracy\Debugger;

require 'vendor/autoload.php'; // alternatively tracy.phar
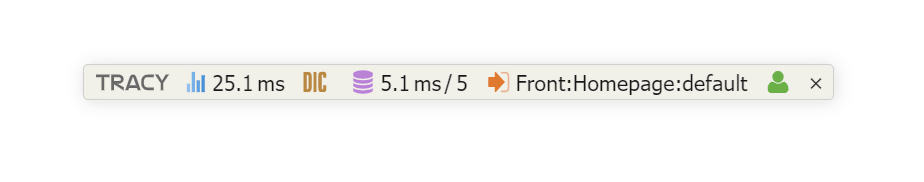
Debugger::enable();

The first thing you'll notice on the page is the Tracy Bar in the bottom right corner. If you don't see it, it may mean that Tracy is running in production mode. This is because Tracy is only visible on localhost for security reasons. To test if it works, you can temporarily put it into development mode using the Debugger::enable(Debugger::Development) parameter.

Tracy Bar

The Tracy Bar is a floating panel. It is displayed in the bottom right corner of a page. You can move it using the mouse. It will remember its position after the page reloading.

Debugger-Bar

You can add other useful panels to the Tracy Bar. You can find interesting ones in addons or you can create your own.

If you do not want to show Tracy Bar, set:

Debugger::$showBar = false;

Visualization of Errors and Exceptions

Surely, you know how PHP reports errors: there is something like this in the page source code:

<b>Parse error</b>:  syntax error, unexpected '}' in <b>HomepagePresenter.php</b> on line <b>15</b>

or uncaught exception:

<b>Fatal error</b>:  Uncaught Nette\MemberAccessException: Call to undefined method Nette\Application\UI\Form::addTest()? in /sandbox/vendor/nette/utils/src/Utils/ObjectMixin.php:100
Stack trace:
#0 /sandbox/vendor/nette/utils/src/Utils/Object.php(75): Nette\Utils\ObjectMixin::call(Object(Nette\Application\UI\Form), 'addTest', Array)
#1 /sandbox/app/forms/SignFormFactory.php(32): Nette\Object-&gt;__call('addTest', Array)
#2 /sandbox/app/presenters/SignPresenter.php(21): App\Forms\SignFormFactory-&gt;create()
#3 /sandbox/vendor/nette/component-model/src/ComponentModel/Container.php(181): App\Presenters\SignPresenter-&gt;createComponentSignInForm('signInForm')
#4 /sandbox/vendor/nette/component-model/src/ComponentModel/Container.php(139): Nette\ComponentModel\Container-&gt;createComponent('signInForm')
#5 /sandbox/temp/cache/latte/15206b353f351f6bfca2c36cc.php(17): Nette\ComponentModel\Co in <b>/sandbox/vendor/nette/utils/src/Utils/ObjectMixin.php</b> on line <b>100</b><br />

It is not so easy to navigate through this output. If you enable Tracy, both errors and exceptions are displayed in a completely different form:

Uncaught exception rendered by Tracy

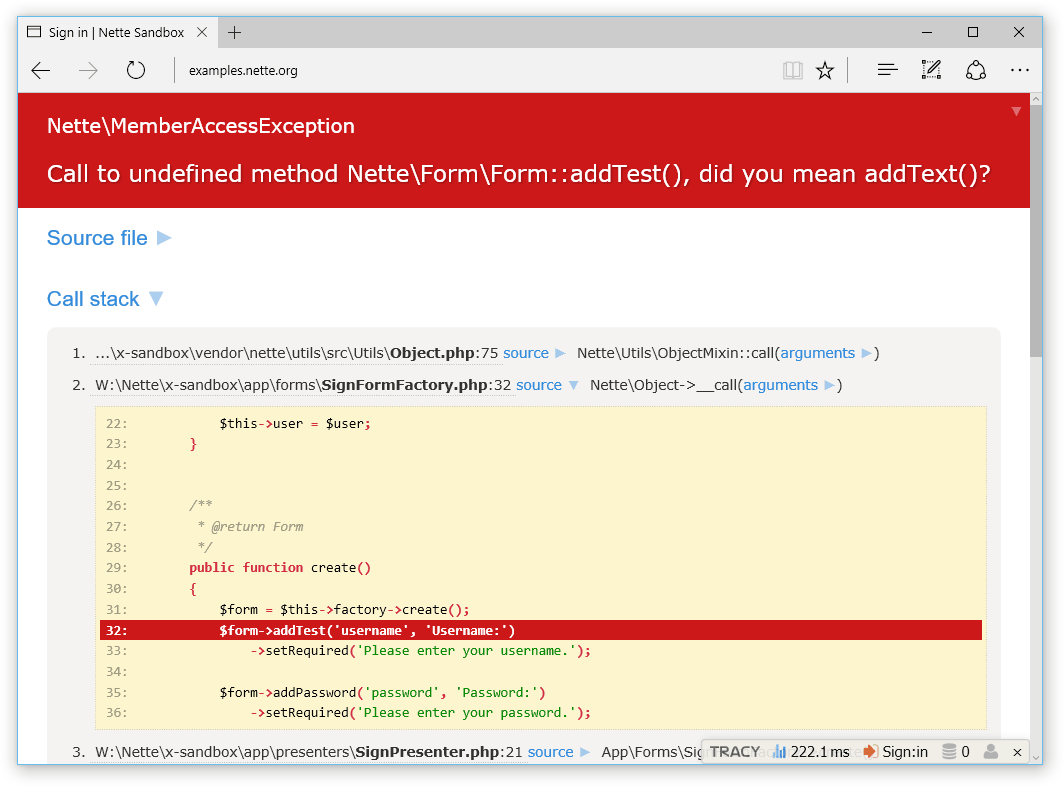
The error message literally screams. You can see a part of the source code with the highlighted line where the error occurred. A message clearly explains an error. The entire site is interactive, try it.

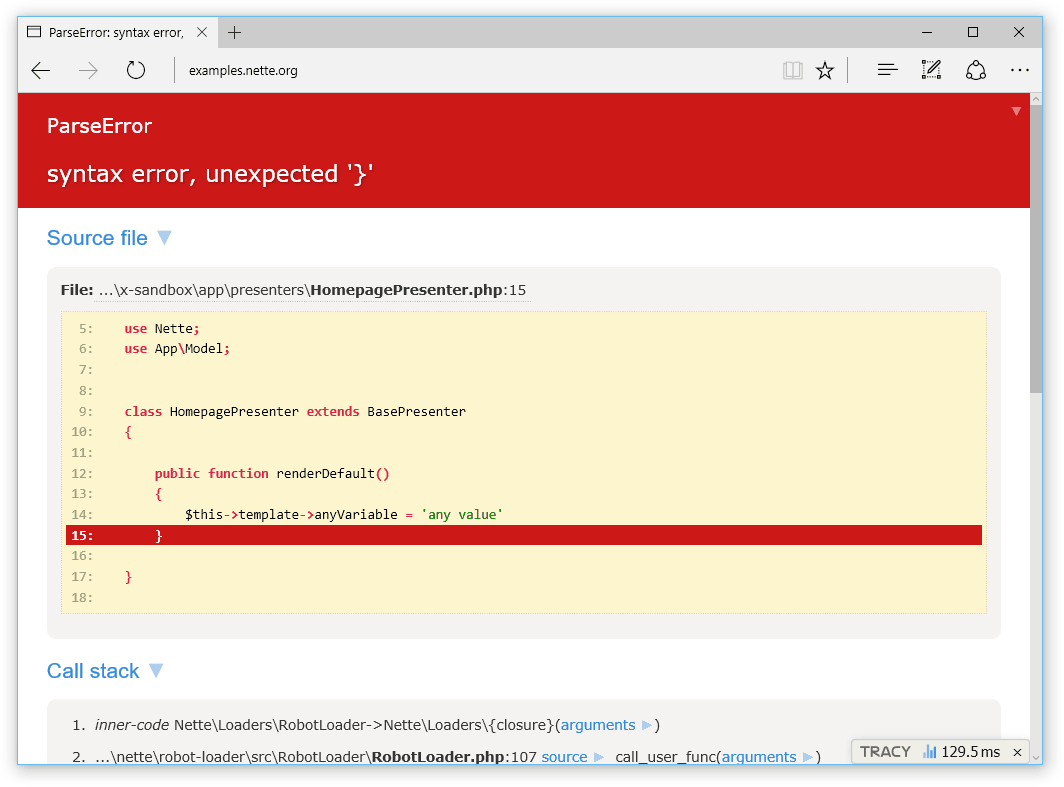
And you know what? Fatal errors are captured and displayed in the same way. No need to install any extension (click for live example):

Fatal error rendered by Tracy

Errors like a typo in a variable name or an attempt to open a nonexistent file generate reports of E_NOTICE or E_WARNING level. These can be easily overlooked and/or can be completely hidden in a web page graphic layout. Let Tracy manage them:

Notice rendered by Tracy

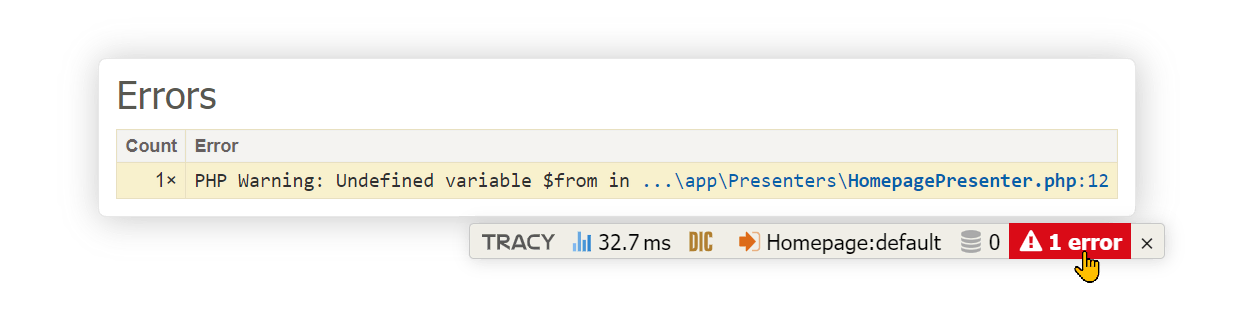
Or they may be displayed like errors:

Debugger::$strictMode = true; // display all errors
Debugger::$strictMode = E_ALL & ~E_DEPRECATED & ~E_USER_DEPRECATED; // all errors except deprecated notices

Notice rendered by Tracy

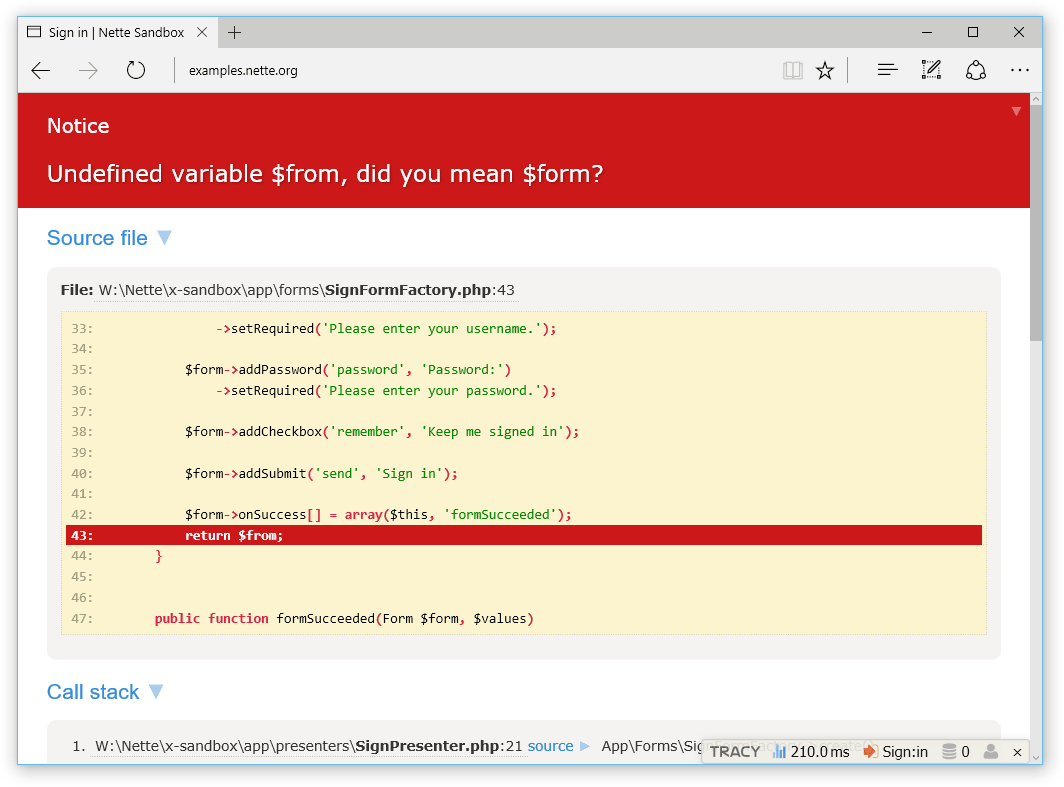
Note: Tracy when activated changes the error reporting level to E_ALL. If you want to change this, do so after calling enable().

Development vs Production Mode

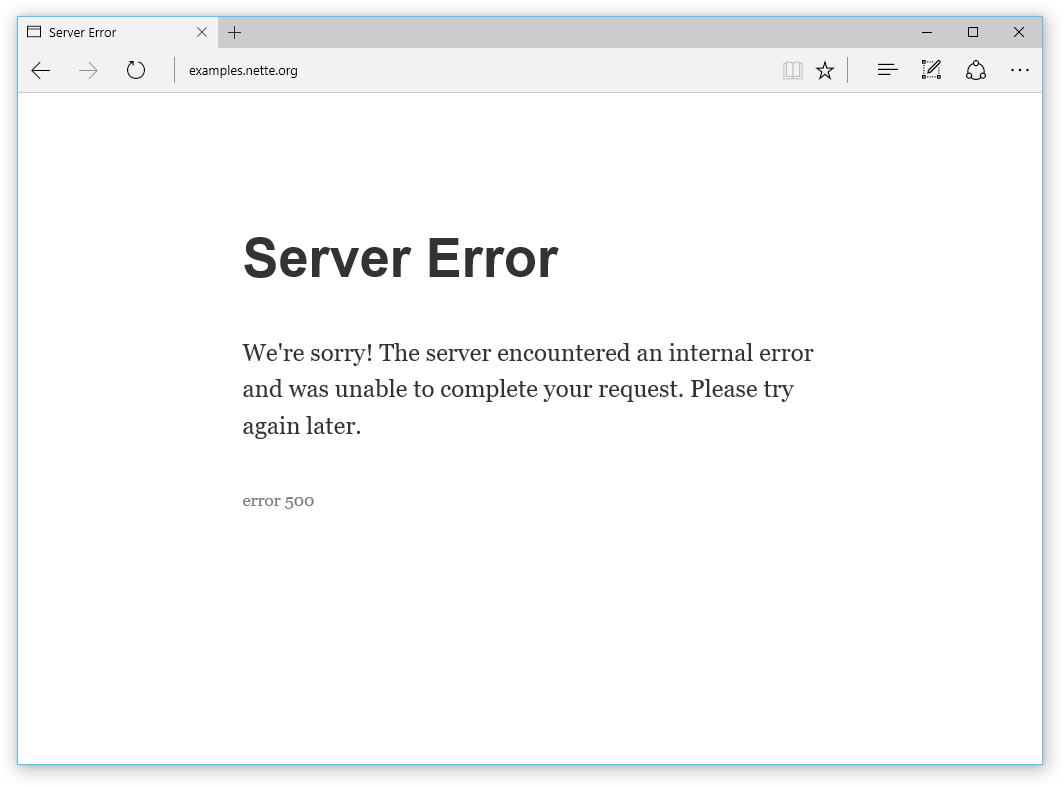
As you can see, Tracy is quite talkative, which can be appreciated in the development environment, while on the production server it would cause a disaster. That's because no debugging information should be displayed there. Tracy therefore has environment auto-detection and if the example is run on a live server, the error will be logged instead of displayed, and the visitor will only see a user-friendly message:

Server Error 500

Production mode suppresses the display of all debugging information sent out using [dump() |dumper], and of course also all error messages generated by PHP. So if you have forgotten some dump($obj) in the code, you don't have to worry, nothing will be displayed on the production server.

How does mode auto-detection work? The mode is development if the application is running on localhost (i.e., IP address 127.0.0.1 or ::1) and there is no proxy (i.e., its HTTP header). Otherwise, it runs in production mode.

If you want to enable development mode in other cases, for example for developers accessing from a specific IP address, you can specify it as a parameter of the enable() method:

Debugger::enable('23.75.345.200'); // you can also provide an array of IP addresses

We definitely recommend combining the IP address with a cookie. Store a secret token, e.g., secret1234, in the tracy-debug cookie, and in this way, activate the development mode only for developers accessing from a specific IP address who have the mentioned token in the cookie:

Debugger::enable('[email protected]');

You can also directly set the development/production mode using the Debugger::Development or Debugger::Production constants as a parameter of the enable() method.

(If you use the Nette Framework, take a look at how to set the mode for it, and it will then also be used for Tracy.)

Error Logging

In production mode, Tracy automatically logs all errors and exceptions to a text log. In order for logging to take place, you need to set the absolute path to the log directory to the $logDirectory variable or pass it as the second parameter to enable() method:

Debugger::$logDirectory = __DIR__ . '/log';

Error logging is extremely useful. Imagine that all users of your application are actually beta testers who do top-notch work in finding errors for free, and you would be foolish to throw their valuable reports away unnoticed into the trash bin.

If you need to log your own messages or caught exceptions, use the method log():

Debugger::log('Unexpected error'); // text message

try {
	criticalOperation();
} catch (Exception $e) {
	Debugger::log($e); // log exception
	// or
	Debugger::log($e, Debugger::ERROR); // also sends an email notification
}

If you want Tracy to log PHP errors like E_NOTICE or E_WARNING with detailed information (HTML report), set Debugger::$logSeverity:

Debugger::$logSeverity = E_NOTICE | E_WARNING;

For a real professional the error log is a crucial source of information and he or she wants to be notified about any new error immediately. Tracy helps him. She is capable of sending an email for every new error record. The variable $email identifies where to send these e-mails:

Debugger::$email = '[email protected]';

(If you use the Nette Framework, you can set this and others in the configuration file.)

To protect your e-mail box from flood, Tracy sends only one message and creates a file email-sent. When a developer receives the e-mail notification, he checks the log, corrects his application and deletes the email-sent monitoring file. This activates the e-mail sending again.

Opening Files in the Editor

When the error page is displayed, you can click on file names and they will open in your editor with the cursor on the corresponding line. Files can also be created (action create file) or bug fixed in them (action fix it). In order to do this, you need to configure the browser and the system.

Variable Dumping

Every debugging developer is a good friend with the function var_dump, which lists all contents of any variable in detail. Unfortunately, its output is without HTML formatting and outputs the dump into a single line of HTML code, not to mention context escaping. It is necessary to replace the var_dump with a more handy function. That is just what dump() is.

$arr = [10, 20.2, true, null, 'hello'];

dump($arr);
// or Debugger::dump($arr);

generates the output:

dump

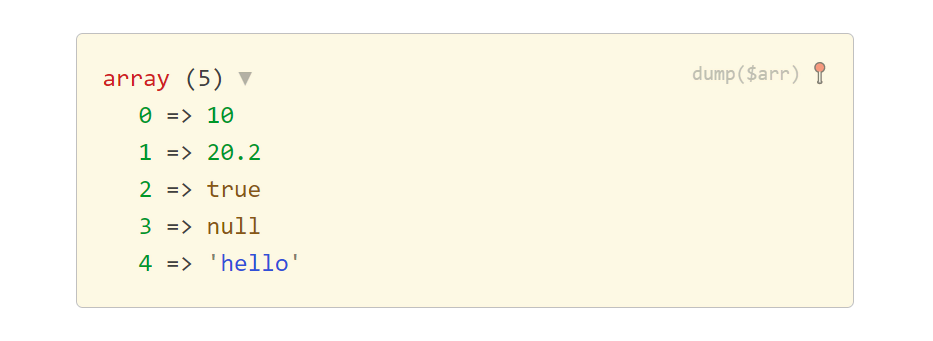
You can change the default light theme to dark:

Debugger::$dumpTheme = 'dark';

dump

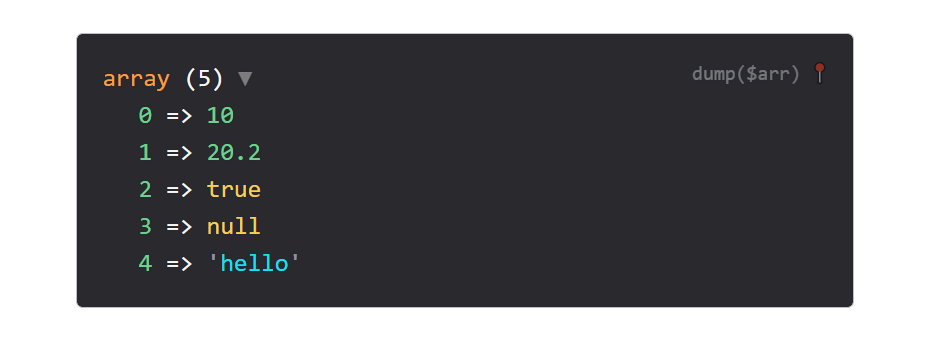
You can also change the nesting depth by Debugger::$maxDepth and displayed strings length by Debugger::$maxLength. Naturally, lower values accelerate Tracy rendering.

Debugger::$maxDepth = 2; // default: 3
Debugger::$maxLength = 50; // default: 150
Debugger::$dumpTheme = 'dark'; // default: light

The dump() function can display other useful information. Tracy\Dumper::LOCATION_SOURCE adds a tooltip with path to the file, where the function was called. Tracy\Dumper::LOCATION_LINK adds a link to the file. Tracy\Dumper::LOCATION_CLASS adds a tooltip to every dumped object containing path to the file, in which the object's class is defined. All these constants can be set in Debugger::$showLocation variable before calling the dump(). You can set multiple values at once using the | operator.

Debugger::$showLocation = Tracy\Dumper::LOCATION_SOURCE; // Shows path to where the dump() was called
Debugger::$showLocation = Tracy\Dumper::LOCATION_CLASS | Tracy\Dumper::LOCATION_LINK; // Shows both paths to the classes and link to where the dump() was called
Debugger::$showLocation = false; // Hides additional location information
Debugger::$showLocation = true; // Shows all additional location information

Very handy alternative to dump() is dumpe() (ie. dump and exit) and bdump(). This allows us to dump variables in Tracy Bar. This is useful, because dumps don't mess up the output and we can also add a title to the dump.

bdump([2, 4, 6, 8], 'even numbers up to ten');
bdump([1, 3, 5, 7, 9], 'odd numbers up to ten');

bar dump

Stopwatch

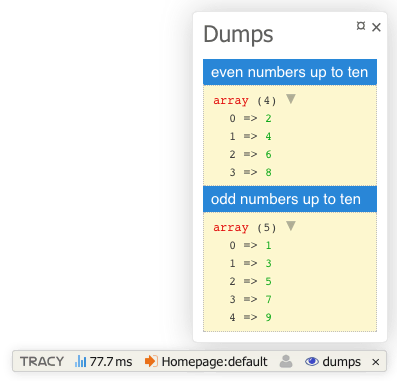
Another useful tool is the debugger stopwatch with a precision of microseconds:

Debugger::timer();

// sweet dreams my cherrie
sleep(2);

$elapsed = Debugger::timer();
// $elapsed = 2

Multiple measurements at once can be achieved by an optional parameter.

Debugger::timer('page-generating');
// some code

Debugger::timer('rss-generating');
// some code

$rssElapsed = Debugger::timer('rss-generating');
$pageElapsed = Debugger::timer('page-generating');
Debugger::timer(); // runs the timer

... // some time-consuming operation

echo Debugger::timer(); // elapsed time in seconds

Custom Logger

We can create a custom logger to log errors, uncatched exceptions, and also be called by Tracy\Debugger::log(). Logger implements the interface Tracy\ILogger.

use Tracy\ILogger;

class SlackLogger implements ILogger
{
	public function log($value, $priority = ILogger::INFO)
	{
		// sends a request to Slack
	}
}

And then we activate it:

Tracy\Debugger::setLogger(new SlackLogger);

If we use the full Nette Framework, we can set it in the NEON configuration file:

services:
	tracy.logger: SlackLogger

Monolog Integration

This package provides a PSR-3 adapter, allowing for integration of monolog/monolog.

$monolog = new Monolog\Logger('main-channel');
$monolog->pushHandler(new Monolog\Handler\StreamHandler($logFilePath, Monolog\Logger::DEBUG));

$tracyLogger = new Tracy\Bridges\Psr\PsrToTracyLoggerAdapter($monolog);
Debugger::setLogger($tracyLogger);
Debugger::enable();

Debugger::log('info'); // writes: [<TIMESTAMP>] main-channel.INFO: info [] []
Debugger::log('warning', Debugger::WARNING); // writes: [<TIMESTAMP>] main-channel.WARNING: warning [] []

Faster Loading

The basic integration is straightforward, however if you have slow blocking scripts in web page, they can slow the Tracy loading. The solution is to place <?php Tracy\Debugger::renderLoader() ?> into your template before any scripts:

<!DOCTYPE html>
<html>
<head>
	<title>...<title>
	<?php Tracy\Debugger::renderLoader() ?>
	<link rel="stylesheet" href="assets/style.css">
	<script src="https://code.jquery.com/jquery-3.1.1.min.js"></script>
</head>

AJAX and Redirected Requests

Tracy can display Debug bar and Bluescreens for AJAX requests and redirects. Tracy creates its own sessions, stores data in its own temporary files, and uses a tracy-session cookie.

Tracy can also be configured to use a native PHP session, which is started before Tracy is turned on:

session_start();
Debugger::setSessionStorage(new Tracy\NativeSession);
Debugger::enable();

In case starting a session requires more complex initialization, you can start Tracy immediately (so that it can handle any errors that occur) and then initialize the session handler and finally inform Tracy that the session is ready to be used using the dispatch() function:

Debugger::setSessionStorage(new Tracy\NativeSession);
Debugger::enable();

// followed by session initialization
// and start the session
session_start();

Debugger::dispatch();

The setSessionStorage() function has existed since version 2.9, before that Tracy always used the native PHP session.

Content Security Policy

If your site uses Content Security Policy, you'll need to add 'nonce-<value>' and 'strict-dynamic' to script-src for Tracy to work properly. Some 3rd plugins may require additional directives. Nonce is not supported in the style-src directive, if you use this directive you need to add 'unsafe-inline', but this should be avoided in production mode.

Configuration example for Nette Framework:

http:
	csp:
		script-src: [nonce, strict-dynamic]

Example in pure PHP:

$nonce = base64_encode(random_bytes(20));
header("Content-Security-Policy: script-src 'nonce-$nonce' 'strict-dynamic';");

nginx

If Tracy does not work on nginx, it is probably misconfigured. If there is something like

try_files $uri $uri/ /index.php;

change it to

try_files $uri $uri/ /index.php$is_args$args;

Integrations

This is a list of unofficial integrations to other frameworks and CMS:

... feel free to be famous, create an integration for your favourite platform!

tracy's People

Contributors

adrianbj avatar dakujem avatar dakur avatar dg avatar enumag avatar fprochazka avatar holtkamp avatar hrach avatar jakubboucek avatar janbarasek avatar janfejtek avatar jantvrdik avatar juzna avatar kukulich avatar mabar avatar majkl578 avatar milo avatar mishak87 avatar muglug avatar paxperscientiam avatar romansklenar avatar sallyx avatar simpod avatar smuuf avatar spaze avatar vlastavesely avatar vojtech-dobes avatar vrana avatar vrtak-cz avatar xificurk avatar

Stargazers

 avatar  avatar  avatar  avatar  avatar  avatar  avatar  avatar  avatar  avatar  avatar  avatar  avatar  avatar  avatar  avatar  avatar  avatar  avatar  avatar  avatar  avatar  avatar  avatar  avatar  avatar  avatar  avatar  avatar  avatar  avatar  avatar  avatar  avatar  avatar  avatar  avatar  avatar  avatar  avatar  avatar  avatar  avatar  avatar  avatar  avatar  avatar  avatar  avatar  avatar  avatar  avatar  avatar  avatar  avatar  avatar  avatar  avatar  avatar  avatar  avatar  avatar  avatar  avatar  avatar  avatar  avatar  avatar  avatar  avatar  avatar  avatar  avatar  avatar  avatar  avatar  avatar  avatar  avatar  avatar  avatar  avatar  avatar  avatar  avatar  avatar  avatar  avatar  avatar  avatar  avatar  avatar  avatar  avatar  avatar  avatar  avatar  avatar  avatar  avatar

Watchers

 avatar  avatar  avatar  avatar  avatar  avatar  avatar  avatar  avatar  avatar  avatar  avatar  avatar  avatar  avatar  avatar  avatar  avatar  avatar  avatar  avatar  avatar  avatar  avatar  avatar  avatar  avatar  avatar  avatar  avatar  avatar  avatar  avatar  avatar  avatar  avatar  avatar  avatar  avatar  avatar  avatar  avatar  avatar  avatar  avatar  avatar  avatar  avatar  avatar  avatar  avatar  avatar  avatar  avatar  avatar  avatar  avatar  avatar  avatar  avatar  avatar  avatar  avatar  avatar  avatar  avatar  avatar  avatar  avatar  avatar  avatar  avatar  avatar

tracy's Issues

JavaScript error on toggling

This is not serious problem, everything works, only console is filled by errors.

For reproduction, enable debugger and dump array.

Tracy\Debugger::enable();
dump(array(1));

open a browser console and toggle the dumped array.

In FF: TypeError: newPosition is undefined
In Chrome: Uncaught TypeError: Cannot read property 'right' of undefined

It is due to panel.position() in dumper.js returns undefined. I'm not sure how to fix it, it seems to me, that there is mixed-up toggling of Bar panels and dumped variables.

Feature: Custom loggers

It would be nice to be able to attach any custom logger to the Tracy's logging mechanism. Tracy would log everything as it is now, but additionally it would "dispatch" an "error event" and pass the error to the attached loggers. IMHO the accepted Logger Interface could be used.

New Bar icons

Are you open to change the bar icons? I would suggest to use Fontawesome font to generate bigger icons to look good on retina.

My suggestions:

Execution time: http://fontawesome.io/icon/clock-o/
Memory: http://fontawesome.io/icon/bar-chart/
Routes: http://fontawesome.io/icon/road/
Database: http://fontawesome.io/icon/database/
Identity: http://fontawesome.io/icon/user/

I suppose, 32x32px should be enough for retina displays.

License allows use icons without attribution, but i would suggest to mention it somewhere.

Debug mode detection - accept CIDR notation

It would be nice to accept CIDR notation for allowed (aka developer) addresses.
E.g. for a team working on a project in same office, it would be good to set allowed addresses to 10.0.0.0/8 or fc00::/7, so they can see each others' instances in debug mode. Or for a shared in-office testing machine.
Also relates to nette/bootstrap#9.

Duplicated tracy bar

I'm having the bar Debug duplicate tracy as printscreen'm with version 2.2.3 of nette

image

Contenct-Security-Policy

I'm currently experimenting with Content-Security-Policy and sure enough Tracy doesn't work unless both 'unsafe-inline' and 'unsafe-eval' are allowed. I can enable them for development only of course but I'd like to avoid it. Enabling It could easily lead me to a situation where I miss some real CSP violation because of it and push it to production.

Parse errors not shown?

I can't seem to get Tracy to handle Syntax/Parse errors on my server, is there something I am missing?

I am using the code below, it catches Exceptions, but not Syntax errors for some reason.

use Tracy\Debugger;
Debugger::enable(Debugger::DEVELOPMENT, dirname(__DIR__).'/logs');
Debugger::$strictMode = TRUE;

Usage of ext-iconv

An unnecessary throws an error when ext-iconv not available.

Fatal error: Uncaught Error: Call to undefined function Tracy\iconv_strlen() in //vendor/tracy/tracy/src/Tracy/assets/Bar/info.panel.phtml:48
Stack trace:
#0 //vendor/tracy/tracy/src/Tracy/DefaultBarPanel.php(50): require()
#1 //vendor/tracy/tracy/src/Tracy/Bar.php(73): Tracy\DefaultBarPanel->getPanel()
#2 //vendor/tracy/tracy/src/Tracy/Debugger.php(207): Tracy\Bar->render()
#3 [internal function]: Tracy\Debugger::shutdownHandler()
#4 {main}
  thrown in //tracy/tracy/src/Tracy/assets/Bar/info.panel.phtml on line 48

Broken Tracy bar when used with BrowserSync

When using Tracy together with BrowserSync, Tracy bar produces invalid HTML code at the end of file like this:

<!-- Tracy Debug Bar -->
<script>
(function(onloadOrig) {
    window.onload = function() {
        if (typeof onloadOrig === 'function') onloadOrig();
        var debug = document.body.appendChild(document.createElement('div'));
        debug.id = 'tracy-debug';
        debug.innerHTML = "&nbsp;\n\n<style id=\"tracy-debug-style\"

// โ€ฆ
// Tracy's code continues.
// โ€ฆ

doc = win.document;\n\t\tdoc.write('<!DOCTYPE html><meta charset=\"utf-8\"><style>' + $('#tracy-debug-style').dom().innerHTML + '<\\\/style><script>' + $('#tracy-debug-script').dom().innerHTML + '<\\\/script><body id=\"tracy-debug\">
<script type='text/javascript'>//<![CDATA[
;document.write("<script defer src='//HOST:3000/socket.io/socket.io.js'><\/script><script defer src='//HOST:3001/client/browser-sync-client.0.9.1.js'><\/script>".replace(/HOST/g, location.hostname));
//]]></script>
');\n\t\tdoc.body.innerHTML = '<div class="\&quot;tracy-panel" tracy-mode-window\"=""

// Unescaped HTML continues.
// โ€ฆ

BrowserSync also injects JS a HTML into DOM which seems to be the cause of conflict. You may notice socket.io script injected by BrowserSync close to the end. However, since BrowserSync itself works fine with Tracy and does not seem to be affected by this error, it looks like it is Tracy's issue. If not, please let me know to report the issue at BrowserSync.

Doubled backslash when dumping \x

dump('\\x'); // produce \\x instead of \x

More obvious with

dump('D:\\data\\path\\xml\\file.xml'); // D:\data\path\\xml\file.xml

It is happening in Dumper::encodeString(). I'm not sure how to fix it (remove $utf['\\x'] = part?)

Debugger::enable() can be called only once (latest Nette 2.2.2)

Hi.

When Debugger::enable() is called more than once in code, Tracy bar doesn't respond to mouseover for details.

It's easy to demonstrate this issue also in sandbox.
For example, in sandbox's bootstrap.php,

after $configurator->enableDebugger(__DIR__ . '/../log');
put Debugger::enable();,

and now, try mouseover in Tracy bar - it doesn't work.

So, you cannot call Debugger::enable() wherever and whenever :)

Debugger::enable() has been re-implemented in Nette 2.2.2 with this issue.

Dump full exceptions with FireLogger

With FireBug active, we can see nice bugs in firefox console (or even in chrome with appropriate extensions), however we've lost the nice tracy's red screen of death. As I looked into tracy code, the exception file is not created if FireBug is available and there is no option to tell tracy we want it (I think it isn't necessary to explain high value of information about error in compare with simple firebug line).
I think there should be possibility to tell Tracy to create exception file even if there is FireBug enabled, isn't it?
I can implement and pullrequest it with no problem, just please comment if you think it is good/bad idea or how to solve it better.

Possibility to split exceptions and logs (and split log files by days) into separated directories

Hello,

we are using Tracy in a big project with a high traffic. It can generate many exceptions and warnings. For clarity, we are saving exceptions and logs into separated directories. And logs we are spliting by days (for example: error-2014-01-01.log, info-2014-01-01.log). It would be great, if this functionality can be in Tracy (optional). If there will be interest in this functionality, I will write the pull-request.

Feature: Dump to file

In both the development and the production there is a lot of situations where "super-smart" solutions like Firelog cannot be used. Sometimes it is impossible even to get the script output to the browser, eg. non-HTTP applications like cron jobs etc.

It would be nice to have the ability to dump variables to a file in the %tempDir%.

API would be as follows:

class Debugger { function fileDump($variable, $name = NULL); }

This will produce Tracy's nice clickable dump saved in the %tempDir% in a HTML file optionaly with a custom name. I assume that some smart variable hash, PID and/or time prefixes could come into play.

@dg does this a chance to be merged? Should I prepare a pull?

Display line when dumping variables

When using Debugger::dump($var), the variable name should be displayed with the variable content.

Mockup :
image

Being able to enable/disable :

Debugger::$showVarName = true; // default: false

EDIT :
Just discovered the $showLocation setting, you should add it in the doc on github with the depth example.

For those who don't know :
to display the file and line where the dump is, use

Debugger::$showLocation = true;

DebugBar insertion brakes when using BrowserSync as proxy

Steps to reproduce:

  1. Install browser-sync npm install -g browser-sync
  2. Run browser-sync as proxy browser-sync start --proxy "localhost"
  3. Navigate to nette app with enabled debug bar

Result:

JS error in console: Uncaught SyntaxError: Unexpected token ILLEGAL

image

Add support for Bar and BlueScreen Debugger dependency injection

I wonder why there is no way to set Tracy\Bar and Tracy\BlueScreen into Tracy\Debugger via setter dependency injection. It will be nice to have such a possibility. Now it is barely possible with class_alias() or maybe different workaround.

Just want to know your opinion, for now.

Move Tracy under namespace Nette\Tracy

I don't think Tracy should be ashamed of to be part of Nette Framework (or being developed by Nette Foundation). If you will create more repositories with parts of Nette (e.q. Nette\Image) in future, it will be impossible to find cool names for all of them.

In fact, I don't think it is necessary to rename Nette\Diagnostics at all :)

PHP7 on Win32: Fatal error: Cannot use "self" when no class scope is active

Hi! Just trying the nigtbuild of php-master (php7) with clean nette/web-project, running on internal php webserver: "php -S 0.0.0.0:88" ends up with Fatal error in Tracy.

Fatal error: Cannot use "self" when no class scope is active in C:\Users\George\Documents\Web\web-project\vendor\tracy\tracy\src\Tracy\assets\BlueScreen\bluescreen.phtml on line 101.

dump() shortcut to return dump instead of print

I think it would be nice if dump() shortcut would behave just like \Tracy\Debugger::dump, I mean that the second argument set to TRUE will make dump to return the dumped value as string instead of printing out.
However, as it would be a BC break because dump() now returns its first argument, I'm not sure if it wouldn't be a better idea to solve it another way, for example make another shortcut sdump()...
I need this quite often (dumping something to logs, in console where echo does not work etc...) and I would find such shortcut extremely useful.
And, I would willingly create a pull request if you agree here about the form of the shortcut :)

Update to 2.3.7 whitescreens instead of showing exception page (PHP 7 RC6)

After the update to 2.3.7 it doesn't show the exception page anymore, it just whitescreens with a 500 http status code.
It works when I roll back to 2.3.6.
And I'm running on PHP 7 RC6.

Not using the debug bar, but using the Debugger::exceptionHandler($e); to handle the exceptions globally.

I'm not really sure what is causing it, but if you have any questions just ask and I'll do my best to help :)

isHtmlMode() not very Robust

I'm more than happy to make the changes to this and submit a pull request, but I wanted to open an issue for discussion.

Currently isHtmlMode() does a preg match against the headers list for a content type not equal to text/html. This probably works well when the content type header is established, however, failed for CLI based applications and non-HTTP based SAPIs. By relying on an HTTP header, it assumes HTTP is how the client is interfacing with the application.

This in particular causes the bar to get output in my CLI applications.

A few ideas which might make sense.

  • Add a check to see if $_SERVER['SERVER_PROTOCOL'] is HTTP/XX where XX version doesn't matter. If that is HTTP, then check as it does now.
  • Add explicit checks for php_sapi_name() -- this might not be completely ideal as the SAPI does not necessarily indicate the output format.
  • Add explicit method to set "output" format, "html" vs. "plain" vs. potential others down the line (JSON?)

The last is the most flexible, although it should probably be combined with at least a sane default based on the first or second.

unexpected ...

Tracy\Helpers.php, line 54

public static function formatHtml($mask, ...$args)

fix to:

public static function formatHtml($mask, $args)

Overriding file path

Would be great to have file path configurable. E.G. substitution by regex or something more user friendly. Currently my team works using sshfs on a shared remote development server, this causes tracy to detect environment as production (which is not a problem as you may override with \Tracy\Debugger::enable(\Tracy\Debugger::DEVELOPMENT);.

The links to the files is a problem though, the editor://open/?file=/some/path/to/webroot/project/file is not configurable and leads to the server based file path.

What would be nice is to either have a base project directory configuration variable and to have all paths be relative to that, either have a path overriding callback.

This is not only useful for those of us who work with sshfs but every other remote development like mapped ftp etc.

Production Mode Error Page Customization

Is there a simple way to customize the error page output? Preferably in a modular fashion so that I don't have to replace the template or something like that?

svg element in document and click event

// tests whether element has given class
Query.prototype.hasClass = function(className) {
    return this[0] && this[0].className && this[0].className.replace(/^|\s+|$/g, ' ').indexOf(' '+className+' ') > -1;
};

if i click on svg element on page where is trace debugger enabled, so this bug appear

TypeError: this[0].className.replace is not a function

...eturn this[0] && this[0].className && this[0].className.replace(/^|\s+|$/g, ' ')...

Debugger::$showLocation flag has no effect

Yesterday, after I downloaded the new Nette 2.3.0, I have discovered this:

Enabling the $showLocation flag in the Debugger class has no effect when displaying the dump (printed on the page, not in the debug bar). That is: The expected tooltip pointing out the location (file & line number) of the dump() function doesn't show up.

I have managed to pinpoint the candidate causing the problem and it seems to be the break; statement used in the Dumper::findLocation() method: https://github.com/nette/tracy/blob/master/src/Tracy/Dumper.php#L516

If I remove the break; statement, it seems to work - the tooltip is displayed.

The general lack of documentation of/in the code and the fact that the break; statement looks like a part of something bigger keeps me from doing this myself and creating the PR. Therefore I humbly ask anyone, who knows what exactly it does, to fix this.

Is there a way to change the red background of the firelogger messages

When I run tracy-2.2.6/examples/firebug-dump.php or tracy-2.3.0/examples/firebug-dump.php, the three messages in the firebug logger tab have a bright red background that isn't easy to read - for me.
Also tracy doesn't seem to take advantage of firelogger's info, warning, error, ... levels.

I just can't see where this red color is coming from.

sc-20150303-165615

Tracy 2.2.3 say it is 2.2.2

In Tracy 2.2.3 is still version 2.2.2, so on bluescreen is wrong information about version of Tracy

In Tracy\Debugger.php should be in public static $version = '2.2.3'

Maximum call stack size exceeded

Commit 97fdab4 broke dumping recursive structures. The following code will result in infinite recursion.

$obj = new stdClass();
$obj->a = $obj;
echo Dumper::toHtml($obj, [Dumper::LIVE => TRUE]);

Enable custom error template

Hello,

we are using tracy but we need set custom error template instead of default error.phtml. I prepared 2 pull requests to enable this feature. One in Tracy and one in bootstrap to add possibility to change error template via NetteExtension.

Dumped object hash duplicate

Tracy uses spl_object_hash() for dumped object hashes (e.g. stdClass #de00). But this function ensure unique hash for existing objects only. It "reuses" hashes of no longer exist objects. See example.

I hit this issue during dumping in loop in console. All dumped objects had the same hash even different content.

Bad performance

I have low memory on my virtual machine and it takes forever to load error page. Some times I even get out of memory error. I am guessing is problem in stack trace. Can I limit stack trace?

Optinally log bluescreens for warnings and notices

There should be a switch Debugger::$logErrorBlueScreens = FALSE; that when set to TRUE would force Tracy to log entire stack of ErrorException (render the bluescreen) and not only it's message in production mode.

I would have sent a pullrequest already but I don't know how to name that property :) Any ideas @dg?

(@Vrtak-CZ needed it too. So Patrik, if you're going to implement this, write it in this issue so we're not doing it both at the same time, I will also write it here when I find the time for it)

How to customise Error Page ?

Hi,
I seems tracy has all cool features as I am looking for, but i would like to know how can I customise error template page, I am trying to integrate with my latest project Cygnite Framework , I would like to display few information about Cygnite Framework in the Error page.

Is it possible i can overwrite the error page, change design, color schema, project name and version etc.

Any response would be highly appreciated.

Thanks,
Sanjoy

Recommend Projects

  • React photo React

    A declarative, efficient, and flexible JavaScript library for building user interfaces.

  • Vue.js photo Vue.js

    ๐Ÿ–– Vue.js is a progressive, incrementally-adoptable JavaScript framework for building UI on the web.

  • Typescript photo Typescript

    TypeScript is a superset of JavaScript that compiles to clean JavaScript output.

  • TensorFlow photo TensorFlow

    An Open Source Machine Learning Framework for Everyone

  • Django photo Django

    The Web framework for perfectionists with deadlines.

  • D3 photo D3

    Bring data to life with SVG, Canvas and HTML. ๐Ÿ“Š๐Ÿ“ˆ๐ŸŽ‰

Recommend Topics

  • javascript

    JavaScript (JS) is a lightweight interpreted programming language with first-class functions.

  • web

    Some thing interesting about web. New door for the world.

  • server

    A server is a program made to process requests and deliver data to clients.

  • Machine learning

    Machine learning is a way of modeling and interpreting data that allows a piece of software to respond intelligently.

  • Game

    Some thing interesting about game, make everyone happy.

Recommend Org

  • Facebook photo Facebook

    We are working to build community through open source technology. NB: members must have two-factor auth.

  • Microsoft photo Microsoft

    Open source projects and samples from Microsoft.

  • Google photo Google

    Google โค๏ธ Open Source for everyone.

  • D3 photo D3

    Data-Driven Documents codes.