Library for calculating technical indicators and overlays. You can choose format of price data
from provider and library will return result. It distributed with Typescript and Javascript (ES6, ES5).
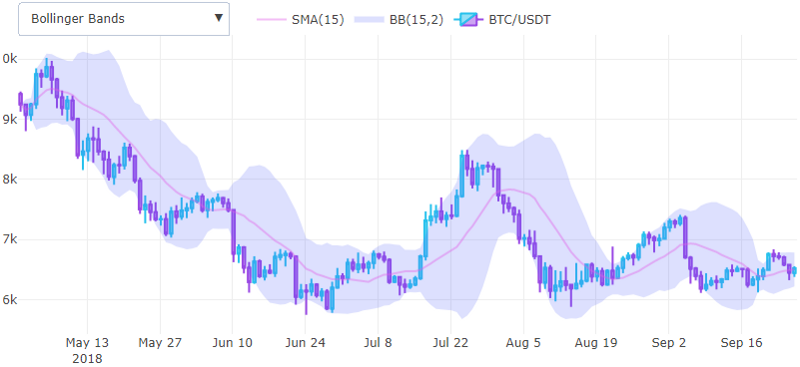
Check example with plotly library, ccxt data provider and BTC prices from Binance exchange.
| Function |
Technical Overlay |
Tested |
Developed by |
Year |
| bb |
Bollinger Band |
✔️️ |
John Bollinger |
1980s |
| dema |
Double Exponential Moving Average |
️ ✔️️ |
Patrick Mulloy |
1994 |
| ema |
Exponential Moving Average |
✔️️ |
|
|
| ebb |
Exponential Bollinger Band |
✔️️ |
Based on Welford's |
|
| hma |
Hull Moving Average |
ok |
Alan Hull |
2005 |
| keltner |
Keltner Channels |
✔️️ |
Chester Keltner |
1960 |
| psar |
Parabolic SAR |
❌ |
Welles Wilder |
1978 |
| sma |
Simple Moving Average |
✔️️ |
|
|
| tema |
Triple Exponential Moving Average |
️ ✔️️ |
Patrick Mulloy |
1994 |
| vbp |
Volume by Price |
✔️️ |
|
|
| vwap |
Volume Weighted Average Price |
✔️️ |
James Elkins |
1984 |
| wma |
Weighted Moving Average |
️ok |
John J. Murphy |
1999 |
| zigzag |
ZigZag Indicator |
✔️️ |
Arthur Merrill |
1977 |
| Function |
Technical Indicator |
Tested |
Developed by |
Year |
| adl |
Accumulation / Distribution line |
✔️ |
Marc Chaikin |
1970s |
| atr |
Average True Range |
✔️ |
Welles Wilder |
1978 |
| adx |
Average Directional Index |
✔️ |
Welles Wilder |
1978 |
| ao |
Awesome Oscillator |
- |
Bill Williams |
|
| ac |
Accelerator Oscillator |
- |
Bill Williams |
|
| bbp |
Bollinger Bands Percent Bandwidth %B |
ok |
|
|
| cci |
Commodity Channel Index |
✔️ |
Donald Lambert |
1980 |
| cho |
Chaikin Oscillator |
ok |
Marc Chaikin |
|
| expdev |
Exponential Weighted Deviation |
✔️ |
|
|
| fi |
Force Index |
✔️ |
|
|
| kst |
Know Sure Thing |
✔️ |
|
|
| macd |
Moving Average Convergence/Divergence |
✔️ |
Gerald Appel |
1979 |
| madev |
Mean Absolute Deviation |
✔️ |
|
|
| mfi |
Money Flow Index (volume-weighted RSI) |
✔️ |
Gene Quong and Avrum Soudack |
1989 |
| obv |
On Balance Volume |
✔️ |
Joseph Granville |
1963 |
| roc |
Rate-of-Change |
✔️ |
|
|
| rsi |
Relative Strength Index |
✔️ |
Welles Wilder |
1978 |
| stdev |
Standard Deviation |
✔️️ |
|
|
| stoch |
Stochastic Oscillator (Slow/Fast/Full) |
✔️ |
George Lane |
1950s |
| stochRsi |
Combines Stochastics with the RSI |
✔️ |
Welles Wilder |
1994 |
| vi |
Vortex Indicator |
✔️ |
Etienne Botes and Douglas Siepman |
2010 |
| williams |
Williams %R |
✔️ |
|
|
| Function |
Error methods |
Tested |
| mae |
Mean Absolute Error |
✔️ |
| mape |
Mean Absulute Percentage Error |
✔️ |
| nrmse |
Normalized Root-Mean-Square Error |
✔️ |
| rmse |
Root-Mean-Square Error |
✔️ |
| Function |
Price transformation |
Tested |
| medianPrice |
Median Price |
- |
| typicalPrice |
Typical Price |
✔️ |
| trueRange |
True Range |
✔️ |
| Function |
Statistical methods |
Tested |
| cov |
Covariation |
✔️ |
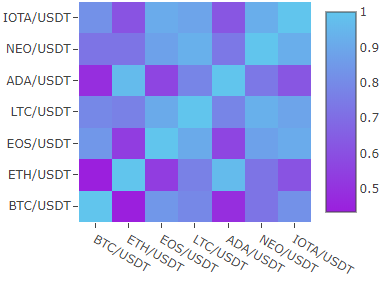
| cor |
Correlation |
✔️ |
| mean |
Mean (Average) |
✔️ |
| sd |
Standard deviation |
✔️ |
  const ohlcv = [[t,o,h,l,c,v], [t2,o2,h2,l2,c2,v2],  ...  ,[tN,oN,hN,lN,cN,vN]];
  const ta = new TA(ohlcv, TA.exchangeFormat);
  const emaShort = ta.ema(10);
  const emaLong = ta.ema(21);
  const bband = ta.bb(15, 2);
  const bbUpper = bband.upper;
  const bbLower = bband.lower;
  const smaOpenPrice = TA.sma(ta.$open);
Install npm package npm i ta-math or add ta-math.js script file on web page.
Feel free to contribute. Here reference
how to implement new indicators. There are test samples in the .xls files, also you can generate testing data
with 'generator.py' file. To convert columns into rows in .xls you can use this
tool.


![dependabot[bot] avatar](https://avatars.githubusercontent.com/in/29110?v=4 "dependabot[bot]")


![renovate[bot] avatar](https://avatars.githubusercontent.com/in/2740?v=4 "renovate[bot]")