mskec / react-native-mp-android-chart Goto Github PK
View Code? Open in Web Editor NEWReact Native wrapper of popular android charting library MPAndroidChart
License: MIT License
React Native wrapper of popular android charting library MPAndroidChart
License: MIT License


Able to pass in the limit line value but not able to create a limit line, also the multiple colors for the line chart.
https://github.com/PhilJay/MPAndroidChart/wiki/The-Axis#limit-lines in the android can implement like this:
LimitLine xLimitLine = new LimitLine(4f,"xLTest")
xLimitLine.setLineColor(Color.GREEN);
xLimitLine.setTextColor(Color.GREEN);
xAxis.addLimitLine(xLimitLine);
While running the application after adding mp library getting the following Error
Application app has not been registered.
Hint: This error often happens when you're running the packager (local dev server) from a wrong folder. For example you have multiple apps and the packager is still running for the app you were working on before.
If this is the case, simply kill the old packager instance (e.g. close the packager terminal window) and start the packager in the correct app folder (e.g. cd into app folder and run 'npm start').
This error can also happen due to a require() error during initialization or failure to call AppRegistry.registerComponent

Will it work both on android and ios ?
Hi there @mskec !
Great job integrating the MPAndroidChart lib in React-Native.
I was wondering if there is a way to prevent user interactions such as taps and zooms on the graphs ?
Thx for your answer,
Have a nice day
I am interested to add to my charts custom markers.
I am using LinearChart and I want to know if is it possible and how can I add extra info to markers, not just yValue?
Thank you.
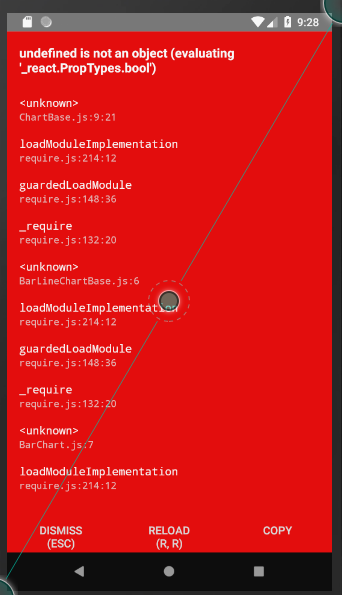
import PropTypes from 'prop-types'; for react
I get this Error when running the example. RN 0.34
Is it possible to use the IMarker interface in react native, how do you implement it?
the latest MPAndroidChart version is v3.0.1
I've problem, when i'm trying to run my app im getting this error :
Here is my code :
import React from 'react';
import {Modal,View,Text,Button, StyleSheet, Dimensions} from 'react-native';
import {BarChart} from 'react-native-mp-android-chart';
const deviceWidth = Dimensions.get('window').width;
const deviceHeight = Dimensions.get('window').height;
const MarkerDetail = (props) => {
let modalContent = null;

let variable = {
    data: {
        datasets: [{
            yValues: [100, 105, 102, 110],
            label: 'Data set 1',
            config: {
                color: 'teal'
            }
        }, {
            yValues: [110, 100, 105, 108],
            label: 'Data set 2',
            config: {
                color: 'orange'
            }
        }],
        xValues: ['Q1', 'Q2', 'Q3', 'Q4']
    }
};

if(props.selectedStation){
    modalContent = (
        <View >
            <View style = {styles.headerBar}>
        <Text style ={styles.header}>{props.selectedStation.stationName}
        </Text>
            <Button title="X" style = {styles.closeButton}
                    onPress = {props.onModalClosed}
                    color= "#2dc997"
            />
            </View>
            <View>
                <BarChart
                    style={styles.chart}
                    data={variable.data}
                    animation={{durationX: 2000}}
                />
            </View>
        </View>
    );
}

return(
  <Modal visible ={props.selectedStation !== null}  animationType={"slide"}>
      <View style = {styles.modalContainer}>
          {modalContent}
      </View>
  </Modal>
);
};
const styles = StyleSheet.create({
modalContainer: {
width: deviceWidth,
height: deviceHeight
},
headerBar: {
backgroundColor: '#2dc997',
height: deviceHeight / 20,
marginTop: 5,
flexDirection:'row',
flexWrap:'wrap'
},
header: {
color: 'white',
fontWeight: 'bold',
fontSize: 20,
textAlign: 'center',
padding: 3,
width: deviceWidth * 9 /10
},
closeButton: {
    width: deviceWidth * 1/ 10,
    color : '#2dc997',
},
chart: {
    height: deviceHeight / 8,
    width: 300
}
});
export default MarkerDetail;
Anny suggestion ? I was trying to do it by google suggestions but im stuck
I'm getting this error when updating data of a pie chart that is being obtained from a database.
"Error while updating property 'data' of a view managed by: MPAndroidPieChart"
My problem is something likes PhilJay/MPAndroidChart#789
When scaleX in LineChart, I want to load more detailed data , can I listen to the scaleX event and use https://github.com/PhilJay/MPAndroidChart/wiki/Dynamic-&-Realtime-Data to load more data?
And my data is something like
| x | y |
|---|---|
| 2016-01-01 15:00:00 GMT | 25 |
| 2016-01-01 22:00:00 GMT | 58 |
| 2016-01-02 08:00:00 GMT | 36 |
| 2016-01-02 14:00:00 GMT | 12 |
| 2016-01-02 19:00:00 GMT | 29 |
It seems that it don't intervals with the date correctly, intervals are all the same. Can I use https://github.com/PhilJay/MPAndroidChart/wiki/Setting-Data to adjust data to have interval the same as numbers ?
I am triying to imitate this issue: PhilJay/MPAndroidChart#104
That is shown in this example image in MPAndroidChart home page
https://camo.githubusercontent.com/e9f3408cc22c2896a897e9ed92a2fd2cbcf40493/68747470733a2f2f7261772e6769746875622e636f6d2f5068696c4a61792f4d50416e64726f696443686172742f6d61737465722f73637265656e73686f74732f6c696e655f63686172745f6772616469656e742e706e67
Is it possible to do it in react native?
Another question, it is possible to hide the label color icon?, i use an empty label but it stills shows it.
Thanks
Claudio
Is there a way to use combined charts?
A declarative, efficient, and flexible JavaScript library for building user interfaces.
🖖 Vue.js is a progressive, incrementally-adoptable JavaScript framework for building UI on the web.
TypeScript is a superset of JavaScript that compiles to clean JavaScript output.
An Open Source Machine Learning Framework for Everyone
The Web framework for perfectionists with deadlines.
A PHP framework for web artisans
Bring data to life with SVG, Canvas and HTML. 📊📈🎉
JavaScript (JS) is a lightweight interpreted programming language with first-class functions.
Some thing interesting about web. New door for the world.
A server is a program made to process requests and deliver data to clients.
Machine learning is a way of modeling and interpreting data that allows a piece of software to respond intelligently.
Some thing interesting about visualization, use data art
Some thing interesting about game, make everyone happy.
We are working to build community through open source technology. NB: members must have two-factor auth.
Open source projects and samples from Microsoft.
Google ❤️ Open Source for everyone.
Alibaba Open Source for everyone
Data-Driven Documents codes.
China tencent open source team.