Git Product home page Git Product logo

forester's Introduction

forester: Quick and Simple Tools for Training and Testing of Tree-based Models

A significant amount of time is spent on building models with high performance. Selecting the appropriate model structures, optimizing hyperparameters and explainability are only part of the process of creating a machine learning-based solution. Despite the wide range of structures considered, tree-based models are champions in competitions or hackathons. So, aren't tree-based models enough?

They definitely are and that’s why we want to fully automate the machine learning process for them, so everyone will be able to use the computational power of the trees.

Installation

From GitHub

install.packages("devtools")
devtools::install_github("ModelOriented/forester")

Additional features installation

Some of the package dependencies are not present on CRAN, which means that the user has to follow the installation mentioned below. They should be especially helpful for macOS users:

catboost

The catboost model is used in the train() function as an additional engine.

devtools::install_url('https://github.com/catboost/catboost/releases/download/v1.2.2/catboost-R-Windows-1.2.2.tgz', INSTALL_opts = c("--no-multiarch", "--no-test-load"))

If you want to get the latest version of catboost, please take a look at their official website. Alternatively one can do a longer installation, where whole repository will be downloaded.

devtools::install_github('catboost/catboost', subdir = 'catboost/R-package')

ggradar

The ggradar is required for creating radar plot visualization in the report from the report() function.

devtools::install_github('ricardo-bion/ggradar', dependencies = TRUE)

tinytex

The tinytex is required for creating a report from the report() function.

install.packages('tinytex')
tinytex::install_tinytex()

How to build tree-based models in R?

What is the forester?

💡 full automation of the process of training tree-based models

💡 no demand for ML expertise

💡 powerful tool for making high-quality baseline models for experienced users

The forester package is an AutoML tool in R that wraps up all machine learning processes into a single train() function, which includes:

  • rendering a brief data check report,
  • preprocessing initial dataset enough for models to be trained,
  • training 5 tree-based models with default parameters, random search and Bayesian optimisation,
  • evaluating them and providing a ranked list.

For whom is this package created?

The forester package is designed for beginners in data science, but also for more experienced users. They get an easy-to-use tool that can be used to prepare high-quality baseline models for comparison with more advanced methods or a set of output parameters for more thorough optimization.

Introductory blogs

Authors

Currently (since the version 1.2.0) the package is being developed as both scientific research and Masters thesis at WUT (Warsaw University of Technology), by Hubert Ruczyński, under the supervision of Anna Kozak, and Anna Cena.

Beforehand (up till the version 1.1.4) this package was created inside the MI2.AI (Warsaw University of Technology) as both scientific research and Bachelor thesis by:

Project co-ordinator and supervisor: Anna Kozak

Auxiliary supervisor Przemysław Biecek

The first version of forester was created by:

  • Hoang Thien Ly
  • Szymon Szmajdziński

forester's People

Contributors

grudzienada avatar hbaniecki avatar hubertr21 avatar kozaka93 avatar laresbernardo avatar lhthien09 avatar pbiecek avatar pslowakiewicz avatar szmajasz avatar

Stargazers

 avatar  avatar  avatar  avatar  avatar  avatar  avatar  avatar  avatar  avatar  avatar  avatar  avatar  avatar  avatar  avatar  avatar  avatar  avatar  avatar  avatar  avatar  avatar  avatar  avatar  avatar  avatar  avatar  avatar  avatar  avatar  avatar  avatar  avatar  avatar  avatar  avatar  avatar  avatar  avatar  avatar  avatar  avatar  avatar  avatar  avatar  avatar  avatar  avatar  avatar  avatar  avatar  avatar  avatar  avatar  avatar  avatar  avatar  avatar  avatar  avatar  avatar  avatar  avatar  avatar  avatar  avatar  avatar  avatar  avatar  avatar  avatar  avatar  avatar  avatar  avatar  avatar  avatar  avatar  avatar  avatar  avatar  avatar  avatar  avatar  avatar  avatar  avatar  avatar  avatar  avatar  avatar  avatar  avatar  avatar  avatar  avatar  avatar  avatar  avatar

Watchers

 avatar  avatar  avatar  avatar  avatar  avatar  avatar  avatar  avatar  avatar  avatar

forester's Issues

strange behaviour: perfect performance

Perhaps this is linked to #34

I am using the Heart Failure Prediction Dataset (https://www.kaggle.com/fedesoriano/heart-failure-prediction/).

This is my code:

library(forester)
library(tidyverse)
library(here)
library(DALEX) # this is needed for the function model_performance (issue #34)
library(rsample)

df = read.csv(here('heart.csv'))
df_split = initial_split(df)

best_model <- forester(data = training(df_split),
					   data_test = testing(df_split),
                       target = "HeartDisease",
                       type = "classification",
					   metric = "precision",
                       tune = FALSE)

This is the output:

__________________________
FORESTER
Original shape of train data frame: 688 rows, 12 columns
_____________
NA values
There is no NA values in your data.
__________________________
CREATING MODELS
--- Ranger model has been created ---
Parameter 'cat_features' is meaningless because column types are taken from data.frame.
Please, convert categorical columns to factors manually.
--- Catboost model has been created ---
--- Xgboost model has been created ---
Warning in (function (params = list(), data, nrounds = 100L, valids = list(),  :
  lgb.train: Found the following passed through '...': learning_rate, objective. These will be used, but in future releases of lightgbm, this warning will become an error. Add these to 'params' instead. See ?lgb.train for documentation on how to call this function.
--- LightGBM model has been created ---
__________________________
COMPARISON
Results of compared models:


model       precision      recall          f1    accuracy         auc
---------  ----------  ----------  ----------  ----------  ----------
Ranger      1.0000000   1.0000000   1.0000000   1.0000000   1.0000000
XGboost     0.9870466   0.9921875   0.9896104   0.9883721   0.9878701
Catboost    0.9740260   0.9765625   0.9752926   0.9723837   0.9718339
LightGBM    0.9589744   0.9739583   0.9664083   0.9622093   0.9606634
The best model based on precision metric is Ranger.

So, according to forester the ranger model is perfect. Obviously, if I compute the metrics on the testing dataset I get normal values (<1). What is happening here?

Output printing is long

The output of the train() function should have its own class in addition to list and the print.___output_class__() function should be overloaded to print some kind of summary (a few best models, their performance etc.)

Error: Failed to install 'forester' from GitHub

devtools::install_github("ModelOriented/forester") Downloading GitHub repo ModelOriented/forester@HEAD Error: Failed to install 'forester' from GitHub: Multiple results for CXX11FLAGS found, something is wrong.FALSE

sessionInfo()
R version 4.1.2 (2021-11-01)
Platform: x86_64-w64-mingw32/x64 (64-bit)
Running under: Windows 10 x64 (build 19043)

could not find function "update_data"

The following code snippet in a fresh R and RStudio installation with all forester dependencies in.
library(forester)
data("apartments", package = 'DALEX')
best_model <- forester(data = apartments,
target = "m2.price",
type = "regression",
metric = "rmse",
tune = FALSE)

Returns:
CREATING MODELS
--- Ranger model has been created ---
Parameter 'cat_features' is meaningless because column types are taken from data.frame.
Please, convert categorical columns to factors manually.
--- Catboost model has been created ---
--- Xgboost model has been created ---
--- LightGBM model has been created ---


COMPARISON
Error in update_data(m, data_test[, -which(names(data_test) == target)], :
could not find function "update_data"

unmatched left parenthesis

(An unmatched left parenthesis creates an unresolved tension that will stay with you all day.

apartments_test <- apartments_test[ ,!(colnames(apartments_test) %in% "m2.price"]

error from`check_data` for big dataset

For a big dataset (114000 observations and 21 columns), I get the following error when using the check_data function:

Error in table(x, y) : attempt to make a table with >= 2^31 elements
In addition: Warning message:
Number of logged events: 1 

with following traceback:

> traceback()
8: stop("attempt to make a table with >= 2^31 elements")
7: table(x, y)
6: chisq.test(x, y, correct = FALSE, ...)
5: withCallingHandlers(expr, warning = function(w) if (inherits(w, 
       classes)) tryInvokeRestart("muffleWarning"))
4: suppressWarnings(chisq.test(x, y, correct = FALSE, ...)$statistic)
3: rcompanion::cramerV(fct_tbl[, i], fct_tbl[, j])
2: check_cor(df, y, verbose)
1: check_data(songs, "popularity", verbose = TRUE)

The used dataset: https://www.kaggle.com/datasets/maharshipandya/-spotify-tracks-dataset

forester model available error

forester.R line 87
if (class(is_available_ranger) == "try-error") {

returns the following error

Error in if (class(is_available_ranger) == "try-error") { : 
  the condition has length > 1

b/c

make_ranger.R line 166
class(ranger_explained) <- c("forester_model", "explainer")

this appears to apply to other models (xgboost, lightgbm, catboost) as well

Data loss prevention in make_catboost.R after BayesianOptimization

@Szmajasz hi Szymon, from line 66 to 126 in function make_catboost.R
` # Creating validation set in ratio 4:1
splited_data <- split_data(data, target, type)
data <- splited_data[[1]]
data_val <- splited_data[[2]]

# Creating pool objects for catboost 
categorical <- which(sapply(data, is.factor))
cat_data <- catboost::catboost.load_pool(data[, -which(names(data) == target), drop = FALSE],
                                         data[, target], cat_features = categorical)

cat_data_val <- catboost::catboost.load_pool(data_val[, -which(names(data_val) == target), drop = FALSE],
                                             data_val[, target], cat_features = categorical)

### Preparing tuning function 
catboost_tune_fun <- function(iterations, depth, learning_rate, random_strength, bagging_temperature, border_count, l2_leaf_reg){
  # Model for evaluating hyperparameters
  catboost_tune <- catboost::catboost.train(cat_data,
                                            params = list(verbose = 0,
                                                          iterations = iterations,
                                                          depth = depth,
                                                          learning_rate = learning_rate,
                                                          random_strength = random_strength,
                                                          bagging_temperature = bagging_temperature,
                                                          border_count = border_count,
                                                          l2_leaf_reg = l2_leaf_reg))
  
  # Evaluating model
  predicted <- catboost::catboost.predict(catboost_tune, cat_data_val)
  if (type == "classification"){
    predicted <- ifelse(predicted >= 0.5, 1, 0)
  }
  score <- desc * calculate_metric(tune_metric, predicted, data_val[[target]])
  
  list(Score = score, Pred = predicted)
}

### Tuning process
message("--- Starting tuning process")
tuned_catboost <- rBayesianOptimization::BayesianOptimization(catboost_tune_fun,
                                       bounds = list(iterations = c(10L, 1000L),
                                                     depth = c(1L, 8L),
                                                     learning_rate = c(0.01, 1.0),
                                                     random_strength = c(1e-9, 10),
                                                     bagging_temperature = c(0.0, 1.0),
                                                     border_count = c(1L, 255L),
                                                     l2_leaf_reg = c(2L, 30L)),
                                       init_grid_dt = NULL,
                                       init_points = 10,
                                       n_iter = tune_iter,
                                       acq = "ucb",
                                       kappa = 2.576,
                                       eps = 0.0,
                                       verbose = TRUE)

# Best hyperparameters
catboost_params <- append(tuned_catboost$Best_Par, list(verbose = 0))

# Creating final model 
cat_model <- catboost::catboost.train(cat_data, params = catboost_params)

}`
We used Bayesian Optimization to find most optimal tuple of hyperparameters. But I found that, we split the data into data and data_val, after finding optimal HP, we should train the model again on the original data_train to prevent data loss. I just think of combining those two structures: cat_data and cat_data_val from your code, but I don't know specifically whether it would be fine. It's much better if we can combine those two cat_data and cat_data_val instead of creating new variable.

catboost dependency

When installing,catboost wasn't found. Maybe add this step into the README file? O remove from Imports.

Installing package into ‘/Users/bernardolares/Library/R/4.0/library’
(as ‘lib’ is unspecified)
ERROR: dependency ‘catboost’ is not available for package ‘forester’
* removing ‘/Users/bernardolares/Library/R/4.0/library/forester’
Warning message:
In i.p(...) :
  installation of package ‘/var/folders/3w/x0bjsdv52v3b3kjbw87y3wfw0000gn/T//Rtmp2QFGHc/file24981fb7f433/forester_1.0.0.tar.gz’ had non-zero exit status

feature request: setting up another method for correlation analysis

Related to #65

I found information that Spearman correlation coefficient is used for numerical variables and Cramer's V for categorical ones. It would be nice to be able to set different methods for correlation analysis (as function defined by user or at least the name of the implemented method).

PS You have a typo in documentation for check_cor. I believe it should be Cramer's V instead of Crammer V there.

Error in GP_deviance(beta = row, X = X, Y = Y, nug_thres = nug_thres, : Infinite values of the Deviance Function, unable to find optimum parameters

Windows 10, R v4.1, forester v1.0.0 (fresh install - newest dependencies)

Error message:

Error in GP_deviance(beta = row, X = X, Y = Y, nug_thres = nug_thres,  : 
  Infinite values of the Deviance Function, 
            unable to find optimum parameters 

Code:

load(file = "dane_short_nefro.rda")
df_raw <- dane_short
colnames(df_raw)
colnames(df_raw) <- c("aki", "covid_goraczka", "covid_oddechowe", "covid_pokarmowy",
                      "covid_neurologiczne", "nadcisnienie", "cukrzyca", "miazdzyca_serca",
                      "hiperlipidemia", "kreatynina", "mioglobina", "aki_wywiad", 
                      "respirator", "pchn")

table(df_raw$aki_wywiad)
table(df_raw$aki, df_raw$aki_wywiad)

df <- df_raw[df_raw$aki_wywiad == 0, colnames(df_raw) != "aki_wywiad"]
dim(df)
table(df$aki)


library(forester)
set.seed(123)
# df$aki <- factor(df$aki) ## without this returns an error
best_model <- forester(
  data = df, 
  target = "aki", 
  type = "classification",
  metric = "precision", 
  tune = TRUE
)

@lhthien09 has the data.

could not find function "check_conditions"

Hi, great package but
`library(forester)
library(DALEX)

data("titanic", package = 'DALEX')
check_conditions(data = "titanic", target = "survived", type = "classification")
Error in check_conditions(data = "titanic", target = "survived", type = "classification") :
could not find function "check_conditions"`

sessionInfo()
R version 4.1.1 (2021-08-10)
Platform: x86_64-w64-mingw32/x64 (64-bit)
Running under: Windows 10 x64 (build 19043)

Matrix products: default

locale:
[1] LC_COLLATE=Russian_Russia.1251 LC_CTYPE=Russian_Russia.1251 LC_MONETARY=Russian_Russia.1251
[4] LC_NUMERIC=C LC_TIME=Russian_Russia.1251

attached base packages:
[1] stats graphics grDevices utils datasets methods base

other attached packages:
[1] DALEX_2.3.0 forester_1.0.0

loaded via a namespace (and not attached):
[1] Rcpp_1.0.7 lubridate_1.8.0 lattice_0.20-44
[4] tidyr_1.1.4 listenv_0.8.0 prettyunits_1.1.1
[7] class_7.3-19 assertthat_0.2.1 digest_0.6.28
[10] ipred_0.9-12 foreach_1.5.1 utf8_1.2.2
[13] parallelly_1.28.1 ranger_0.13.1 R6_2.5.1
[16] highr_0.9 ggplot2_3.3.5 pillar_1.6.4
[19] rlang_0.4.12 progress_1.2.2 rstudioapi_0.13
[22] data.table_1.14.2 rpart_4.1-15 Matrix_1.3-4
[25] labeling_0.4.2 splines_4.1.1 gower_0.2.2
[28] htmlwidgets_1.5.4 r2d3_0.2.5 munsell_0.5.0
[31] xfun_0.27 compiler_4.1.1 pkgconfig_2.0.3
[34] htmltools_0.5.2 globals_0.14.0 nnet_7.3-16
[37] tidyselect_1.1.1 tibble_3.1.5 prodlim_2019.11.13
[40] modelStudio_3.0.0 codetools_0.2-18 GPfit_1.0-8
[43] catboost_0.26.1 lightgbm_3.3.0 fansi_0.5.0
[46] future_1.22.1 crayon_1.4.1 dplyr_1.0.7
[49] withr_2.4.2 MASS_7.3-54 recipes_0.1.17
[52] grid_4.1.1 jsonlite_1.7.2 gtable_0.3.0
[55] lifecycle_1.0.1 DBI_1.1.1 magrittr_2.0.1
[58] scales_1.1.1 future.apply_1.8.1 farver_2.1.0
[61] iBreakDown_2.0.1 timeDate_3043.102 ellipsis_0.3.2
[64] lhs_1.1.3 generics_0.1.1 vctrs_0.3.8
[67] xgboost_1.4.1.1 lava_1.6.10 iterators_1.0.13
[70] tools_4.1.1 glue_1.4.2 purrr_0.3.4
[73] hms_1.1.1 ingredients_2.2.0 rsconnect_0.8.24
[76] yaml_2.2.1 fastmap_1.1.0 parallel_4.1.1
[79] survival_3.2-13 colorspace_2.0-2 knitr_1.36
[82] rBayesianOptimization_1.2.0

Returning of predicted probabilities

It would be helpful to return the estimated probability values by forester. Thus, performance metrics based on probability values can also be used.

Providing option for automatic labeling

For binary classification problems, forester automatically converts the response variable to 0-1 values. In some cases, forester may label 0-1 values in the original data in the opposite way. Here the user can be provided with an option to control this.

No detailed information on the correlation between columns

  • I didn't find information about what threshold is used to consider the correlation strong.
  • Output of the check_data function doesn't contain information on what correlation coefficient is calculated - I found answer in documentation for check_cor function but it would be useful to know this information from 'CHECK DATA REPORT'.

run forester parallel

Hello,
congratulations on developing this package.
is there any way to run in parallel? my database is very big and I need to use many cores..
thanks

tune=FALSE outperforms tune=TRUE

Maybe titanic is too small for good hp tuning or some artifact from stochastic fitting, but tune=TRUE was quite expensive for generally worse precision.

## tune = FALSE
R> best_model <- forester(data = titanic, target = "survived", type = "classification",
+                        metric = "precision", tune = FALSE)
...
model       precision   recall       f1   accuracy      auc
---------  ----------  -------  -------  ---------  -------
LightGBM       0.8275   0.9433   0.8816     0.8284   0.7654
XGboost        0.8252   0.9600   0.8875     0.8352   0.7667
Catboost       0.8182   0.9600   0.8834     0.8284   0.7562
Ranger         0.8079   0.9533   0.8746     0.8149   0.7389

## tune = TRUE (default tune_iter=20)
R> best_model2 <- forester(data = titanic, target = "survived", type = "classification",
+                        metric = "precision", tune = TRUE)
...
model       precision   recall       f1   accuracy      auc
---------  ----------  -------  -------  ---------  -------
LightGBM       0.8140   0.8900   0.8503     0.7878   0.7317
XGboost        0.8125   0.9100   0.8585     0.7968   0.7347
Catboost       0.8088   0.9167   0.8594     0.7968   0.7311
Ranger         0.8088   0.9167   0.8594     0.7968   0.7311

## double/triple checking tune=FALSE
R> suppressMessages(forester(data = titanic, target = "survived", type = "classification",
+                           metric = "precision", tune = FALSE))
model       precision   recall       f1   accuracy      auc
---------  ----------  -------  -------  ---------  -------
LightGBM       0.8174   0.9400   0.8744     0.8172   0.7497
Catboost       0.8121   0.9367   0.8700     0.8104   0.7411
Ranger         0.8040   0.9433   0.8681     0.8059   0.7304
XGboost        0.7989   0.9267   0.8580     0.7923   0.7186

## and again
model       precision   recall       f1   accuracy      auc
---------  ----------  -------  -------  ---------  -------
LightGBM       0.8163   0.9333   0.8709     0.8126   0.7464
XGboost        0.8132   0.9433   0.8735     0.8149   0.7444
Catboost       0.8109   0.9433   0.8721     0.8126   0.7409
Ranger         0.7877   0.9400   0.8571     0.7878   0.7043

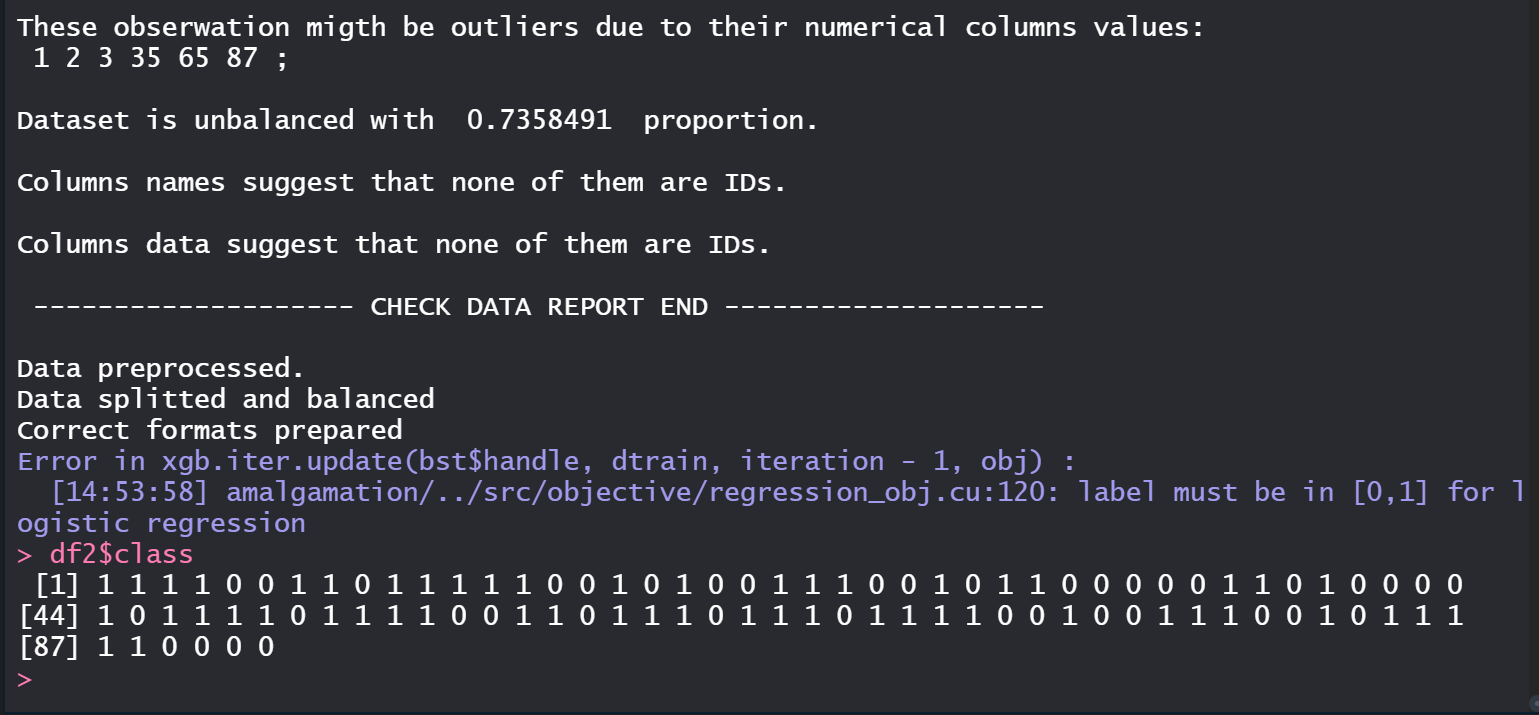
titanic_imputed data: label must be in [0,1] for logistic regression

I have following error

library(DALEX)
library(forester)
output1 <- train(data = titanic_imputed,
                 y = 'survived',
                 bayes_iter = 0,
                 verbose = TRUE,
                 random_iter = 5)

results in

Error in xgb.iter.update(bst$handle, dtrain, iteration - 1, obj) : 
  [14:39:04] amalgamation/../src/objective/regression_obj.cu:138: label must be in [0,1] for logistic regression
Stack trace:
  [bt] (0) 1   xgboost.so                          0x00000001153eeff4 dmlc::LogMessageFatal::~LogMessageFatal() + 116
  [bt] (1) 2   xgboost.so                          0x000000011550ccb4 xgboost::obj::RegLossObj<xgboost::obj::LogisticClassification>::GetGradient(xgboost::HostDeviceVector<float> const&, xgboost::MetaInfo const&, int, xgboost::HostDeviceVector<xgboost::detail::GradientPairInternal<float> >*) + 660
  [bt] (2) 3   xgboost.so                          0x00000001154c5514 xgboost::LearnerImpl::UpdateOneIter(int, std::__1::shared_ptr<xgboost::DMatrix>) + 788
  [bt] (3) 4   xgboost.so                          0x0000000115488f2c XGBoosterUpdateOneIter + 140
  [bt] (4) 5   xgboost.so                          0x00000001153eb8c3 XGBoosterUpdateOneIter_R + 67
  [bt] (5) 6   libR.dylib                          0x000000010b4a5f52 R_doDotCall + 1458
  [bt
In addition: Warning message:
In storage.mode(data) <- "double" : NAs introduced by coercion

and here is traceback

> traceback()
5: xgb.iter.update(bst$handle, dtrain, iteration - 1, obj)
4: xgb.train(params, dtrain, nrounds, watchlist, verbose = verbose, 
       print_every_n = print_every_n, early_stopping_rounds = early_stopping_rounds, 
       maximize = maximize, save_period = save_period, save_name = save_name, 
       xgb_model = xgb_model, callbacks = callbacks, ...)
3: xgboost::xgboost(data$xgboost_data, as.vector(data$ranger_data[[y]] - 
       1), objective = "binary:logistic", nrounds = 20, verbose = 0)
2: train_models(train_data, y, engine, type)
1: train(data = titanic_imputed, y = "survived", bayes_iter = 0, 
       verbose = TRUE, random_iter = 5)

Please let me know if I can use the titanic imputed_data with forester

model_performance()

After training models, {forester} couldn't find function model_performance(), which is later used to display a table of performance comparison over different metrics.

update_data not found

Hi! Testing with the titanic example on README, I'm getting the following error:

Error in update_data(m, data_test[, -which(names(data_test) == target)],  : 
  could not find function "update_data"

unclear structure of `predict_new`

Result of

predict_new(train_out = output2,
            data = new_lisbon)

is list of vectors but it is not clear if this is models x obs or obs x models

maybe named list will solve this problem?

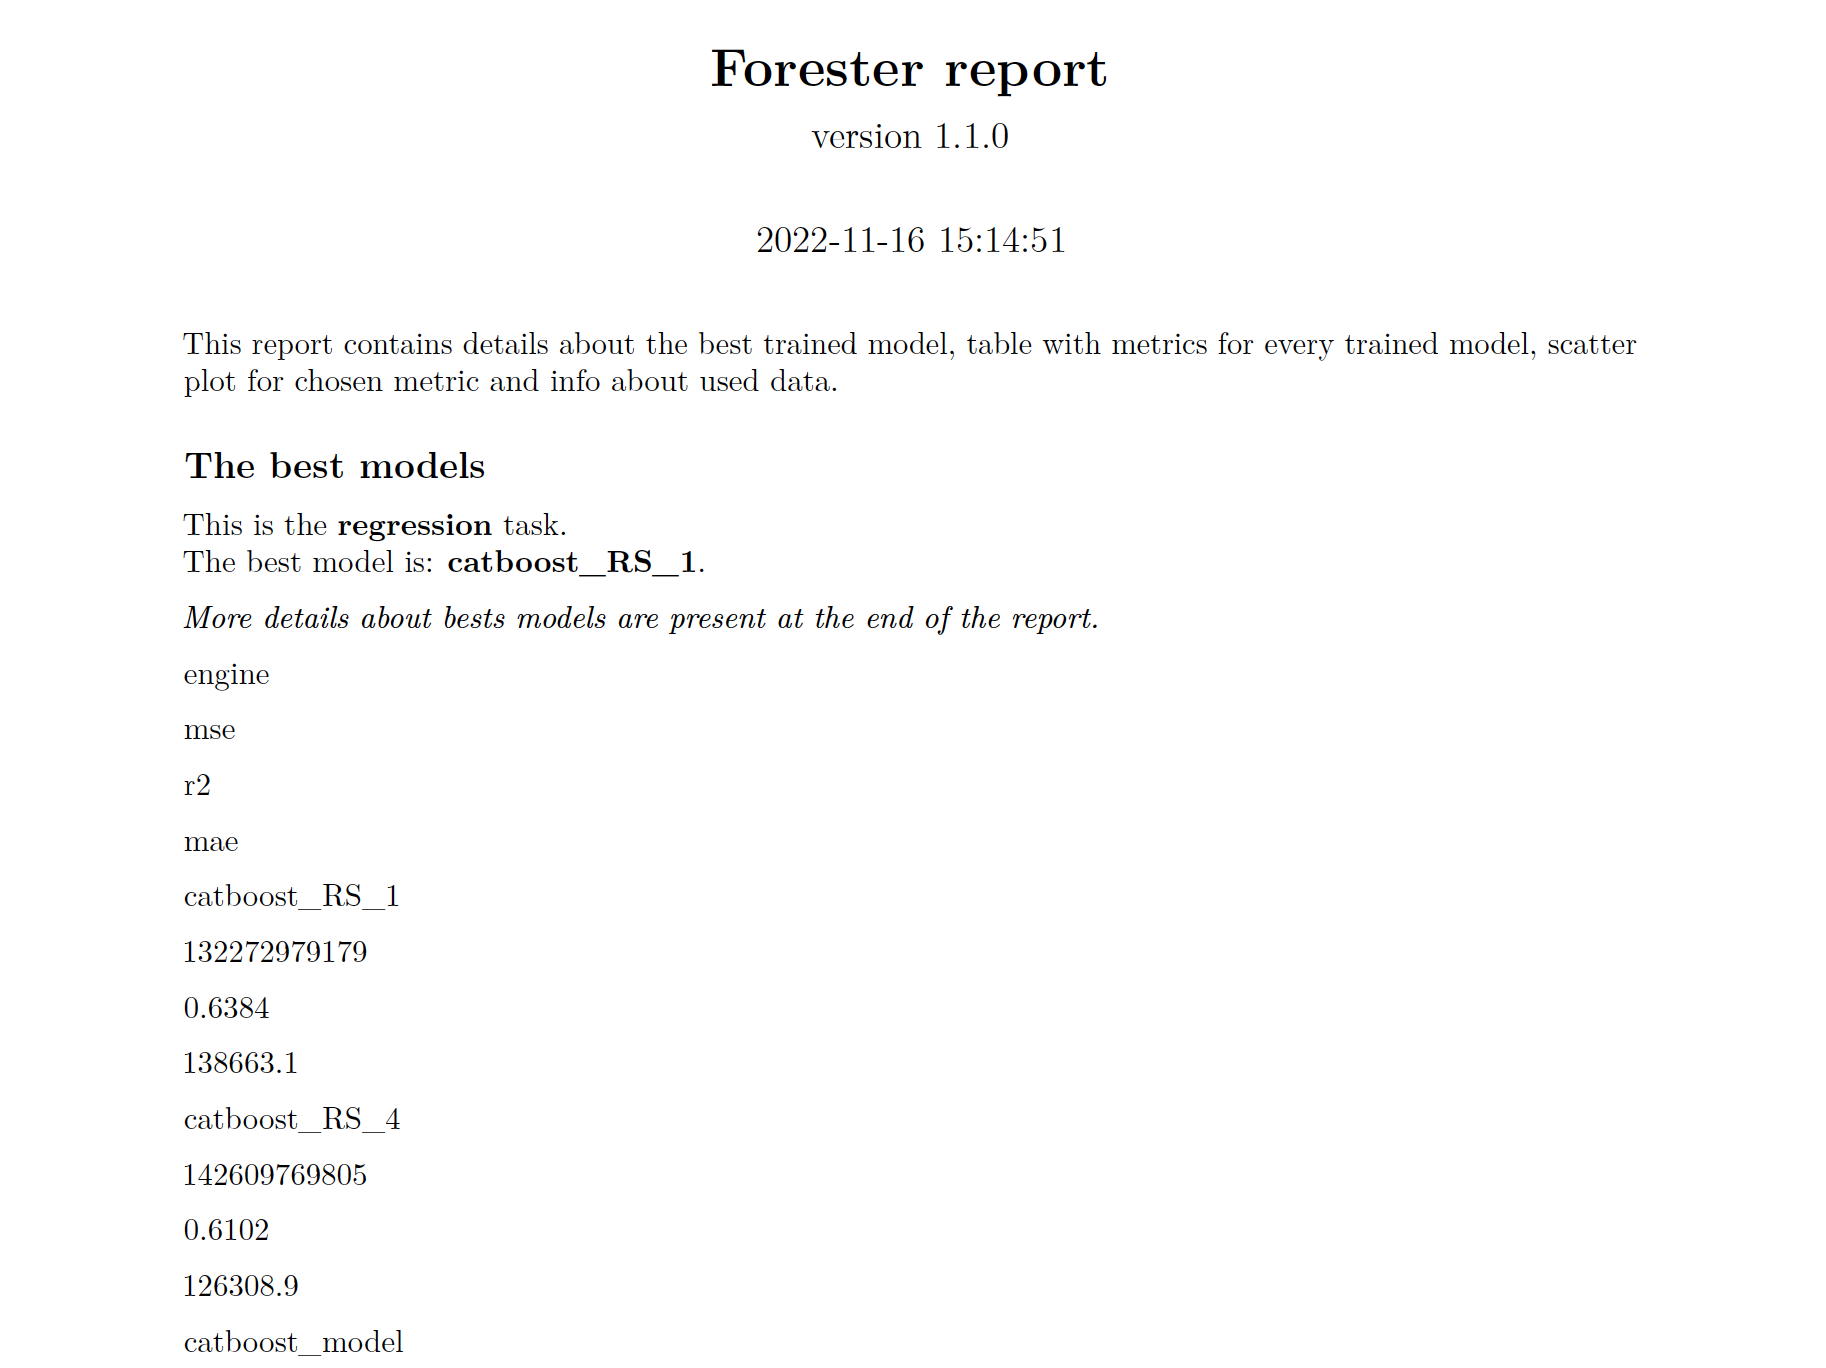
lisbon: report

strange formatting for

report(train_output = output1,
       output_file  = 'hands_on_report')

for some reason there is no table, just a column

Screenshot 2022-11-16 at 3 19 38 PM

Usage example causes session to abort

Running the following example from the README.md causes the session to abort:

library(forester)

data("titanic", package = 'DALEX')
best_model <- forester(data = titanic, target = "survived", type = "classification", metric = "precision", tune = FALSE)

Forester proceeds with the first steps creating Ranger, XgBoost, and Catboost models then aborts the session.

My sessionInfo:

R version 4.1.1 (2021-08-10)
Platform: x86_64-w64-mingw32/x64 (64-bit)
Running under: Windows 10 x64 (build 19043)

Matrix products: default

locale:
[1] LC_COLLATE=English_United Kingdom.1252 LC_CTYPE=English_United Kingdom.1252
[3] LC_MONETARY=English_United Kingdom.1252 LC_NUMERIC=C
[5] LC_TIME=English_United Kingdom.1252

attached base packages:
[1] stats graphics grDevices utils datasets methods base

loaded via a namespace (and not attached):
[1] bit_4.0.4 odbc_1.3.2 compiler_4.1.1 ellipsis_0.3.2 generics_0.1.0 hms_1.1.0
[7] DBI_1.1.1 tools_4.1.1 Rcpp_1.0.7 bit64_4.0.5 lubridate_1.7.10 vctrs_0.3.8
[13] blob_1.2.2 lifecycle_1.0.0 pkgconfig_2.0.3 rlang_0.4.11

"Too few classes for binary classification" error

Hi,

I am testing the forester package as I'm happy to find an automl package that includes a few algos not included in other automl packages. When putting together an RMD to compare performance of forester and h2o automl on the titanic data, I am able to successfully run the forester on the full titanic dataframe as in the documentation. However, if I attempt a train/test split I get the following error:

"Error in check_conditions(data, target, type) : Too few classes for binary classification"

I also get this same error on the wa_churn and mlc_churn dataframes from modeldata even without a train/test split.

Using the same basic code:

library("ROSE")
titanic_under <- ovun.sample(survived ~ . , data = titanic, method = "under")$data %>% convert(fct(survived))

titanic_split <- initial_split(titanic_under, .7, strata = churn)
training <- training(titanic_split)

best_model <- forester(data = training, target = "survived", type = "classification", metric = "f1", tune = TRUE)

&

best_model <- forester(data = wa_churn, target = "churn", type = "classification", metric = "f1", tune = TRUE)

The target in both cases are factors with two levels (titanic is survived = yes/no; wa_churn is churn = yes/no with 7043 rows). I'm not certain what the error message is supposed to be telling me, but seems to suggest a problem with the target factor.

Could you please clarify?

Also, it doesn't appear from the documentation diagram that a test/train split is part of the automl process. I don't see anything else in the documentation about it. Could you clarify that as well?

Many thanks,
Brian

`catboost` and `ggradar` dependencies

Two mentioned packages from imports aren't on CRAN.
In particular, installing catboost on macOS is quite problematic. 😕
Maybe you could provide a link or installation instructions in readme?

For me, the following code from turned out to be helpful (based on #11):
devtools::install_url('https://github.com/catboost/catboost/releases/download/v1.1.1/catboost-R-Darwin-1.1.1.tgz', INSTALL_opts = c("--no-multiarch", "--no-test-load", "--no-staged-install"))

Perhaps it would also be beneficial to remove catboost from imports and remove it from the engine vector in train function with warning message if user doesn't have package installed. These are just suggestions. Thanks for the cool package!

error in example

In example
data("apartments", package = 'DALEX') data("apartments_test", package = 'DALEX') catboost <- make_catboost(apartments, "m2.price", "regression", tune = TRUE, metric = "rmse")
should be
catboost <- make_catboost(apartments, "m2.price", "regression", tune = TRUE, tune_metric = "rmse"

How to save the better model?

How do I save the better model after forester analysis finished to disk so that I can load it at a later time? I'd like to use save() and load() or saveRDS() or readRDS() functions. It is possible?

In my case, I make:

# Build the model pipeline
cc_model_complete <- forester::forester(data = RES_sel_vars,
                           target = "cc",
                           type = "regression")
# COMPARISON
# Results of compared models:
# model            rmse         mse          r2         mad
# ---------  ----------  ----------  ----------  ----------
# Ranger      0.0480812   0.0023118   0.9005513   0.0266172
# Catboost    0.0776190   0.0060247   0.7408305   0.0454772
# XGboost     0.0839399   0.0070459   0.6969006   0.0493881
# LightGBM    0.0928959   0.0086296   0.6287718   0.0540686
# The best model based on rmse metric is Ranger.

and I'd like to save the better model inside the object cc_model_complete.

Thanks in advance,

Alexandre

Two problems

  1. Running your example from your Medium article I receive the error
    "Error in make_ranger(data = data_train, target = "overall", type = "regression", :
    unused argument (label = "Basic Ranger")"
    and the run ceases.

  2. Running the following causes an error
    f_model <- forester(data = data_train,
    target = "overall",
    type = "regression")


FORESTER
Original shape of train data frame: 3200 rows, 42 columns


NA values
There is no NA values in your data.


CREATING MODELS
--- Ranger model has been created ---
Error in library.dynam(lib, package, package.lib) :
shared object ‘libcatboostr.so’ not found

Are you able to tell me what I am doing wrong?
Many thanks

(System Software Overview:
System Version: macOS 11.6 (20G165)
Kernel Version: Darwin 20.6.0
Boot Volume: Macintosh HD
Boot Mode: Normal)

titanic_imputed: arguments must have same length error during training

In a following example:

library(DALEX)
library(forester)

titanic_imputed$survived <- factor(titanic_imputed$survived)

output2 <- train(data = titanic_imputed,
                 y = 'survived',
                 bayes_iter = 5,
                 engine = c('ranger', 'xgboost', 'decision_tree'),
                 verbose = TRUE,
                 random_iter = 3)

I have following error:

Error in tapply(observed, predicted, sum) : 
  arguments must have same length

with following traceback:

> traceback()
5: stop("arguments must have same length")
4: tapply(observed, predicted, sum)
3: model_performance_auc(predictions[i], observed - 1)
2: score_models(model, predictions, test_data$ranger_data[[y]], 
       type, metrics = metrics, sort_by = sort_by, metric_function = metric_function, 
       metric_function_decreasing = metric_function_decreasing)
1: train(data = titanic_imputed, y = "survived", bayes_iter = 5, 
       engine = c("ranger", "xgboost", "decision_tree"), verbose = TRUE, 
       random_iter = 3)

Code error in Usage example

In README.md the following code throws an error due to the type being set to 'regression' rather than 'classification'

best_model <- forester(data = titanic, target = "survived", type = "regression", metric = "precision", tune = FALSE)

Error:
__________________________ FORESTER Error in check_conditions(data, target, type) : Program is stopped. The class of target column is factor, not appropriate for regression problem

allow for custom metrics

It would be useful to pass a custom metric/tune_metric (R function) to forester() etc. instead of only a predefined character.

Recommend Projects

  • React photo React

    A declarative, efficient, and flexible JavaScript library for building user interfaces.

  • Vue.js photo Vue.js

    🖖 Vue.js is a progressive, incrementally-adoptable JavaScript framework for building UI on the web.

  • Typescript photo Typescript

    TypeScript is a superset of JavaScript that compiles to clean JavaScript output.

  • TensorFlow photo TensorFlow

    An Open Source Machine Learning Framework for Everyone

  • Django photo Django

    The Web framework for perfectionists with deadlines.

  • D3 photo D3

    Bring data to life with SVG, Canvas and HTML. 📊📈🎉

Recommend Topics

  • javascript

    JavaScript (JS) is a lightweight interpreted programming language with first-class functions.

  • web

    Some thing interesting about web. New door for the world.

  • server

    A server is a program made to process requests and deliver data to clients.

  • Machine learning

    Machine learning is a way of modeling and interpreting data that allows a piece of software to respond intelligently.

  • Game

    Some thing interesting about game, make everyone happy.

Recommend Org

  • Facebook photo Facebook

    We are working to build community through open source technology. NB: members must have two-factor auth.

  • Microsoft photo Microsoft

    Open source projects and samples from Microsoft.

  • Google photo Google

    Google ❤️ Open Source for everyone.

  • D3 photo D3

    Data-Driven Documents codes.