Git Product home page Git Product logo

language-server-protocol-inspector's Introduction

Language Server Protocol Inspector

⚠️The repository got archived since we don't serve the inspector on the Language Server Protocol website anymore⚠️

Motivation

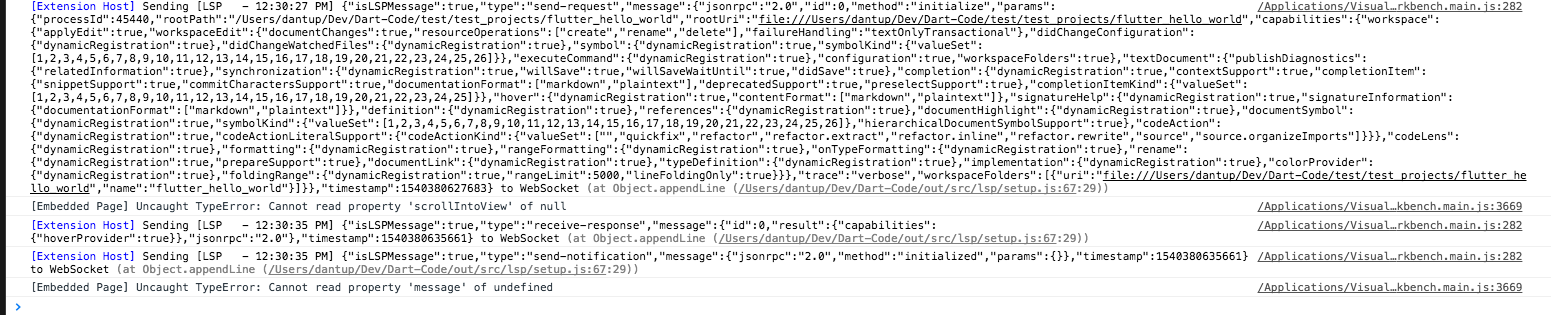
When you are using vscode-languageserver-node to develop a language server, it's possible to specify a setting "[langId].trace.server": "verbose" to make the Language Client log the LSP communication. This log is useful for developing and testing the Language Server, but the log can be lengthy — using the editor for 5 seconds could generate 5000 lines of LSP log. This makes it hard to gain insight from the logs.

This inspector visualizes the logs to make it easy to understand the communication between the Language Client / Server. It also lets you filter the logs by search query or language features, so you can quickly identify the logs you are interested in.

lsp-inspector

Usage

  • A log file (log from html Language Server) is loaded by default.
  • Click each LSP item to expand its parameters.
  • Type a query into the search bar to filter the logs.
  • Select a language feature area to filter the logs.
  • Collect your own logs and inspect them! For example:
    • Set css.trace.server: "verbose" in VS Code.
    • Open a CSS file.
    • Copy everything inside CSS Language Server channel into a log file css.log.
    • Load it from the web app.
  • You can try it on real-world logs file at /tests/unit/logParser/fixture.

Log Format

The Inspector takes two log formats: text and json.

  • text:
    • Logs generated by setting "[langId].trace.server": "verbose".
    • Logs generated by setting "[langId].trace.server": { "format": "Text" }
  • json: Logs generated by setting: "[langId].trace.server": { "format": "JSON" }

The Inspector could load any JSON logs, as long as they follow this format:

export type MsgKind =
  | 'send-notification'
  | 'recv-notification'
  | 'send-request'
  | 'recv-request'
  | 'send-response'
  | 'recv-response'

export interface LspItem {
  type: MsgKind
  message: any
  timestamp: unix timestamp
}

Each line is terminated with \r\n.

Here is a sample:

{"type":"receive-response","message":{"jsonrpc":"2.0","id":0,"result":{"capabilities":{"textDocumentSync":1,"completionProvider":{"resolveProvider":true}}}},"timestamp":1534721620392}\r\n
{"type":"send-notification","message":{"jsonrpc":"2.0","method":"initialized","params":{}},"timestamp":1534721620393}\r\n

Running & Developing

Navigate to the sub-folder lsp-inspector, and:

  • yarn
  • yarn serve

License

Copyright (c) Microsoft Corporation. All rights reserved.

Licensed under the MIT License.

language-server-protocol-inspector's People

Contributors

dbaeumer avatar dependabot[bot] avatar eashi avatar jonnyboyc avatar microsoftopensource avatar msftgits avatar octref avatar omartawfik avatar

Stargazers

 avatar  avatar  avatar  avatar  avatar  avatar  avatar  avatar  avatar  avatar  avatar  avatar  avatar  avatar  avatar  avatar  avatar  avatar  avatar  avatar  avatar  avatar  avatar  avatar  avatar  avatar  avatar  avatar  avatar  avatar  avatar  avatar  avatar  avatar  avatar  avatar  avatar  avatar  avatar  avatar  avatar  avatar  avatar  avatar  avatar  avatar  avatar  avatar  avatar  avatar  avatar  avatar  avatar  avatar  avatar  avatar  avatar  avatar  avatar  avatar  avatar  avatar  avatar  avatar  avatar  avatar  avatar  avatar  avatar  avatar  avatar  avatar  avatar  avatar  avatar  avatar  avatar  avatar  avatar  avatar  avatar  avatar  avatar  avatar  avatar  avatar  avatar  avatar  avatar  avatar  avatar  avatar  avatar  avatar  avatar  avatar  avatar  avatar  avatar  avatar

Watchers

 avatar  avatar  avatar  avatar  avatar  avatar  avatar  avatar  avatar  avatar  avatar  avatar  avatar  avatar  avatar  avatar  avatar  avatar  avatar  avatar  avatar  avatar  avatar  avatar

language-server-protocol-inspector's Issues

LSP Inspector doesn't work

For working with the tsserver log.
I've set "typescript.tsserver.log":"verbose" copied the resulting log and it results in "No Matching Message"

Polish UI for the inspector

From @octref on June 7, 2018 18:46

Goals

  • Offer good overview / glance value of what's happening over the protocol
    • Params should be collapsed
  • Offer easy search / filtering
    • Partial text match for filtering. For example, typing comp should single out all the completion request / responses
    • Be able to filter by language features, for example
      • completion / completion resolve
      • code lens / code lens resolve
      • formatting / range formatting / on type formatting

Technical

  • This should be a web app that's possible to run stand-alone or in VS Code Webview
  • This inspector should take two kinds of input
    1. A complete JSON log, which the LanguageClient should write to the output channel if [language-server-id].trace.server is set to json. This allows copy-pasting of a complete log into the visualizer.
    2. JSON Stream. This allows an external data source to send JSON logs continuously to the Inspector, which transforms the JSON event into a visualized DOM element and append to the end.

/cc @dbaeumer

Copied from original issue: octref/lsp-inspector#3

Fix Travis

For some reason, Travis cannot find this repo.

  • Fix travis
  • CI badge

Newlines are ignored when streaming

When streaming into the inspector via websocket, the inspector silently fails to show the streamed content, if multiple jsonrpc messages (separated by "\r\n") are contained in one websocket message.

The reason for this is that line breaks are ignored when streaming.

This is inconsistent with the documentation in the README.

Support CRLF

From @tboby on June 25, 2018 15:36

Hi, just saw this go live. Hope this is the right place for feedback.

It seems that this tool doesn't support CRLF line endings. It throws a JSON parsing error.

VM2150:7 Uncaught SyntaxError: Unexpected token [ in JSON at position 65
    at JSON.parse (<anonymous>)
    at be (app.695a9541.js:formatted:26621)
    at app.695a9541.js:formatted:26603
    at Array.forEach (<anonymous>)
    at pe (app.695a9541.js:formatted:26602)
    at h.updateLog (app.695a9541.js:formatted:26692)
    at chunk-vendors.a8885d66.js:12
    at chunk-vendors.a8885d66.js:12
    at Array.forEach (<anonymous>)
    at chunk-vendors.a8885d66.js:12

Same file, different line endings:
crlf.log
lf.log

Copied from original issue: octref/lsp-inspector#11

Show milliseconds in speech bubbles

In order evaluate language server it would be useful, if the time is shown with millisecond instead of second precision in the speech bubbles that represent jsonrpc messages.

Specify log file format

I'd like to use the inspector for clients that are not VSCode. So my client should generate logs in the right format. However, the expected format from the inspector isn't specified.

Is this project dead

I've tried the project out and was unable to make it work out of the box for LSP logs from VSCode. Tried both with verbose and JSON logs, there is always an error during parsing.

My issue is possibly fixed by one of the open PRs but they seem to be lingering there for months.

Are there plans to continue working on this project?

Expanding large message crashes page

I created a log from the JSON language with "json.trace.server": "verbose". Most nodes I can expand/collapse to see the text content, but there are vscode/content messages, expanding one of these hangs the browser.

I guess these are maybe huge - I'm not sure what the vscode/content message represents - but if the message text is too big to render, maybe some kind of truncation would be better?

Gist of the log I uploaded is here (large) https://gist.github.com/nwolverson/b28b74a23a151a3efa03b4827110d578

Be able to convert output log into test cases

From @octref on June 7, 2018 18:55

The logs are good for end-to-end testing purposes. For example, if the log looks like that:

initialize
initialized
didOpen
didChange
textdocument/Completion
response for textdocument/Completion

It would be great if we can

  • Use the inspector to look at the log
  • Save everything except response for textdocument/Completion as a JSON
  • Save response for textdocument/Completion as a JSON
  • Have a library that can "play back" the first 5 steps and make assertions on the response

Copied from original issue: octref/lsp-inspector#4

JSON log format not working

The JSON log format sample doesn't appear to work.

Steps:

  1. Copy provided example into file
  2. Replace \r\n with actual carriage return and newlines
  3. Upload log to viewer

Expected: It shows the two messages
Actual: It says "No Matching Message"

Similarly in VS Code (1.41.1) it wouldn't accept {"format": "JSON"} as a value for "css.trace.server", only "off", "messages", or "verbose". It seems as if JSON support has not been implemented yet, or that it was removed at some point.

Dogfood for Vetur development

From @octref on June 6, 2018 18:4

  • Move it out as a Vue web app
  • Use websockets from extension to stream channel content to web app
  • Can also run it in webview (webview seems to support WebSocket), but later if LSP SDK offers custom tracer this wouldn't be needed

Copied from original issue: octref/lsp-inspector#2

support for other language servers

I work on the Microsoft C++ extension for VSCode and would like to use this for visualizing my logs. I currently have the capability to export all communication between VSCode and the language server as a JSON array, but when I tried to upload my file and view it in the visualizer it failed. If you could document the format you expect to see, perhaps I could modify my output to match. Or if you could support reading in a JSON array, that would be nice too.

Thanks.

LSP Inspector

From @octref on June 4, 2018 9:29

Motivation:

  • Looking at the raw source do not provide certain insights into the behavior of LSP
  • Users have hard time extract useful information from LSP communication and provide that to LSP authors. For example, in this issue the user can only describe the behavior of VS Code. If user's able to provide the data in the LSP, it would be much easier to understand what's going wrong.

Use cases:

  • Teaching users about LSP (Online playground. Left side is monaco, right side is LSP inspector)
  • Extract information from LSP for issue reporting. Let's say an user is having issue running a code action is TypeScript. With the info from LSP inspector, users can give exactly the request/response args in the issue report and make it easier for LS author to debug.
  • Possibly tie to testing together with (https://github.com/octref/vscode-language-server-e2e-test). The inspector could record the LSP communication and generate test cases, for example:
    • LSP inspector records a request and response combo of textDocument/completion
    • Response should contain 1 more item
    • Extension author generates a test case and manually add the missing CompletionItem to the response JSON
    • Extension author now has one more end-to-end test covering the completion case

Current Implementation:

  • Requires modification on language client but not language server.
  • However, if VS Code provides a way to listen/inspect channel contents, or a centralized place to listen to all LSP logs, this inspector could run without any modification to any client/server.

lsp

The UI can be improved, but this just serves as a basis for continued discussion.

Copied from original issue: octref/lsp-inspector#1

Initialize response messages from server does not appear in the log (using stream/websocket)

My messages from the server don't seem to appear in the inspector:

screen shot 2018-10-24 at 12 26 18 pm

If I add some logging when we send data over the websocket, like this:

appendLine(value: string) {
	log += value;
	if (socket && socket.readyState === WebSocket.OPEN) {
		socket.send(log);
		console.log(`Sending ${log} to WebSocket`);
	}
	log = "";
},

It does show in the console:

Sending [LSP   - 12:30:27 PM] {"isLSPMessage":true,"type":"send-request","message":{ // SNIP  // to WebSocket
Sending [LSP   - 12:30:35 PM] {"isLSPMessage":true,"type":"receive-response","message":{"id":0,"result":{"capabilities":{"hoverProvider":true}},"jsonrpc":"2.0"},"timestamp":1540380635661} to WebSocket
Sending [LSP   - 12:30:35 PM] {"isLSPMessage":true,"type":"send-notification","message":{"jsonrpc":"2.0","method":"initialized","params":{}},"timestamp":1540380635661} to WebSocket

There are some errors in the dev tools, not sure if they're related:

screen shot 2018-10-24 at 12 32 41 pm

Extend Node SDK to allow JSON format output

From @octref on June 18, 2018 7:53

Allow an object literal to be passed to [langId].trace.server, like

{
  "format": "json" | "text",
  "verbosity": "off" | "messages" | "verbose",
  "output": "channel" | "log" | "websocket"
}

And make sure the JSON output can be digested by the format in #7.

Copied from original issue: octref/lsp-inspector#8

Not obvious how to collapse an entry again

microsoft/vscode#52866

Repo

  1. Expand a message entry.
  2. Try clicking to collapse it again

Bug
To collapse an entry, you have to click on the title again. I found this somewhat non-obvious. Perhaps add a collapse triangle icon that is also clickable? Or allow the entire header of the entry to be clicked instead of just the title?

HEADER_LENGTH is not always 21

In jsonLogParser, the HEADER_LENGTH is set to 21:

And the it resolves string after header:

const item = JSON.parse(log.slice(HEADER_LENGTH))

But the header length is not always 21 because the header contains current time, which changes as system language changes.

I'm using a workaround to resolve the header myself, but I hope it can be fixed.

' '.repeat(21) + log.replace(/^\[LSP[^\]]+\]\s*/, '')

Thanks.

Recommend Projects

  • React photo React

    A declarative, efficient, and flexible JavaScript library for building user interfaces.

  • Vue.js photo Vue.js

    🖖 Vue.js is a progressive, incrementally-adoptable JavaScript framework for building UI on the web.

  • Typescript photo Typescript

    TypeScript is a superset of JavaScript that compiles to clean JavaScript output.

  • TensorFlow photo TensorFlow

    An Open Source Machine Learning Framework for Everyone

  • Django photo Django

    The Web framework for perfectionists with deadlines.

  • D3 photo D3

    Bring data to life with SVG, Canvas and HTML. 📊📈🎉

Recommend Topics

  • javascript

    JavaScript (JS) is a lightweight interpreted programming language with first-class functions.

  • web

    Some thing interesting about web. New door for the world.

  • server

    A server is a program made to process requests and deliver data to clients.

  • Machine learning

    Machine learning is a way of modeling and interpreting data that allows a piece of software to respond intelligently.

  • Game

    Some thing interesting about game, make everyone happy.

Recommend Org

  • Facebook photo Facebook

    We are working to build community through open source technology. NB: members must have two-factor auth.

  • Microsoft photo Microsoft

    Open source projects and samples from Microsoft.

  • Google photo Google

    Google ❤️ Open Source for everyone.

  • D3 photo D3

    Data-Driven Documents codes.