Git Product home page Git Product logo

cypress-audit's Introduction

👋 Hello, I'm Marvin

I'm a french software developer loving testing automation and trying my best to focus on ethical solutions. Mostly building products with Typescript, React and React Native.

I used to build Strapi and Gatsby Cloud in a previous life.

Secretly dreaming of becoming an IT teacher.

cypress-audit's People

Contributors

ahnpnl avatar blatinier avatar davidjeddy avatar dependabot[bot] avatar j-maddo avatar kosai106 avatar mfrachet avatar muckt avatar sevkioruc avatar smvilar avatar zairigimad avatar zapplebee avatar zecarrera avatar

Stargazers

 avatar  avatar  avatar  avatar  avatar  avatar  avatar  avatar  avatar  avatar  avatar  avatar  avatar  avatar  avatar  avatar  avatar  avatar  avatar  avatar  avatar  avatar  avatar  avatar  avatar  avatar  avatar  avatar  avatar  avatar  avatar  avatar  avatar  avatar  avatar  avatar  avatar  avatar  avatar  avatar  avatar  avatar  avatar  avatar  avatar  avatar  avatar  avatar  avatar  avatar  avatar  avatar  avatar  avatar  avatar  avatar  avatar  avatar  avatar  avatar  avatar  avatar  avatar  avatar  avatar  avatar  avatar  avatar  avatar  avatar  avatar  avatar  avatar  avatar  avatar  avatar  avatar  avatar  avatar  avatar  avatar  avatar  avatar  avatar  avatar  avatar  avatar  avatar  avatar  avatar  avatar  avatar  avatar  avatar  avatar  avatar  avatar  avatar  avatar  avatar

Watchers

 avatar  avatar  avatar  avatar  avatar

cypress-audit's Issues

Is there a way to add configuration in Cypress.json ?

Hello,

I see we can add threshold in the cypress.json in below way

"lighthouse": {
"performance": 85,
"accessibility": 80,
"best-practices": 85,
"seo": 85,
"pwa": 50
}

But is there a way that I can add configuration too in cypress.json rather than test level? like below
{"formFactor":"desktop",
"screenEmulation": {
"width": 1350,
"height": 940,
"deviceScaleRatio": 1,
"mobile": false,
"disable": false
}}

Thanks for the help

Showing HTTP/1.1 in the report while running with Cypress

Before creating an issue, make sure to have setup the projects with the 3 steps provided in the README. You can also verify the examples folder and check if there is already an application using a similar setup to yours.

What does not work?
A clear and concise description of what the bug is.

I have a very simple test here running against Google website.

it('test', () => {
    cy.visit('https://www.google.com')
    cy.lighthouse(
        {
            performance: 60,
            accessibility: 90,
            'best-practices': 80,
            seo: 80,
        },
        {
            formFactor: 'desktop',
            screenEmulation: {
                mobile: false,
                disable: false,
                width: 1350,
                height: 940,
                deviceScaleRatio: 1,
            },
            output: "html",
            throttling: {
                rttMs: 40,
                throughputKbps: 11024,
                cpuSlowdownMultiplier: 1,
                requestLatencyMs: 0,
                downloadThroughputKbps: 0,
                uploadThroughputKbps: 0,
            },
            throttlingMethod: "simulate",
        },
    )
});

However, the report presented this saying the use of HTTP/1.1 while Cypress opened the new browser tab.

Screen Shot 2565-04-25 at 13 39 18

How to reproduce?
Steps to reproduce the behavior. A Github repository reproducing the error is very welcome.

As mentioned above by running Cypress Open Runner or Cypress headless

Expected behavior
A clear and concise description of what you expected to happen.

The report should show the HTTP/2 instead of HTTP/1.1

Screenshots / Animated Gifs
Add screenshots or screen recordings to help explain your problem.

Environment (please complete the following information):

  • OS: Mac M1 Pro
  • Chrome version: 100
  • Cypress version: 8.5.0

Any other information that may help fixing the issue?
Add any other context about the problem here.

I am not really sure if this is the bug. However, I tried to look at many threads but I can't figure out this.

Cypress Audit Plugin showing incorrect page performance metrics

Prerequistes:
"cypress": "8.7.0",
"cypress-audit": "^1.1.0"

We are seeing obscure/strange page performance metrics within our company internal webpages using the \cypress-audit plugin with Cypress.

We recently did a POC with Puppeteer & the experience is fine. This looks to be an issue with the Cypress Runner.

STR:

  1. Install Cypress & audit plugin with versions above
  2. Run a performance on the "BBC.com" homepage
  3. Run the same performance on the Google Chrome Browser using the Lighthouse extension.

ACTUAL:
Cypress-audit plugin metrics are very much incorrect, bloated. View the FCP & LCP numbers in the screengrabs below

EXPECTED:
I would expect the same (if not similar) metrics to the experience on the Google Chrome Browser

audit3
audit2
audit1

Save pa11y results

Cypress 9.4.1
cypress-audit 1.1.0

Tell me how to save the test results in the log? I am trying to do like this:

it('Pa11y валидация', () => {
        cy.viewport(1920, 1080)
        cy.visit(pageUrl)
        cy.reload(true)
        cy.pa11y(pageUrl, {
            "threshold": 9999
        }).then((results) => {
                let pa11yLog = JSON.stringify(results)
                cy.writeFile('cypress/pa11y/'+fileName+'pa11y-report.json', pa11yLog)
            });
        cy.log(
            `[${pageUrl}] Pa11y валидация - Done`
        );
    })

Cypress-audit 3.0.0 Nx Typescript - Headless Mode Issue

@mfrachet thought this might be useful to those hoping to use cypress-audit with an nx repo. Also I am having some issues with headless mode.

Steps

  1. Install Nx - The below uses Angular & I set my sample app name to 'todos'
  2. Install cypress-audit
npm install cypress-audit --save-dev
  1. Adjust apps\todos-e2e\src\plugins\index.js
const { preprocessTypescript } = require('@nrwl/cypress/plugins/preprocessor');
const { lighthouse, pa11y, prepareAudit } = require("cypress-audit");

module.exports = (on, config) => {
  on("before:browser:launch", (browser = {}, launchOptions) => {
    prepareAudit(launchOptions);
  });

  on("task", {
    lighthouse: lighthouse(), // calling the function is important
    pa11y: pa11y(), // calling the function is important
  });
  on('file:preprocessor', preprocessTypescript(config));
};
  1. Add import to 'apps\todos-e2e\src\support'
// Import commands.js using ES2015 syntax:
import './commands';
import 'cypress-audit/commands';
  1. Add to 'apps\todos-e2e\src\support\commands.ts'
declare namespace Cypress {
  interface Chainable<Subject> {
    login(email: string, password: string): void;
    lighthouse(...arg: any): any;
    pa11y(...arg: any): any;
  }
}
  1. Use in a test spec
describe('todos', () => {
  beforeEach(() => cy.visit('/'));

  it('should use cypress audit', () => {
    cy.lighthouse(
      {
        performance: 75,
        accessibility: 95,
        'best-practices': 93,
        seo: 90
      },
      {
        formFactor: 'desktop',
        screenEmulation: {
          mobile: false,
          width: 1920,
          height: 1080,
          deviceScaleFactor: 1,
          disabled: false,
        },
      });
    });

  it('should use pa11y audit', () => {
    cy.pa11y();
  })
});
  1. run the e2e tests - Fails correctly
ng e2e --watch
  1. run the e2e tests headless - Passes incorrectly
ng e2e

Any ideas for supporting typescript/angular?

Your project looks really cool. I have an angular app using cypress via the Nrwl.io setup, but I'm stuck running this. I did the installation as suggested then tried to workaround the absence of @types/cypress-audit by faking an index.d.ts declaration but when I run I still get


  src\support\index.ts

The error was:

Error: Webpack Compilation Error
E:/git/b2c/apps/appcheck-e2e/src/integration/app.spec.ts
ERROR in E:/git/b2c/apps/appcheck-e2e/src/integration/app.spec.ts(26,8):
TS2339: Property 'lighthouse' does not exist on type 'cy & EventEmitter'.

E:/git/b2c/apps/appcheck-e2e/src/integration/app.spec.ts
ERROR in E:/git/b2c/apps/appcheck-e2e/src/integration/app.spec.ts(27,8):
TS2339: Property 'pa11y' does not exist on type 'cy & EventEmitter'.

Any ideas?

Tim

How to run lighthouse tests on desktop viewport?

Hi! First of all, thank you so much for this plugin. Been playing around with it and it's really great 👍

I noticed though that when I invoke cy.lighthouse(), by default this runs the lighthouse test on mobile view. Please see attached image as reference

cy-lighthouse 2020-10-28 15_44_23

I tried passing in the lighthouse config but it didn't work

const thresholds = {
        "performance": 50,
        "accessibility": 80,
        "best-practices": 50,
        "seo": 60,
        "pwa": 50
    };
     
    const lighthouseConfig = {
      "ci": {
        "collect": {
          "settings": {
            "chromeFlags": '--no-sandbox',
            "emulatedFormFactor": 'desktop'
          }
        }
      }
    };

    cy.lighthouse(thresholds, lighthouseConfig);

Any pointers on how to do it on desktop would be appreciated :) thank you!

SessionStorage values not honored in new Lighthouse tab

What does not work?
Values in window.sessionStorage are not copied to the new tab when the Lighthouse audit is executed.

How to reproduce?

  1. Create a page (/myPage) that requires a specific value in window.sessionStorage in order to render its contents
  2. In the Cypress test, set the session storage value (i.e. window.sessionStorage.setItem("my_item", "my_value")) so that the page can be rendered properly
  3. Visit the page within the Cypress test (cy.visit("/myPage"))
  4. Run Lighthouse on /myPage (cy.lighthouse())

For a runnable example, see https://github.com/olyhaa-aetna/simple-auth-example.

This repository has a sample app with two pages

  1. welcomePage - This page requires no authentication and has a login button. When the login button is clicked, a value is saved to the browser's sessionStorage and we are redirected to /secondPage.
  2. secondPage - This page requires "authentication" (a value stored in sessionStorage). If no such value is found, we will be redirected to welcomePage.

This repository has one Cypress test that will run Lighthouse on both of these two pages. Results are stored as html in cypress/test-results. To run the test, execute npm run cy:open and launch the test file.

Lighthouse is run for both pages, however, both the reports (found in cypress/test-results) are only showing results for the welcomePage. When the audit for secondPage is run, the new tab is redirected to welcomePage since no value is found in sessionStorage. The audit is then run agains welcomePage.

Expected behavior
I want to run Lighthouse on secondPage.

The Cypress test performs the necessary Cypress commands to "log in" the user (which will save a value to sessionStorage). We can see that the secondPage is rendered properly in the original tab of Cypress viewer. When the new tab is opened to perform the Lighthouse audit, I want to see this secondPage visible, and I want the Lighthouse report to reflect this secondPage URL.

Instead, when the new tab is opened, we see the welcomePage.

Environment:

  • OS: Mac
  • Chrome version: 96.0.4664.93
  • Cypress version: 9.1.1

Any other information that may help fixing the issue?
Two possible solutions (although I'm not sure how feasible they are):

  1. When a new tab is opened within Cypress, copy over any values in sessionStorage from the existing tab to the new tab.
  2. Provide a way to run commands in the new tab before the lighthouse audit is run.

Question: Significant difference in the speed-index score compared to the lighthouse command line utility

Hello,

first of all, thank you for the great plugin, we find it very useful for our project.
We added it to our synthetic monitoring tests written with Cypress; the tests are running against our production systems every 5 minutes and we're saving the speed-index score in Prometheus, so we have multiple data points to compare.
What we see is that the speed-index from the cypress-audit plugin is about significantly higher (1.5-2x in avg) of the score we get from the command-line utility (lighthouse 6.2.0) or the chrome devtools execution.
Our tests are running as cronjobs in Azure Kubernetes Cluster. What can be the reason for this difference in the score?

Thanks,
Adam

Threshold config option not working

HI there according to PA11y documentation when running in CI there a config to pass so builds dont fail .

Ive got the following in my cypress script but seems to do nothing . What I am after to to perform the accessibility scan generate the reports but not fail the test if the violations are within the threshold . Currently with this config set I have 9 violations and the tests are failing instead of passing.

cy.pa11y({
runners: ['axe'],
threshold: 10,
standard: 'WCAG2AA'
});

Please is there a way we can do this with PA11y integrated with cypress

lighthouse check is being skipped with command line

What does not work?
When running the cypress test command line, the test is skipped with the message 'Electron is not supported' and it stops as if the test is passed. But when I run the test with the cypress dashboard, the test fails as expected.
I don't know where to begin looking to fix this..

How to reproduce?
I only have a basic setup of cypress-audit:

plugin:

const { lighthouse, prepareAudit } = require("cypress-audit");
module.exports = (on, config) => {
  on("before:browser:launch", (browser = {}, launchOptions) => {
    prepareAudit(launchOptions);
  });
  on('task', {
    lighthouse: lighthouse((lighthouseReport) => { // calling the function is important
      console.log(lighthouseReport); // raw lighthouse reports
    }),
    log(message) {
      console.log(message)
      return null
    },
    table(message) {
      console.table(message)
      return null
    }
  })
}

integration:

it("should pass the audits", function () {
    cy.visit('/')
    const threshold = {
        "performance": 100,
        "accessibility": 100,
        "best-practices": 100,
        "seo": 100,
        "pwa": 100
    }
    cy.lighthouse(threshold);
});

and run this with npm cypress run

Expected behavior
I expect when I run the test via terminal/command line to have the same result as when it's run from the dashboard.

Screenshots / Animated Gifs
Screenshot from the video output of the command line test:
image

Screenshot from the test in the cypress dashboard:
image

Environment (please complete the following information):

  • OS: Windows
  • Chrome version: 89.0.4389.82
  • Cypress version: 5.2.0

Cypress 7.2.0 Upgrade, Import is Not a Module for cypress-audit

What does not work?
I have just upgraded Cypress for my automation project from 6.2.1 to 7.2.0, when I attempt to run the project with the command npm run cypress:open I get the error below. When I check my index.ts file in the plugin folder, my import from cypress-audit gives the error File 'C:/REPO/AutomationProject/node_modules/cypress-audit/index.d.ts' is not a module.

I have deleted node_modules and installed multiple times. My cypress-audit version in my package.json is [email protected]

Can someone please look into this to see what the problem is?

How to reproduce?

  • Upgrade to cypress 7.2.0
  • Use import { lighthouse, pa11y, prepareAudit } from 'cypress-audit' in the index.ts file in the plugins folder
  • You should get a similar error File 'c:/REPO/bp-rio-test-automation/node_modules/cypress-audit/index.d.ts' is not a module.

Expected behaviour
The import should be successful and not throw an error

Screenshots / Animated Gifs
one

two

Environment (please complete the following information):

  • OS: Windows 10
  • Chrome version: Version 90.0.4430.93 (Official Build) (64-bit)
  • Cypress version: 7.2.0
  • Cypress-audit version: 0.3.0

Lower performance when running lighthouse in cypress

What does not work?
Lower performance when running llighthouse with cypress. I have a frontend app build with single-spa, this tool uses multiple scripts that comes from cdn.jsdelivr.net. When i run lighthouse inside of cypress i have a lower performance caused by the external scripts acording to lighthouse but when i run the test with chrome everything it's ok, i tried in multiple machines with differente enviroments and it's the same. I want to know if this is an expected behavior or there's something i'm missing

How to reproduce?
clone https://github.com/dapinto8/cypress-test, run npm run cypress:open and then run the test lighthouse.spec.js.
This repo is just a next js default app and also experiences lower performance

Expected behavior
Having a better performance

Screenshots / Animated Gifs
Performance ruuning lighthouse in chrome
Screenshot from 2022-04-11 09-20-25
Performance ruuning lighthouse in cypress
Screenshot from 2022-04-11 09-16-33
Opportunitties when lighthouse in cypress
Screenshot from 2022-04-11 10-00-49

Environment (please complete the following information):

  • OS: Ubunut 20.04
  • Chrome version: 100.0.4896.60
  • Cypress version: 9.5.2

CypressError: `cy.task('lighthouse')` failed with the following error: > connect ECONNREFUSED ::1:60387

What does not work?
Trying to run examples/external-url locally I am getting a connection error.

How to reproduce?
Execute test in examples/external-url

Screenshots / Animated Gifs
Screenshot 2022-03-17 at 1 55 58 PM

Environment (please complete the following information):

  • OS: MacOS 12.2
  • Chrome version: 99
  • Cypress version: 9.5.2

Any other information that may help fixing the issue?
Read the comment here #62 but could not find a solution.

Browser variable has typescript error if config in plugins/index is typed.

Before creating an issue, make sure to have setup the projects with the 3 steps provided in the README. You can also verify the examples folder and check if there is already an application using a similar setup to yours.

What does not work?
If the config in the module.exports within plugins/index.ts is typed (appropriately as Cypress.PluginConfig, then TypeScript will give the following error:

Type '{}' is missing the following properties from type 'Browser': name, family, channel, displayName, and 5 more.

How to reproduce?

  1. Install TypeScript and Cypress (via npm install --save-dev typescript cypress)
  2. Configure your .tsconfig.json file to scan your Cypress files (most easily done by using "include": ["**/*.*"]
  3. Set up plugins/index.ts file as specified in README.
  4. Type on and config variables as Cypress.PluginEvents and Cypress.PluginConfigOptions, respectively
  5. If necessary, restart your TypeScript server and run tsc or npx tsc from your project's root

Expected behavior
browser variable is correctly typed (or rather, there is documentation on how to correctly type this variable)

Screenshots / Animated Gifs
Screen Shot 2021-11-03 at 12 37 15 PM
Screen Shot 2021-11-03 at 12 37 33 PM
image

Environment (please complete the following information):

  • OS: MacOS 11.6
  • Chrome version: 94
  • Cypress version: 8.6.0

Any other information that may help fixing the issue?
I understand that this library does not explicitly support TypeScript, but at the very least it shouldn't cause any TS errors when attempting to use it with TS. Really just any documentation on how to type out that browser object would probably solve the problem.
Additionally, type is not given for launchOptions. This can be resolved by just declaring an any type (sort of defeats the purpose of TS though 😂 ).
I tried setting browser = Cypress.browser but I receive an INVALID_URL error when running the test.

Any guidance would be greatly appreciated

Session not carried from cypress tab to new lighthouse tab

Using cypress to navigate though an app logging in or completing a form when a test hits cy.lighthouse a new tab is opened with a new session which causes the app to navigate back to the start page (due to security restrictions/anti forgery if a customer hits a page in the journey without a valid session they get sent to the "home page"), light house then runs against the home page rather than the required page, is there a way to run the audit against the page that cypress already has open?

Is the intended behaviour to open a new tab, if so what is the best way to handle session storage not being carried across to the new tab?

cy.task('lighthouse') failed with the following error: > connect ECONNREFUSED 127.0.0.1:61216

Hi, I did all the steps from readme and I am using plain JS but still I get the error like:

cy.task('lighthouse') failed with the following error:

> connect ECONNREFUSED 127.0.0.1:61216

chrome_Qr7t4JPgGn

my package.json:

    "cypress": "^6.3.0",
    "cypress-audit": "^0.3.0",
    "cypress-file-upload": "^4.1.1",
    "cypress-sql-server": "^1.0.0",

Maybe I am missing some necessary step.

I have

const { lighthouse, pa11y, prepareAudit } = require('cypress-audit');

and

on('before:browser:launch', (browser = {}, launchOptions) => {
    prepareAudit(launchOptions);
  });

and

lighthouse: lighthouse(), // calling the function is important
   pa11y: pa11y(), // calling the function is important

in my plugins/index.js

And I have imported audit in support/commands:

import 'cypress-audit/commands';

Headless mode

Is there any way to run this in headless mode?
What I want to achieve is logging the results on cy dashboard during cypress run.

Version 1.2.0 and 1.3.0 should be published in NPM

What does not work?

New versions are not published to NPM

How to reproduce?

View the latest tag in NPM.

Expected behavior

Version 1.2.0 and 1.3.0 should be published in NPM

Screenshots / Animated Gifs

image

Environment (please complete the following information):

  • OS: Mac OS 12.1
  • Chrome version: Version 100.0.4896.75 (Official Build) (arm64)
  • Cypress version: 8.7.0

Any other information that may help fixing the issue?
NA

Error : You probably have multiple tabs open to the same origin

Hi,
This issue probably has been raised before here but I couldn't find any concrete workaround to fix this. I'm encountering this issue as well when I tried to integrate my Cypress test with cypress-audit plugin.

I'm getting the following error when I tried to run my tests using Cypress test runner tool or running the test in headless mode.

Untitled

Here are the code snippet from the index.js file and my spec file

plugins/index.js

const del = require('del');
const fs = require('fs-extra');
const path = require('path');
const installLogsPrinter = require('cypress-terminal-report/src/installLogsPrinter');
const { lighthouse, pa11y, prepareAudit } = require('cypress-audit');

const getConfigurationByFile = (file) => {
  const pathToConfigFile = `config/cypress.${file}.json`;
  return !!file && fs.readJson(path.join(__dirname, '../', pathToConfigFile));
};

module.exports = (on, config) => {
  installLogsPrinter(on, {
    printLogsToConsole: 'onFail',
    collectTestLogs: () => console.log(''),
  });

  on('before:browser:launch', (browser = {}, launchOptions) => {
    prepareAudit(launchOptions);
    return launchOptions;
  });

  on('after:spec', (spec, results) => {
    if (results && results.video) {
      // Do we have failures for any retry attempts?
      const failures = results.tests.some((test) => {
        return test.attempts.some((t) => t.state === 'failed');
      });

      if (!failures) {
        // delete the video if the spec passed and no tests retried
        return del(results.video);
      }
    }
  });

  on('task', {
    lighthouse: lighthouse(),
    pa11y: pa11y(),
  });

  return getConfigurationByFile(config.env.platform) || config;
};

My Spec file

describe.only('Lighthouse', () => {
    it('should run performance audits', () => {
      cy.visit('/');
      cy.lighthouse();
    });
 });

I've also imported this line of code in my commands.ts file
import "cypress-audit/commands";

Cypress version : Tried both 7.7.0 and 6.9.1
Cypress-audit version : 1.0.0
Chrome version : 94
Mac OS Catalina 10.15.1

Generating light house report to json

Is it possible to save the lighthouse results in a JSON format? The raw report does not solve the case as there is too much information to look into.

Lighthouse error due to missing file

What does not work?
I'm attempting to add Lighthouse scores to our E2E job, however as soon as I add the file to our plugins, Cypress throws an error due to a missing file but I can't exactly figure out why this is happening.

**Message:** Your `pluginsFile` is invalid: `/Users/**/**/end_to_end/cypress/plugins/index.js`

It threw an error when required, check the stack trace below:

**Details:** Error: ENOENT: no such file or directory, open '/Users/**/**/end_to_end/node_modules/lighthouse/report/generator/../../flow-report/assets/standalone-flow-template.html'
    at Object.openSync (node:fs:585:3)
    at Object.readFileSync (node:fs:453:35)
    at Object.<anonymous> (/Users/**/**/end_to_end/node_modules/lighthouse/report/generator/flow-report-assets.js:11:33)
    at Module._compile (node:internal/modules/cjs/loader:1101:14)
    at Object.Module._extensions..js (node:internal/modules/cjs/loader:1153:10)
    at Module.load (node:internal/modules/cjs/loader:981:32)
    at Function.Module._load (node:internal/modules/cjs/loader:822:12)
    at Module.require (node:internal/modules/cjs/loader:1005:19)
    at require (node:internal/modules/cjs/helpers:102:18)
    at Object.<anonymous> (/Users/**/**/end_to_end/node_modules/lighthouse/report/generator/report-assets.js:10:26)
    at Module._compile (node:internal/modules/cjs/loader:1101:14)
    at Object.Module._extensions..js (node:internal/modules/cjs/loader:1153:10)
    at Module.load (node:internal/modules/cjs/loader:981:32)
    at Function.Module._load (node:internal/modules/cjs/loader:822:12)
    at Module.require (node:internal/modules/cjs/loader:1005:19)
    at require (node:internal/modules/cjs/helpers:102:18)

How to reproduce?
add const { lighthouse, prepareAudit } = require('@cypress-audit/lighthouse'); to /cypress/plugins/index.js and run Cypress.

Expected behavior
What is to be expected is that the project works without errors.

Screenshots / Animated Gifs
Screenshot 2022-05-30 at 15 16 20

Environment (please complete the following information):

  • OS: MacOS Monterey 12.3.1
  • Chrome version: 102
  • Cypress version: 9.5.2
  • @cypress-audit/lighthouse version: 1.3.0

Any other information that may help fixing the issue?
Add any other context about the problem here.

Get summary results (scores) inside a test

What would you like to see in the library?
Get summary results (scores) inside a test

Why?
I generate an html report file and see the result in the log. But I need data from the log inside the test to process it and send it to the database.

Any other information that may help understanding the need
Test:

it('Lighthouse: Desktop', function () {
            cy.viewport(1920, 1080).then(()=>{
                cy.visit(pageUrl).then(()=>{
                    const lighthouseScore = {
                        performance: 0,
                        accessibility: 0,
                        seo: 0,
                        'best-practices': 0,
                        pwa: 0,
                    }
                    const lighthouseConfig = {
                        extends: 'lighthouse:default',
                        formFactor: 'desktop',
                        screenEmulation: {disabled: true}
                    }
                    cy.lighthouse(lighthouseScore, lighthouseConfig).then(()=>{
                        cy.get(databaseResult).then(()=>{
                            databaseResult['lighthouse_report'] = 'cypress/lighthouse/'+fileName+'lighthouse-report.html'
                            cy.log(
                                'cypress/lighthouse/'+fileName+'log.txt'
                            )
                        }).then(()=>{
                            cy.log(
                                `Lighthouse:  report ready`
                            )
                        })
                    })
                })
            })
        })

Plugins:

module.exports = (on, config) => {
    function clearUrl(url){
        url = url.replace("https://", '');
        url = url.replace("http://", '');
        url = url.replace("www.", '');
        url = url.replaceAll("/", '_');
        return url;
    }
    const fileName = clearUrl(config.env.PAGE_URL)
    const lighthouseReportPath = config.projectRoot + '\\cypress\\lighthouse\\'+fileName+'lighthouse-report.html'
    const lighthouseLogPath = config.projectRoot + '\\cypress\\lighthouse\\'+fileName+'log.txt'

    /*cypress-audit*/
    on("before:browser:launch", (browser = {}, launchOptions) => {
        prepareAudit(launchOptions);
        if (browser.name === 'chrome' && browser.isHeadless) {
            launchOptions.args.push('--disable-gpu');
            return launchOptions;
        }
    });
    /*cypress-audit END*/
    on("task", {
        /*cypress-audit*/
        lighthouse: lighthouse((lighthouseReport) => {
            let lighthouseResult = JSON.stringify(lighthouseReport)
            fs.writeFileSync(lighthouseLogPath, lighthouseResult, 'utf-8')
            fs.writeFileSync(lighthouseReportPath, lighthouseReportGenerator.generateReport(lighthouseReport.lhr, 'html'))
            console.log(lighthouseReport)
        }),
        pa11y: pa11y((pa11yReport) => {
            console.log(pa11yReport)
        })
    });
    /*cypress-audit END*/`

fs.writeFileSync(lighthouseLogPath, lighthouseResult, 'utf-8') - I get a lot of megabytes .txt file in which there is a huge amount of data
fs.writeFileSync(lighthouseReportPath, lighthouseReportGenerator.generateReport(lighthouseReport.lhr, 'html')) - i get html report
console.log(lighthouseReport) - I get what I need, but only AFTER running all the tests in the log.txt, during the test I cannot get this data from the file
I need to get data from log.txt and add it in the test to databaseResult array

security vulnerabilities on xmldom package

npm audit reveals the following:
───────────────┬──────────────────────────────────────────────────────────────┐
│ Low │ Misinterpretation of malicious XML input │
├───────────────┼──────────────────────────────────────────────────────────────┤
│ Package │ xmldom │
├───────────────┼──────────────────────────────────────────────────────────────┤
│ Patched in │ >=0.5.0 │
├───────────────┼──────────────────────────────────────────────────────────────┤
│ Dependency of │ cypress-audit [dev] │
├───────────────┼──────────────────────────────────────────────────────────────┤
│ Path │ cypress-audit > lighthouse > jsonld > xmldom │
├───────────────┼──────────────────────────────────────────────────────────────┤
│ More info │ https://npmjs.com/advisories/1650

Cannot destructure property 'errors' of 'object null' as it is null,

Before creating an issue, make sure to have setup the projects with the 3 steps provided in the README. You can also verify the examples folder and check if there is already an application using a similar setup to yours.

What does not work?
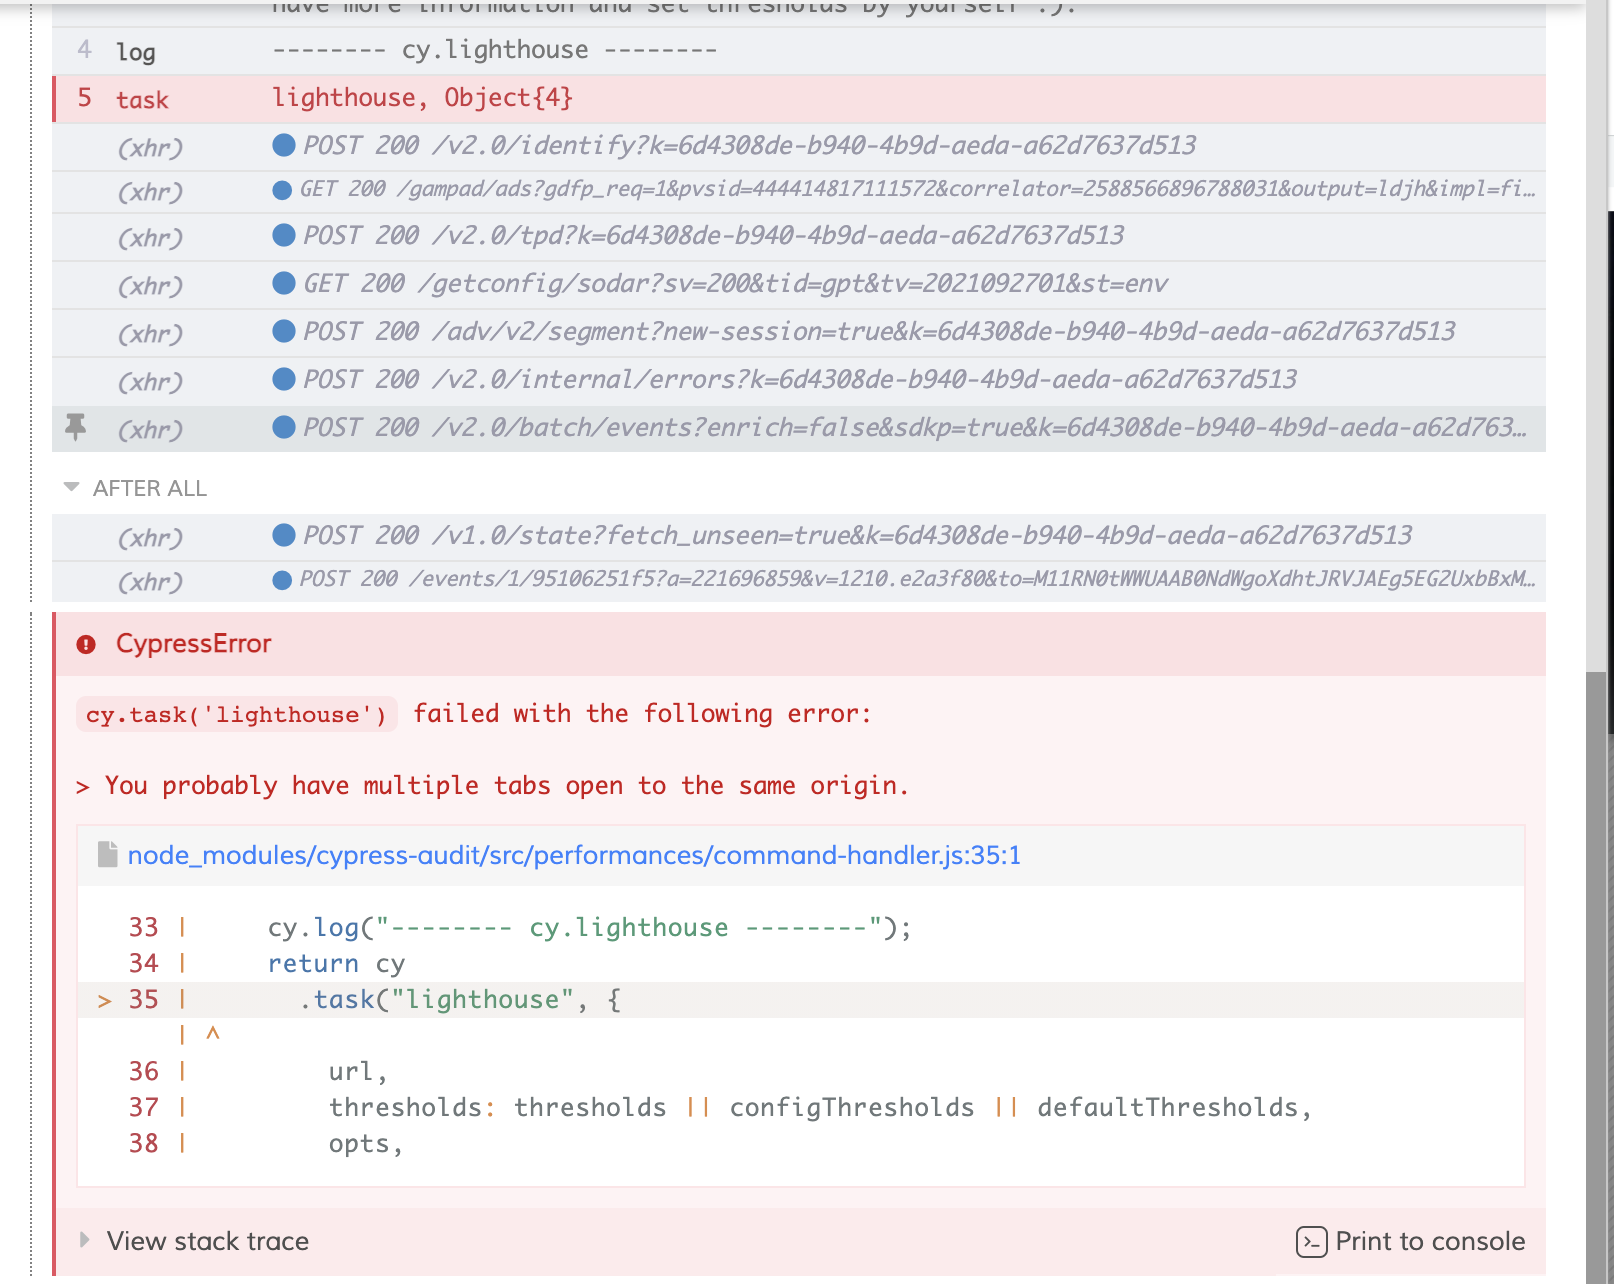
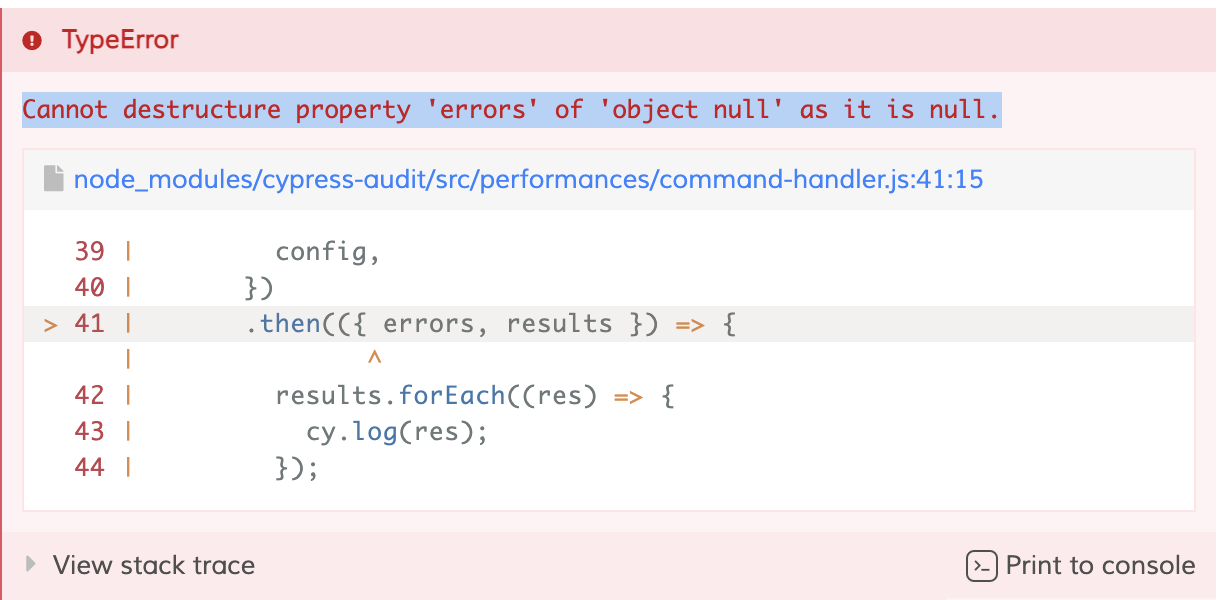
Report not able to be generated. Error being thrown is: "Cannot destructure property 'errors' of 'object null' as it is null," and it quotes line 41 at command-handler inside /src, where it reads: .then(({ errors, results })

How to reproduce?
Setting up a basic, essentially empty test, as follows.

describe("empty test", () =>  {
    const retryOptions = {retries: {runMode: 0, openMode: 0}}
    it('runs an empty test', retryOptions, () => {
        cy.visit(*any url*)
        cy.lighthouse()
    })
})

index has what it's supposed to:

  on('before:browser:launch', (browser, launchOptions) => {
    prepareAudit(launchOptions);
    return launchOptions
  })

inside of on.task:

    lighthouse: lighthouse(),  // calling the function is important
    pa11y: pa11y(), // calling the function is important

and in commands:
import "cypress-audit/commands";

Expected behavior
Audit will be generated

Environment (please complete the following information):

  • OS: Mac OsX 12.01
  • Chrome version: 95.0.4638.69
  • Cypress version: 8.6

Any other information that may help fixing the issue?
My inclination is that this is perhaps more a problem with cypress and the way it handles port assignment, or maybe another thing I bring up a bit further down, but I'm still creating this issue in case other people are running into the same when trying to incorporate cypress-audit for the first time. Also, this is the console.log of the lighthouse object. Seems relevant that config and opts are both undefined:

{
    "config": undefined
    "opts": undefined
    "url": "*any url*",
    "thresholds": {
        "performance": 100,
        "accessibility": 100,
        "best-practices": 100,
        "seo": 100,
        "pwa": 100
    }
}

My last bit of context is that 'before:browser:launch' doesn't seem to be running- console.log-ing it, at least, doesn't show anything. Again, this points to cypress being the problem, but I'm just curious if this has become an issue for anyone else.

3rd party authentication scenario: lighthouse runs for the landing/login page and not the app itself

What does not work?

We have a landing page -> 3rd party authentication (SiemensID wrapping auth0) -> the app.

We can use both UI login, or prog login. Prog login bypasses landing page and 3rd party authentication page by storing the token in session storage.

Landing page base url is the same as the app.

We login to the app, stabilize the URL. We start lighthouse. Lighthouse launches on a 2nd tab (perhaps expected). All evaluations are done against landing page instead of within the app.

In case we only run against the landing page ( we do not prog-login), the scores are the same. This proves lighthouse always runs against landing whether we are in the app or not.

How to reproduce?
Internal code, not able to share. Would be happy to have a Zoom meeting.

Expected behavior
Lighthouse executes for the application instead of the landing.

Screenshots / Animated Gifs
Video attached using cypress run --browser chrome. The video does not show the 2nd tab we see on Test Runner. The 2nd tab shows the landing page.

perf.spec.ts.mp4

Environment (please complete the following information):

  • OS: Windows
  • Chrome version: latest
  • Cypress version: 6.2.1

Any other information that may help fixing the issue?
Add any other context about the problem here.

Whether we prog-login or UI-login, the 2nd tab where the audit is done is not aware of the session context -where the authentication token is stored. This seems like the gist. Changing the base url to the exact app page we want to run does not make a difference; again the 2nd tab is unaware of the session context and evaluates landing page.

This is our simple test.

describe('Lighthouse audit ', () => {
  before(() => {
    cy.progLogin(Cypress.env('USERNAME'), Cypress.env('PASSWORD'));
    // we ensure we are in the appp
    cy.location('pathname').should('contain', '/sites');
  });

  const thresholds = {
    performance: 5,
    accessibility: 50,
    'best-practices': 50,
    seo: 50,
    pwa: 20
  };

  const desktopConfig = {
    formFactor: 'desktop',
    screenEmulation: { disabled: true }
  };

  it('should pass audit for empty site list', () => {
    cy.lighthouse(thresholds, desktopConfig);
  });
});

Error: You probably have multiple tabs open to the same origin.

cy.task('lighthouse') failed with the following error:
> You probably have multiple tabs open to the same origin.

node_modules/cypress-audit/src/performances/commands.js:34:1
  32 | 
  33 |     cy.log("-------- cy.lighthouse --------");
> 34 |     cy.task("lighthouse", {
     | ^
  35 |       url,
  36 |       thresholds: thresholds || configThresholds || defaultThresholds,
  37 |       opts,

cypress: 6.0.1
cypress-audit: 0.2.3
Repo: https://github.com/katawaredev/permisisve-nextjs-template
(note: some of the packages there are not available in npm, if you need to run it I'll tweak it)

Reproducing:

"scripts": {
    "prod": "run-s build start",
    "test:e2e": "start-test prod 3000 'TZ=UTC cypress run'",
    "e2e": "start-test prod 3000 'TZ=UTC cypress open'"
  },

Running test:e2e (headless mode) does not produce errors, but running e2e (UI) does

Is this possible to use cy.lighthouse() with a mocked api?

When triggering lighthouse in my test... my mocked apis defined in cypress seems completely ignored in favor of 404 errors. The report is generated but I can see in the tab opened for lighthouse that something is wrong since I see error popups. My "fake login information" in the session storage seems to be passed along the lighthouse tab tho.

Note that all my apis are mocked so any ideas on how to resolve this?

Lighthouse CI

I'd like to clarify because I couldn't find information about this in the documentation or other issues, it is not possible to use this plugin together with lighthouse-ci, right?

My use cases are:

  • run lighthouse multiple times to collect median values to decrease fluctuation
  • upload results to an lhci server

Cannot destructure property 'errors' of 'object null' as it is null

I am trying to run a very basic cypress audit test and seeing this issue Cannot destructure property 'errors' of 'object null' as it is null.

Screen Shot 2021-03-28 at 3 41 09 PM

spec file

describe("External", () => {
  it("check scores", () => {
    cy.visit("https://google.com/");

    cy.lighthouse({
      accessibility: 50,
      "best-practices": 50,
      seo: 50,
      pwa: 50,
    });
  });
});

chrome version - 89

cypress and cypress-audit version -

"cypress": "^6.4.0",
 "cypress-audit": "^0.3.0",

index.js file

const { lighthouse, pa11y, prepareAudit } = require("cypress-audit");

module.exports = (on, config) => {
  on("before:browser:launch", (browser = {}, launchOptions) => {
    prepareAudit(launchOptions);
    return launchOptions;
  });

  on("task", {
    lighthouse: lighthouse((lighthouseReport) => {
      console.log(lighthouseReport);
    }), // calling the function is important
  });
};

Will appreciate if you could share your thoughts on this. Thank you

An unexpected error while trying to run the tests

Before creating an issue, make sure to have setup the projects with the 3 steps provided in the README. You can also verify the examples folder and check if there is already an application using a similar setup to yours.

What does not work?
Error in runner when adding const { lighthouse, prepareAudit } = require("@cypress-audit/lighthouse");
to cypress/plugins/index.js

How to reproduce?

  1. add
    const { lighthouse, prepareAudit } = require("@cypress-audit/lighthouse");
    to
    cypress/plugins/index.js

  2. in terminal:
    npx cypress open

Expected behavior
Runner should show available test suites

Screenshots / Animated Gifs
Screen Shot 2022-04-20 at 5 42 17 PM

Environment (please complete the following information):

  • OS: MAC 12.3.1 (21E258)
  • Chrome version: 100.0.4896.127
  • Cypress version: 9.5.4
  • Node v16.13.0

Any other information that may help fixing the issue?
This could be related to Optional chaining, not sure how to fix it since Node v16 and I think it should support it

Support for cypress component testing?

I'm attempting to use audit to test out a11y and performance issues via cypress component testing, but as far as I can tell this currently isn't possible. With @cypress/react, instead of visiting a url you just mount a component which gets loaded into the browser. When trying to run cy.lighthouse on this mounted component, the blank page appears in the browser for about 10 seconds before all of the tests fail with 0 out of 100 results.
Is there anyway to have lighthouse run on these mounted components?

cypress-audit(lighthouse) not matching results of chrome lighthouse for performance

When running cypress-audit in a test as cy.lighthouse('www.google.com') the result related to performance is not matching the result of the lighthouse chrome plugin:
image

Lighthouse plugin result:
image

Test:
describe('using lightouse with cypress www.google.com', { taskTimeout: 120000 }, () => {

it('Should access www.google.com and perform lighthouse assessment', () => {
cy.visit('https://www.google.com')
cy.lighthouse({
performance: 1,
accessibility: 85,
'best-practices': 85,
//seo: 85,
//pwa: 30,
},
{
disableStorageReset: true ,
emulatedFormFactor: "desktop"
})
})
})

plugin implementation:
const { lighthouse, pa11y, prepareAudit } = require("cypress-audit");

module.exports = (on, config) => {
on("before:browser:launch", (browser = {}, launchOptions) => {
prepareAudit(launchOptions);
})

on("task", {
lighthouse: lighthouse((lighthouseReport) => {
console.log('LighthouseReport: '+lighthouseReport)
}), // calling the function is important
pa11y: pa11y((pa11yReport) => {
console.log(pa11yReport); // raw pa11y report
}), // calling the function is important
})
}

Recommend Projects

  • React photo React

    A declarative, efficient, and flexible JavaScript library for building user interfaces.

  • Vue.js photo Vue.js

    🖖 Vue.js is a progressive, incrementally-adoptable JavaScript framework for building UI on the web.

  • Typescript photo Typescript

    TypeScript is a superset of JavaScript that compiles to clean JavaScript output.

  • TensorFlow photo TensorFlow

    An Open Source Machine Learning Framework for Everyone

  • Django photo Django

    The Web framework for perfectionists with deadlines.

  • D3 photo D3

    Bring data to life with SVG, Canvas and HTML. 📊📈🎉

Recommend Topics

  • javascript

    JavaScript (JS) is a lightweight interpreted programming language with first-class functions.

  • web

    Some thing interesting about web. New door for the world.

  • server

    A server is a program made to process requests and deliver data to clients.

  • Machine learning

    Machine learning is a way of modeling and interpreting data that allows a piece of software to respond intelligently.

  • Game

    Some thing interesting about game, make everyone happy.

Recommend Org

  • Facebook photo Facebook

    We are working to build community through open source technology. NB: members must have two-factor auth.

  • Microsoft photo Microsoft

    Open source projects and samples from Microsoft.

  • Google photo Google

    Google ❤️ Open Source for everyone.

  • D3 photo D3

    Data-Driven Documents codes.