mermaidjs / mermaid-gitbook Goto Github PK
View Code? Open in Web Editor NEWDocumentation has been moved to docs in https://github.com/mermaid-js/mermaid
Home Page: https://mermaidjs.github.io
Documentation has been moved to docs in https://github.com/mermaid-js/mermaid
Home Page: https://mermaidjs.github.io


I came to this project from HN and couldn't figure out for the first minutes what is it doing. I would have appreciated the first page explaining "Welcome to Mermaid, a blah blah editor for blah supporting..."
Hello,
I'm one of the many people maintaining a mermaid plugin fork for "legacy" gitbook
It's something I'm invested in keeping working, but it's depressing that we're all doing this in parallel
Could mine or any of the other forks get copied into the mermaidjs org? I'll volunteer as a maintainer and open issues in the other actively maintained forks to join. Then we could publish one authoritative and community-maintained version to NPM and stop having to do all this parallel work
我在本地搭建了gitbook并通过book.json安装了mermaid,我在typora编辑,按照教程格式嵌入了mermaid图,gitbook serve后还是看不到渲染效果,不知道哪出问题,来请教下!!!
I noticed the "Sample Stylesheets" for the Gantt and Sequence Diagram pages are different on the gitbook site, but that the "Classes used" are the same. Does the section "Classes used" on https://mermaidjs.github.io/gantt.html need to be updated? I'm trying to style a Gantt diagram (fix margin issues on the rects, move elements, etc.), but have been unsuccessful so far.
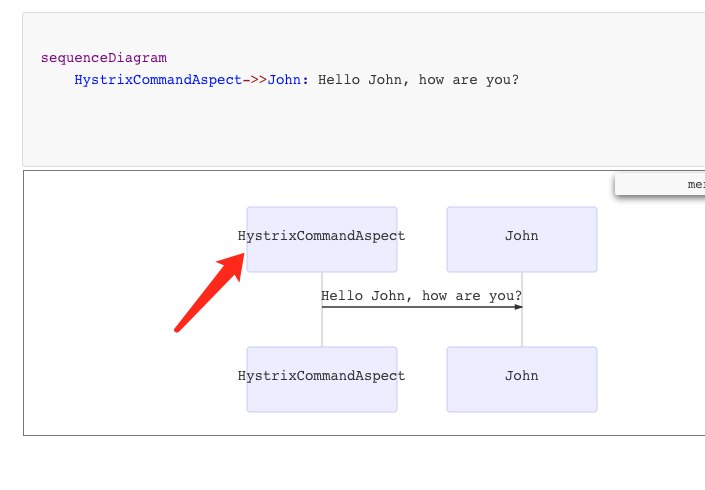
mermaid-js/mermaid#265 added support for aliasing sequence diagram participants. This isn't mentioned in the sequence diagram documentation. I'll make you a pull request this evening when I'm off work. :)
Example:
sequenceDiagram

participant a as alice
participant b as bob

a ->> b: hello
The documentation now lives at https://github.com/mermaid-js/mermaid/tree/develop/docs and does not use GitBook anymore (but Docsify).
To avoid confusion, I think we should archive this repository and make it clear that the documentation has moved.
Hello,
I have the next situation, i installed mermaid into angular proyect (typescript), work perfectyl, but, i have this error:


I tried to solve it, but I had no luck, could you help me?
Thank you!
It would be great to add a circular layout to the flowchart similar to visio. This could function as an easy way to create simple DFD's/Context Digrams.
Is anyone working on this?
I have the following "standard" HTML:
<!DOCTYPE html PUBLIC "-//W3C//DTD XHTML 1.0 Strict//EN" "http://www.w3.org/TR/xhtml1/DTD/xhtml1-strict.dtd">
<html xmlns="http://www.w3.org/1999/xhtml">
<head>
<meta http-equiv="Content-Type" content="text/html; charset=iso-8859-1" />
<title>My diagram</title>
<script src="https://cdn.jsdelivr.net/npm/mermaid/dist/mermaid.min.js"></script>
<script>mermaid.initialize({startOnLoad:true})</script>
</head>
<body>
<h2>My diagram</h2>
<div class="mermaid">
....
</div>
</body>
</html>
(mermaid markup removed for brevity)
When this page renders with my flow-chart (it's a biggy) then I see my h2 title "My diagram" and then have to scroll down a long way to see the top of the diagram.
If I look in the svg I see:
<svg id="mermaid-1624272648209" width="100%" xmlns="http://www.w3.org/2000/svg" xmlns:xlink="http://www.w3.org/1999/xlink" height="5647.30859375" style="max-width: 3097.140625px;" viewBox="0 0 3097.140625 5647.30859375">
If I manually change the height to be height="100%" (which matches the width) then this appears on the page as I would expect.
Is this a bug or desired behaviour? If desired, then is there a way I can instruct Mermaid that I want the height to be 100% for my webpage? Maybe using a directive?
Thanks
Actually you can perfectly use the gantt diagram to draw tasks on hours, minutes or even seconds base.
This could make mermaid a powerful tool to easily visualize time trackings (like visualize a taskwarrior database).
However the scale at the bottom still only prints the date.
It would be helpful if the dateFormat field would be evaluated for the date/time output aswell, or if you had another outputFormat field for that.
Mermaid does not display text in IE.
It would be nice if it was IE compatible.
I can't get the title directive to work for sequenceDiagram mode. Is this on purpose? Or a missing feature?
Hi!
Some lines of text are horizontally clipped, as you can see in the screenshots below.
This happens only at 100% page zoom. I was using Chrome 69.0.3497.81 (Official Build) (64-bit) on Windows 10 1709. It doesn't happen in Firefox 61.


hi, i am trying to use mermiad together with d3,
i include d3 and mermaid in the page head
if i include
is there a way to avoid that?
Hi Admins,
I made Mermaid.js macro plugin for Redmine.
Could you add it to Downstream project list?
Redmine plugin repository
https://www.redmine.org/plugins/redmine_mermaid_macro
GitHub repository
https://github.com/taikii/redmine_mermaid_macro
I having been successfully using mermaid on web browsers for some time now. However, I am now trying to use it within an android application. I am using ionic cordova 3 for the development. I initialise this code:
var config = {
startOnLoad:false,
cloneCssStyles:false,
leftMargin:0,
themeCSS:'.label {display:block; margin:0 auto; text-align:center;}\nlabel {color:#8f9321; display:block; font-weight:bold;}\nsection {font-weight:bold;}\n.output {font-size:3rem;}',
flowchart:{useMaxWidth:true, htmlLabels:true}
}
mermaid.initialize(config);
and render using this:
mermaid.render("routeGraph", this.careerInfo.route, (svgCode) => {this.svgCode = this._sanitizer.bypassSecurityTrustHtml(svgCode);});
When testing on the web browser using 'ionic serve' the resulting chart is excellent. However, when I move it to the android phone using 'ionic cordova run android' the nodes are scaled to the amount of text but the text is tiny and placed at the top of the node. Changing the size of the text makes no difference. I am attaching an image of a simple example.
x-special/nautilus-clipboard
copy
file:///home/peter/Pictures/Screenshot_2019-06-17-15-41-14-237_org.eluceo.ishine.png
Can you advise me on what I am doing wrong and how to improve on this.
Peter
In the second sentence of https://mermaidjs.github.io/#/, "wich" should be which. I make these typos a lot myself so can spot them out.
can we hide footer in mermaid? if can, please show how to do that.
thanks very much!
Like this,
graph TD
A[Christmas] -->|Get money| B(Go shopping)
B --o--> C{Let me think}
C -->|One| D[Laptop]
C -->|Two| E[iPhone]
C -->|Three| F[fa:fa-car Car]
Parse error on line 3:
...B(Go shopping)B --o--> C{Let me think}
----------------------^
Expecting 'DIR', 'DOWN', 'MINUS', 'TESTSTR', 'PIPE', 'NUM', 'COMMA', 'ALPHA', 'COLON', 'BRKT', 'DOT', 'PUNCTUATION', 'UNICODE_TEXT', 'PLUS', 'EQUALS', 'MULT', got 'ARROW_POINT'
It works if I use o
Hi,
I've noticed that upgrade script fails because it seems that recent versions of mermaidjs (from 7.0.8 to 7.1 by the moment) don't include .css in dist folder.
This page:
https://github.com/mermaidjs/mermaid-gitbook/blob/master/content/gantt.md
needs some love.
I'm just trying to figure out how to change the color of the boxes in the chart; seems like a basic thing a noob like me is going to want to do.
I have no idea what the boxes are called (are they tasks? notes?). The info about styling is strangely cut off mid-sentence:
"Styling of the a gantt diagram is done by defining a number of css classes. During rendering these classes are extracted from the"
"the" what though???
Is everyone ok over there? Did the writer die mid-sentence? C'mon don't just leave us hanging like this! Happy to help if I knew where those CSS classes could be found.
Thanks!
I am trying to find a decent solution to draw diagrams like showing how bits are stored in registers. Is this something supported in mermaid? Horizontal diagrams are the closest thing I can find, but it seems that nodes have to be connected by links. Thanks.
Example:
-------------------------------
|     more bits  |   0  |  1  |
-------------------------------
Any chance you could add a "graph-ee" mode so that flowchart works to make "Electrical Engineering System Diagrams"?
First what is needs is a way to hide the "Start" and "end blocks and only show the arrow.
Instead of:
graph LR;
Start-->|x|C/D;
C/D-->|y|D/C;
D/C-->|z|End;
Example Linkage line:
BLOCK_ID [BLOCK_LABEL] (BLOCK_ATTRIBUTE) --> |ARROW_LABEL| BLOCK_ID

BLOCK_ID is for connecting the nodes of your netlist together....
BLOCK_LABEL is for labelling the blocks.... optional... if not provided then BLOCK_LABEL = BLOCK_ID
BLOCK_ATTRIBUTE is for hiding the block and showing the arrow only...
Also, Embedded mathjax is allowed '(' and ')' and between '|' and '|". Example of what it looks like all together:
graph-ee LR;
NodeStart (Hide)                              -->|$X(j\Omega)$| Node1;
Node1 [C/D]                                     --> |$X(e^{j\omega}$|  Node2 ;
Node2 [System $H(e^{j\Omega)$]  --> Node3;
Node3 [D/C]                                    -->|$Y(j\Omega)$| NodeEnd (Hide);
Anyways... just trying to give you some ideals to make your mermaid tool useful to electrical and computer engineers... if you can build this type of system diagram and insert mathjax inside of the "block label" and "arrow label" using the
I think part of the problem with your current tree format is that you need to have the opinion to separate the node-id from the node-label so that users can write more complicated node labels that include mathjax in them.....
A declarative, efficient, and flexible JavaScript library for building user interfaces.
🖖 Vue.js is a progressive, incrementally-adoptable JavaScript framework for building UI on the web.
TypeScript is a superset of JavaScript that compiles to clean JavaScript output.
An Open Source Machine Learning Framework for Everyone
The Web framework for perfectionists with deadlines.
A PHP framework for web artisans
Bring data to life with SVG, Canvas and HTML. 📊📈🎉
JavaScript (JS) is a lightweight interpreted programming language with first-class functions.
Some thing interesting about web. New door for the world.
A server is a program made to process requests and deliver data to clients.
Machine learning is a way of modeling and interpreting data that allows a piece of software to respond intelligently.
Some thing interesting about visualization, use data art
Some thing interesting about game, make everyone happy.
We are working to build community through open source technology. NB: members must have two-factor auth.
Open source projects and samples from Microsoft.
Google ❤️ Open Source for everyone.
Alibaba Open Source for everyone
Data-Driven Documents codes.
China tencent open source team.