Student name: Marco Fijan
For the project Datavisualisation I have to create an interactive visualisation for a company. I have chosen for Ring Ring. Ring Ring is a company that specializes in bikingtrafic. Ring Ring wants to promote biking and does this with an app. People can use the app and track their route that they biked. I got the assignment to create an interactive visualisation that the stakeholders can use to visualize that data
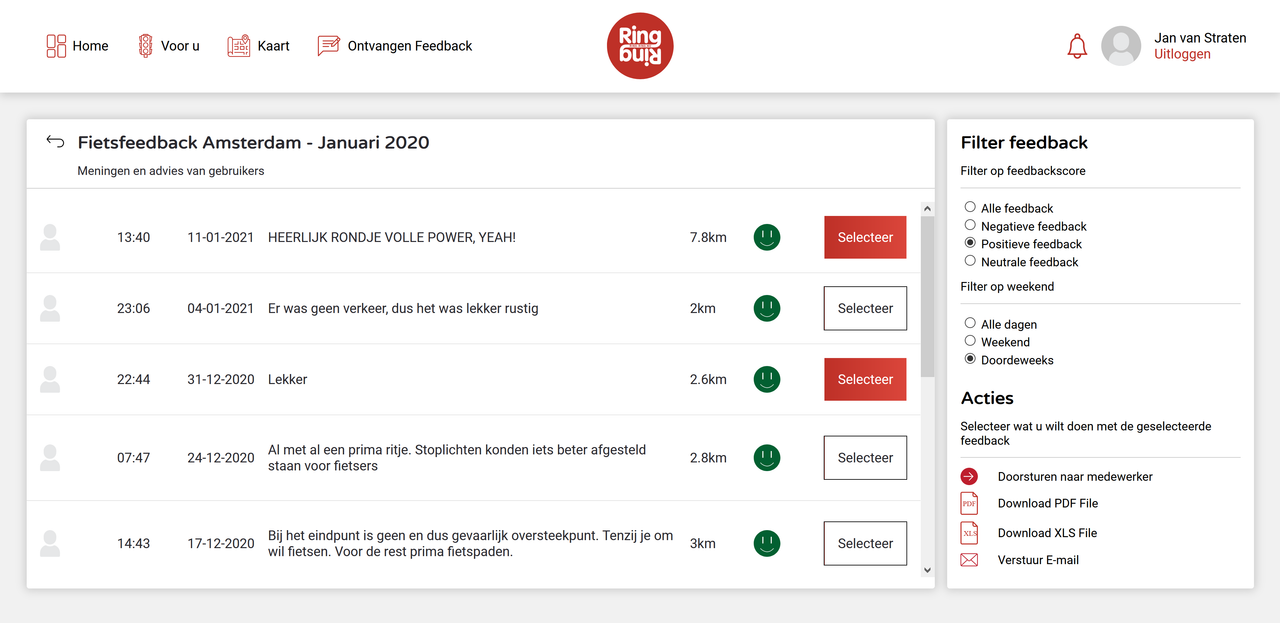
This project contains multiple datavisualisations made with mapbox, d3 and the geojson of Ring Ring. With the datavisualisations it is possible to create multiple insights. You can plot the routes on a map, and filter the bikeroutes per distance or timetype (hours or days). Besides the datavisualisations, this project also contains a page where you can read and filter the feedback given by the app users.
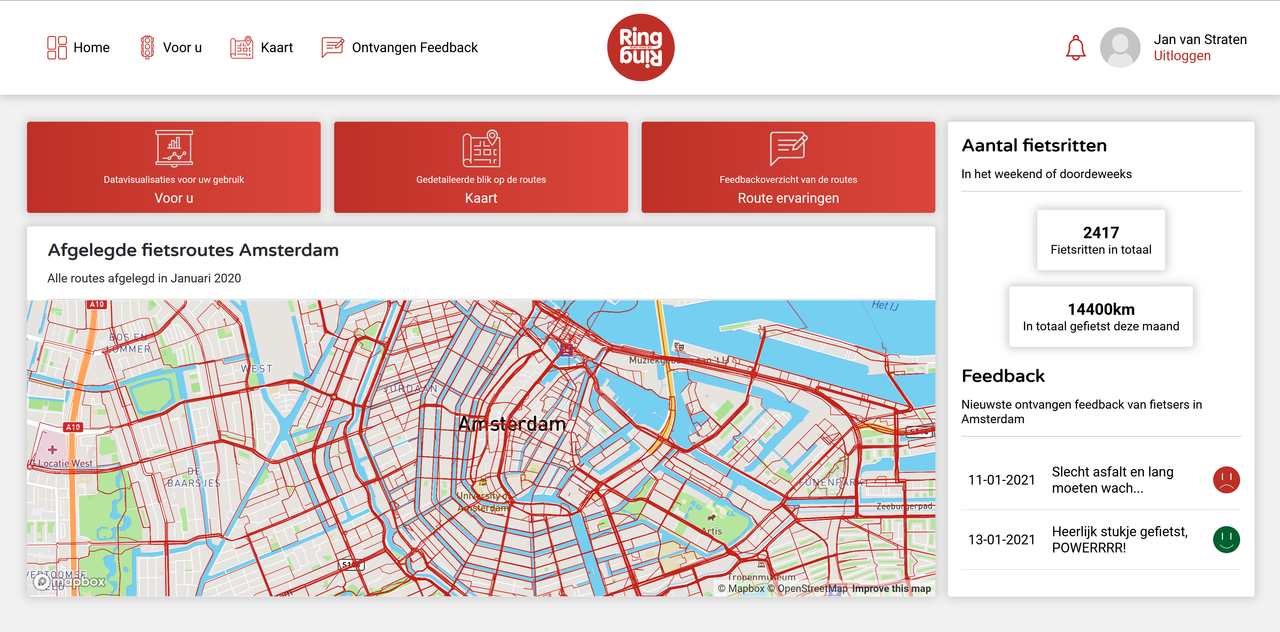
In this project I created a dashboard that stakeholders of Ring Ring can use to get insights from the data. The data can be viewed on a map with mapbox, in a stacked barchart made in d3, a piechart made in d3 and the feedback data can be viewed in a list.
For this project I have made several concepts with my visual teammates, Jean Paul Oppelaar and Tugce Tansel. If you want to take a look at the concepts, you can do so by navigating to my wiki.
For this project I used 2 geojsons from Ring Ring. The first one is a dataset wich contains different routes, distances, speed and time of Ring Ring app users in Amsterdam januari 2020. The datasets can be found here
The second geojson is a dataset that has been made with the data of the students during this project. I am using this dataset for the feedback since the other dataset doesn't have any feedback values. That dataset can be found here
As of now, this projects has the following features:
- A static website with multiple datavisualisations
- A map that visualizes all the bikeroutes of the Ring Ring users in Amsterdam Januari 2020
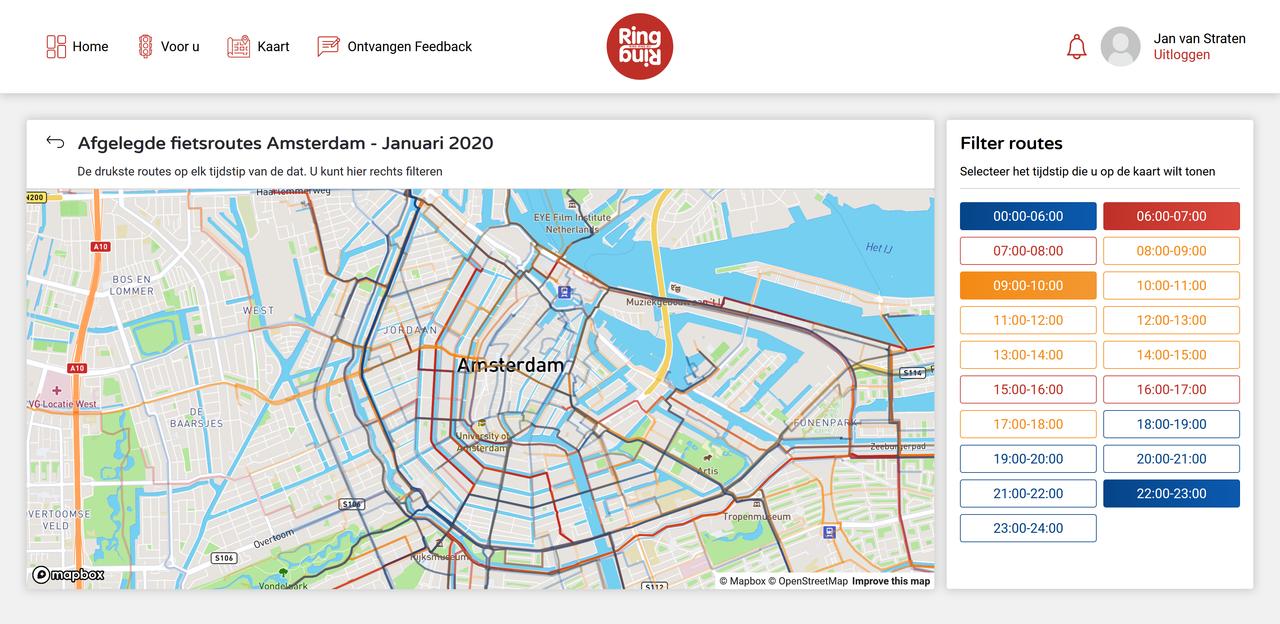
- A detailed map where you can specify which routes will be visible per hour
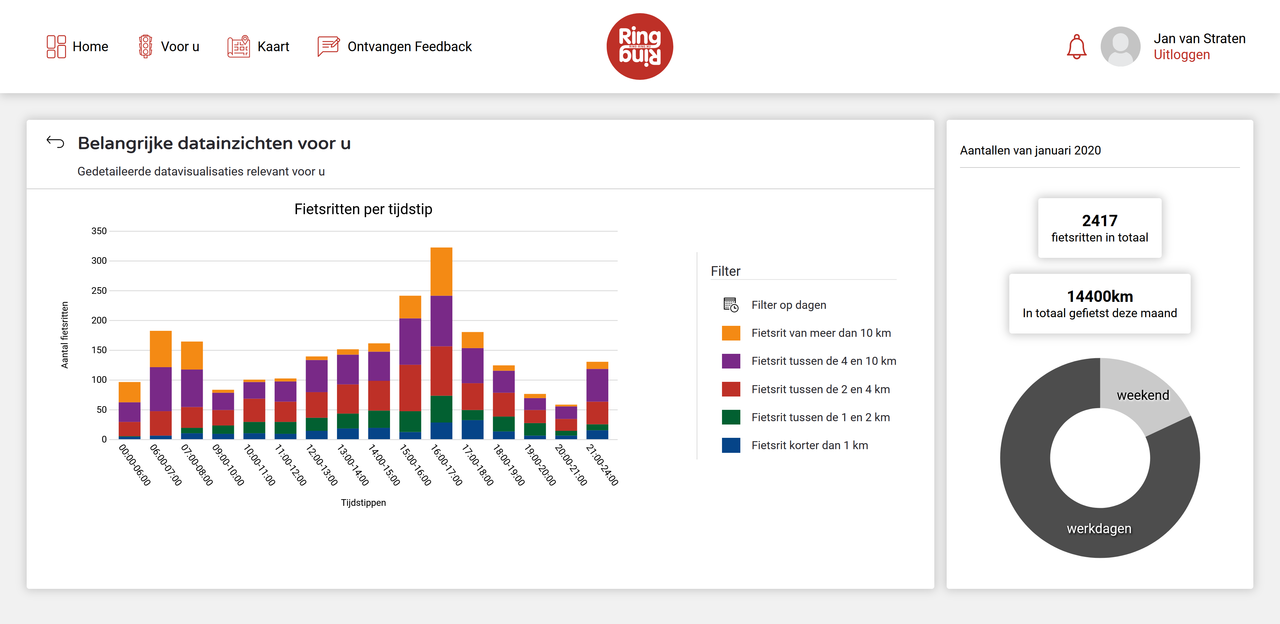
- A stacked bar chart where you can view the amount of bikeroutes per timestamp
- The stacked bar chart can be filtered and viewed with multiple distances
- Given feedback from users can be viewed in a list and filtered per daytype and feedbackscore
To run this project for yourself, you can clone the github repo to your local machine. Just follow these steps
Navigate with your terminal to the desired folder where you want to clone this repo
cd "c:/foldername1/foldername2/destination"
Optional Use this command to create a new folder where you want to clone this repo.
mkdir "foldername"
Optional Don't forget to navigate to that folder with using the cd command
Optional If you desire to make changes to this project run this command to make that possible
git init
To clone this project and receive it on your locale machine, use this command
git clone https://github.com/marcoFijan/projectDatavisualisation.git
After this command your computer will download the files automaticly
Navigate to the folder where you cloned the git repository and launch the index.html
That's it. You are all set up!
Navigate to the code on Github and press the 'code' button. After pressing the 'code' button select 'download as zip'
After downloading the files navigate to a folder of your choice and unzip the files from the zip folder to that folder.
Navigate to that folder where you put the files and launch the index.html
That's it. You are all set up!
- The Muratorium for explaining stack in d3
- Curan for the amazing explanation of D3
- Jean Paul Oppelaar
- Tugce Tansel
- Janine from Ring Ring - for giving the assignment
- Suze Swarte for coaching the project