Git Product home page Git Product logo

functional-programming's Introduction

Functional programming

Concept

This repo has 2 different projects: EnqueteData & RDWData.

EnqueteData

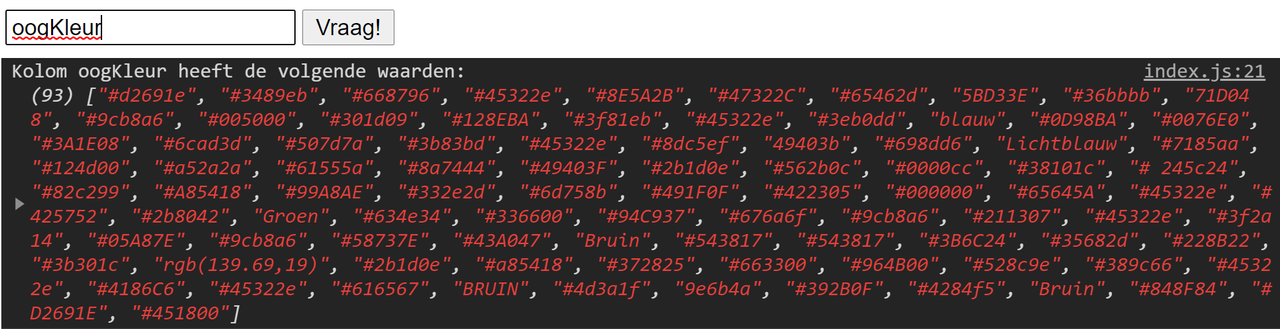
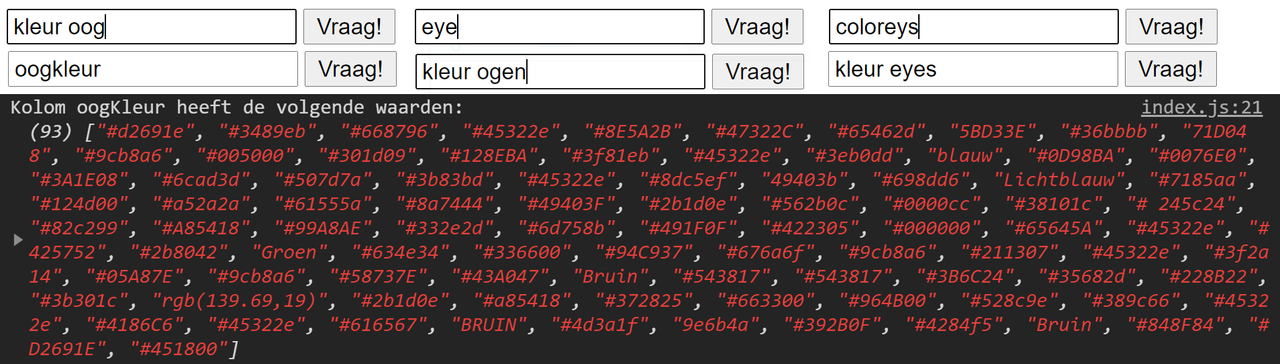
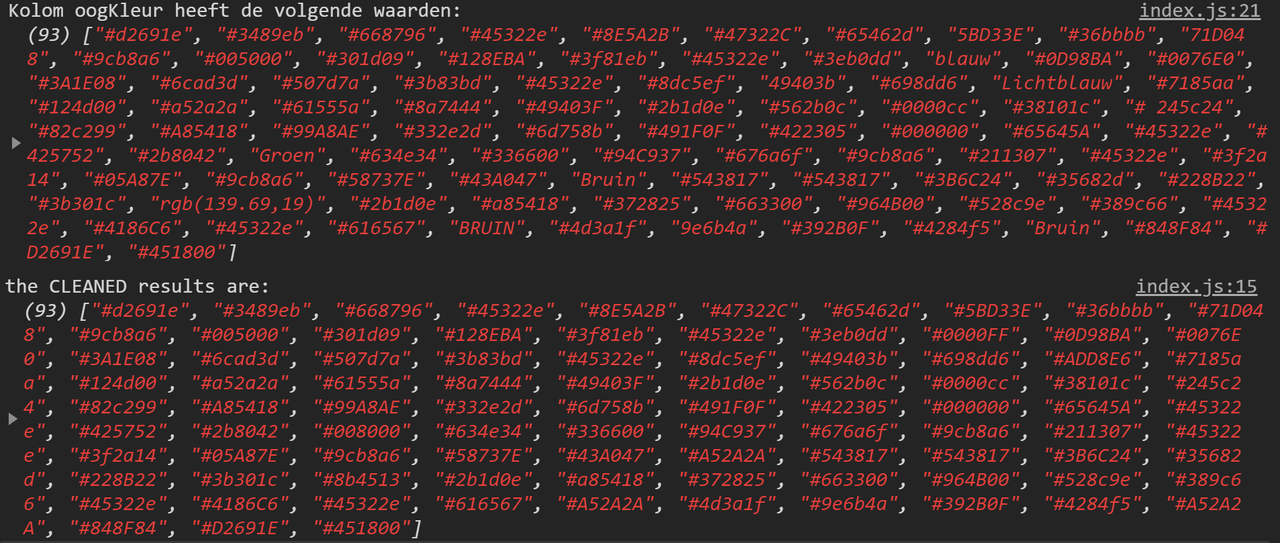
In EnqueteData I am writing a simple project where I gather the data from a dataset from a json file. The user can receive certain columns from the dataset by using the textbox on the HTMLpage. After the user typed his or her query, the program will then check if the user typed a valid input. If the input is valid, the program will try to 'clean' the data. Empty values, wrong format values and whitespaces will be fixed. If the program is unable to fix a certain value, the program will return a warning but continue with the other values. That way the user will still receive his or her preferred column. For more information about the development of this project, navigate to my wiki

RDWData

I am writing a simple project where I am practising with receiving data from an api. I'm using the same html and textinput from my previous project in this repo. I will try to collect specific columns and clean them. Besides that I will compare columns with eachother to find interesting data. For the data I will be using different api's from RDW. I want to find answers for my main question

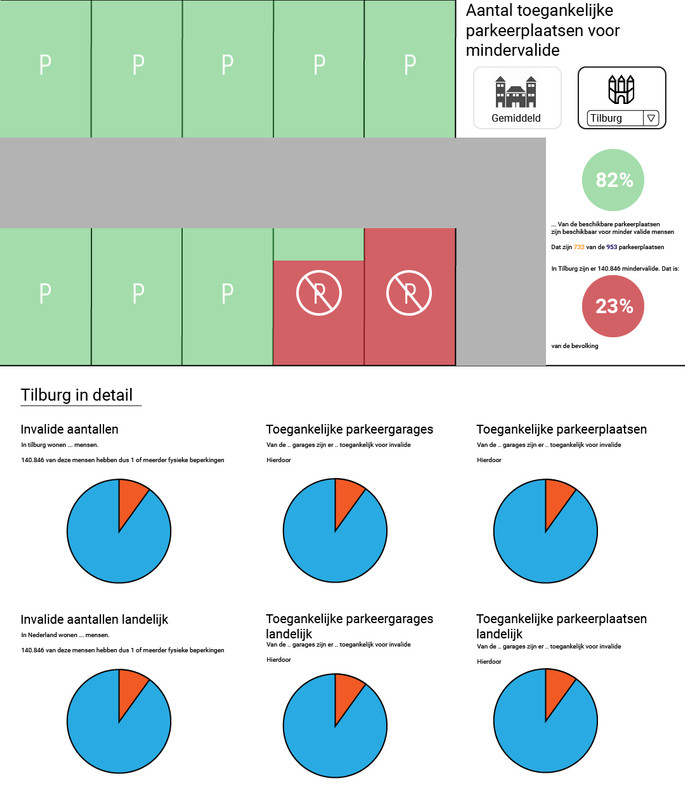
I'm planning to make an interactive parkingarea that will visualize per city how many parkingspots are availible for people with a phisical limitation

This was just the beginning of cleaning the RDW-data. Please navigate to my frontend data section in the repo.

Research Questions

According to the Central Bureau of Statistics of the Netherlands, a lot of citizenry have one or more phisical limitation. More then 13% has a phisical limitation. Still, according to the RDWDataset, most parkinggarages are not accessible for those citizenry. I want to research how many parkingspots are availible per province, and how many are required in percentage according to the numbers of the Central Bureau of Statistics.

To begin my research, I set up a series of questions:

Main Research Question:

Which province in the Netherlands is the best province to live for people with a phisical limitation when you look at the accessibility of parkingspots?

Supporting sub-Questions

  • What is the ratio of the overall capacity and availible parking spaces for people with a disability per province?
  • What is the ratio of the total number of parking garages and accessible parking garages for people with a disability per province?
  • What is the percentage of people with a physical disability per province?

Sketch of my concept

I want to visualize the accessibility with percentages of availible parking spaces. I want to use a parkingarea and color these according to their accessibility: Artboard-1-copy-5-100.jpg

Necessities

Before I can visualize my concept, I need to collect the data that I need:

Columns: AreaId, AreaManagerId, Capaciteit and DisabledAccess

With these columns I can receive the following data:

  • Capacity per parkinggarage
  • Accessibility of parkinggarage for disabled people

Columns: ParkingAdressReference, Province

With these columns I can receive the following data:

  • Province of parkinggarage

Columns: Filter: Leeftijd=Totaal, Provincie, Functiebeperking

With these columns I can receive the following data:

  • Percentage of people with a phisical limitation

For more information about my research, other research questions I asked myself and my assumpions, please visit my wiki

Features

EnqueteData

As of now, this project has the following features:

  • User can give input on which column he or she wants to see in the console 1.png
  • UserInput will be checked and converted to a valid input if possible 2.png
  • The column 'oogKleur' will be coverted and cleaned into usable data 3.png

RDWData

As of now, this project has the following features:

  • Project will make a connection to an api from RDW
  • User can give input on which column he or she wants to see in the console

Data used

EnqueteData

For this project I am using a dataset of an enquëte from Datavisualisatie 2. This dataset contains several interesting insights about CMD-students. This dataset has been created by Jan-Jaap Rijpkema and converted into json by Jonah Meijers. The data for this dataset has been collected in September from CMD-students who are in the beginning of their third year.

RDWData

Aw of now, the only data used in this project is one api from RDW with specific data of parkingarea's (capacity, maximum height, maximum weight etc...) RDWData: Parking Specifications API

How to install and use

OPTION 1: Cloning git

To try this project for yourself, you can clone the github repo to your locale machine. Just follow these steps

STEP 1: Create your local git repository

Navigate with your terminal to the desired folder where you want to clone this repo

cd "c:/foldername1/foldername2/destination"

Optional Use this command to create a new folder where you want to clone this repo.

mkdir "foldername"

Optional Don't forget to navigate to that folder with using the cd command

Optional If you desire to make changes to this project run this command to make that possible

git init

STEP 2: git clone

To clone this project and receive it on your locale machine, use this command

git clone https://github.com/marcoFijan/functional-programming.git

After this command your computer will download the files automaticly

STEP 3: Launching

Navigate to the folder where you cloned the git repository and launch the index.html

STEP 4: Open console

To see your results, you need to look in the console Right-click on the webpage and click 'inspect' or 'inspect element' Then, click on the tab called 'console'

That's it. You are all set up!

OPTION 1: Download manually

STEP 1: Download the files

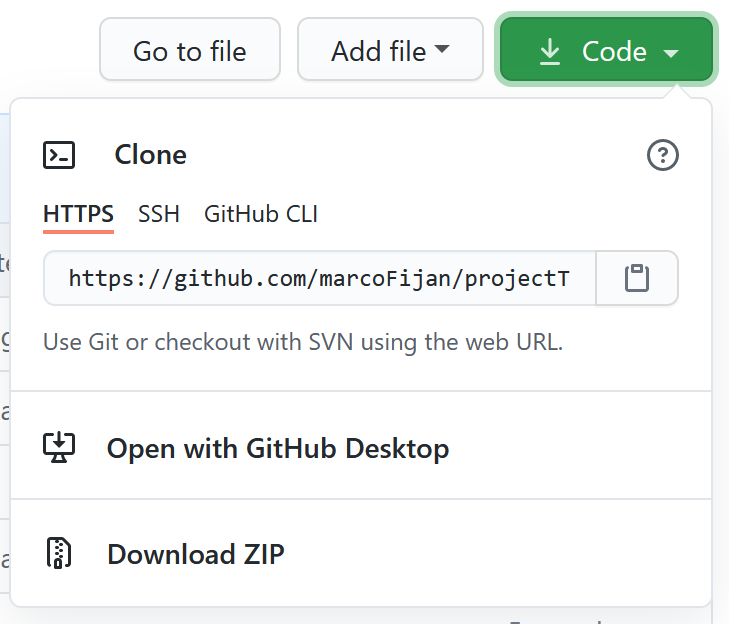
Navigate to the code on Github and press the 'code' button. After pressing the 'code' button select 'download as zip' afbeelding.png

STEP 2: Unzipping

After downloading the files navigate to a folder of your choice and copy the files from the zip folder to that folder.

STEP 3: Launching

Navigate to that folder where you put the files and launch the index.html

STEP 4: Open console

To see your results, you need to look in the console Right-click on the webpage and click 'inspect' or 'inspect element' Then, click on the tab called 'console'

That's it. You are all set up!

Live Deploy Link

To just try the project without the downloading hastle navigate to the live deploy

Credits and License

  • Jan-Jaap Rijpkema for collecting the dataset
  • Jonah Meijers for converting the dataset to .json
  • stackoverflow for multiple difficult code (see index.js for the sources)
  • Laurens Aarnoudse for the live code demo's and explaining functional programming
  • Chelsea Doeleman for tips on how to make better functional programming functions

functional-programming's People

Contributors

marcofijan avatar

Watchers

 avatar Randy avatar

functional-programming's Issues

Feedback repo

Feedback repo / readme

Pro's

  • Goed om te zien dat je gebruikt maakt van een .gitignore file

Tips

  1. Een description toevoegen van je Repo
  2. Je begint je readme goed met het vertellen over je concept. Maar er staan nog wel wat onduidelijkheden in. Bijvoorbeeld:

I'm using the same html and textinput from my previous project in this repo.
Wat is je vorige project dan precies, en waarom gebruik je daarvoor een HTML en text-input?

  1. Misschien kan je een korte weergave doen van de data die binnen komt? Hoe ziet zo'n data object eruit?
  2. En dan aanvullend op punt 3, wat doe je met deze data? Welke data gebruik je, en hoe?
  3. Ik zie dat je al wel wat credits geeft, maar ik mis nog een beetje je specifieke resources.

Feedback onderzoeksvragen (nog van gister)

Pro's

  • Leuk om je intro te lezen, nu kom ik gelijk in het verhaal wat je wil gaan vertellen met je Data. Goed gedaan!
  • Ik denk dat je ook een goede vergelijking trekst met het aantal disabled mensen versus het aantal plekken

Tips

  • Je heb veel onderbouwende vragen, zou je dit niet meer specificeren tot 1-3 specifieke subvragen?
  • Ik zie ook een aantal vragen waar ik me af vraag hoe je die gaat beantwoorden met de RDW datasets (bijv onderbouwende vraag 1).
  • Heb je nog rond gekeken of er meer data is over dit onderwerp? Is er bijvoorbeeld iets van data te vinden over het aantal vergunningen die zijn/of worden uitgegeven voor invalide plekken?

Feedback Wiki

Pro's

  • Veel informatie al in je Wiki
  • Mooi en goed onderzoek van de beschikbare data voorafgaand.

Tips

  • Van je onderzoek over de beschikbare data, zou ik het best wel interessant vinden als je aangeeft welke inzichten je uiteindelijk tot je onderzoeksvraag hebben gebracht.
  • Opschonen van data is heel uitgebreid. Misschien kan je hier bovenaan een inhoudsopgave toevoegen met een korte opsomming en links van welke functies je hebt gebruikt. Bijvoorbeeld zo:

Hashtag check

  • Ik vind het zelf altijd super fijn om een goede overzichtelijke structuur aan te bieden in de side-menu van de wiki. En ik denk dat je daar nog net even een stap extra in zou kunnen maken.

Code

Pro's

  • Je maakt heel goed gebruik van code comments
  • Ik zie dat je verschillende data cleaning processen in een functie nest, dat is best wel netjes!
  • De charAt functie vond ik heel goed gevonden! Die heb ik uiteindelijk ook in mijn code gebruikt dankzij jouw.

Tips

  • Waarom gebruik je een user input?
  • Ik wil ook wel even benoemen dat ik het wel lastiger lezen vind dat je al die data cleaning functies weer in een andere functie heb gezet. Er zit dus een beetje een voor en een tegen aan..

Rubric

Application of subject matter

Ik denk dat je heel goed op weg bent met het opschonen van data kolommen. En ik zie dat je nog niet echt bezig bent geweest met D3 en transformeren. Dat komt nog, snap ik, want ik ben daar ook nog niet aan toegekomen! Maar so far so good!

Understanding

Ik zie dat je hier ook al heel ver mee bent. Ik snap het meeste gedeelte van je code goed, ook dankzij je code comments. Er zijn nog wel wat kleine dingen waar ik een beetje aan twijfel maar die heb ik je aangegeven onder het kopje code.

Quality

Ja eigenlijk een beetje hetzelfde als hierboven zonder enige vorm van jouw eigen toelichting natuurlijk. Je code ziet er goed uit, en je geeft duidelijke code comments. Het enige wat ik nog kan bedenken is waar Laurens het vaak over heeft, de belangrijke dingen boven aan om zo snel te snappen wat je aan het doen bent. Dat vond ik zelf een beetje lastig omdat je alles al in functies zelf heb staan. Maar ik weet niet of dat mijn lack-of-experience is :)

Process

Ja een goed begin! Ik zou iets meer structuur in je wiki brengen en misschien even extra uitbelichten welke bevindingen je tot welke keuzes hebben gebracht. En mogelijk iets van een visual over hoe jij denkt dat je visualisatie eruit gaat zien.

Feedback onderzoeksvraag

Je hebt al een heleboel heel duidelijk gedocumenteerd. Het ziet er al redelijk compleet uit! Goed dat je meerdere invalshoeken omschrijft en tof dat je al een dataset hebt gevonden die je kan combineren met de RDW data.

Je moet denk ik wel oppassen dat je niet gewoon een navigatie en filter mapje maakt van alle parkeergelegenheden door Nederland. Ik denk dat het heel tof is om er juist nog een laag overheen te leggen welke stad dan bijvoorbeeld het meest invalide vriendelijk is. Of wat voor soort parkeergelegenheid het meest invalide vriendelijk is. Op deze manier vertel je echt meer een verhaal met je visualisatie waarmee een journalist van de Volkskrant op door kan broeden. Ik heb het idee dat je hoofdvragen nu nog een beetje oppervlakkig zijn zonder een spannende laag die iets ergens drastisch een "verschil" in kunnen gaan laten zien.

Verder echt super goede documentatie, hele duidelijke structuur, echt goed te volgen! Denk ook dat het een heel boeiend onderwerp is waar je veel leuke inzichten uit kan halen.
Denk dus alleen dat het formuleren van je onderzoeksvragen nog spannender zou kunnen. Een leuke lijkt mij bijvoorbeeld: "Waar in Nederland kunnen invaliden het best gaan wonen om het minst problemen te hebben het bezoeken van de binnenstad?" noem maar wat ;)

Lekker bezig man! Je hebt er duidelijk al kei goed over na gedacht! Weinig op aan te merken!🤙🤙

Feedback op hoofdvraag/deelvragen

Hey Marco,

Je hebt wel een hele moeilijke vraag uitgekozen! Als ik zelf snel een optelsom moet maken komt er ontzettend veel data bij kijken wat zou kunnen voldoen aan de criteria. Je zou nog wel over invalide kunnen hebben maar maak het denk iets kleinschaliger. (Or prove me wrong)

Recommend Projects

  • React photo React

    A declarative, efficient, and flexible JavaScript library for building user interfaces.

  • Vue.js photo Vue.js

    🖖 Vue.js is a progressive, incrementally-adoptable JavaScript framework for building UI on the web.

  • Typescript photo Typescript

    TypeScript is a superset of JavaScript that compiles to clean JavaScript output.

  • TensorFlow photo TensorFlow

    An Open Source Machine Learning Framework for Everyone

  • Django photo Django

    The Web framework for perfectionists with deadlines.

  • D3 photo D3

    Bring data to life with SVG, Canvas and HTML. 📊📈🎉

Recommend Topics

  • javascript

    JavaScript (JS) is a lightweight interpreted programming language with first-class functions.

  • web

    Some thing interesting about web. New door for the world.

  • server

    A server is a program made to process requests and deliver data to clients.

  • Machine learning

    Machine learning is a way of modeling and interpreting data that allows a piece of software to respond intelligently.

  • Game

    Some thing interesting about game, make everyone happy.

Recommend Org

  • Facebook photo Facebook

    We are working to build community through open source technology. NB: members must have two-factor auth.

  • Microsoft photo Microsoft

    Open source projects and samples from Microsoft.

  • Google photo Google

    Google ❤️ Open Source for everyone.

  • D3 photo D3

    Data-Driven Documents codes.