Git Product home page Git Product logo

mahendrapaipuri / ceems Goto Github PK

View Code? Open in Web Editor NEW
10.0 2.0 0.0 7.69 MB

A Prometheus exporter and a REST API server to export metrics of compute units of resource managers like SLURM, Openstack, k8s, _etc_

Home Page: https://mahendrapaipuri.github.io/ceems/

License: GNU General Public License v3.0

Makefile 1.36% Go 90.52% Shell 6.59% Dockerfile 0.10% JavaScript 0.01% TypeScript 1.23% CSS 0.19%
batch grafana monitoring prometheus prometheus-exporter slurm dashboards emissions hpc json-api

ceems's Introduction

Compute Energy & Emissions Monitoring Stack (CEEMS)

CI/CD ci CircleCI Coverage
Docs docs
Package Release
Meta GitHub License Go Report Card code style

Compute Energy & Emissions Monitoring Stack (CEEMS) (pronounced as kiːms) contains a Prometheus exporter to export metrics of compute instance units and a REST API server that serves the metadata and aggregated metrics of each compute unit. Optionally, it includes a TSDB load balancer that supports basic access control on TSDB so that one user cannot access metrics of another user.

"Compute Unit" in the current context has a wider scope. It can be a batch job in HPC, a VM in cloud, a pod in k8s, etc. The main objective of the repository is to quantify the energy consumed and estimate emissions by each "compute unit". The repository itself does not provide any frontend apps to show dashboards and it is meant to use along with Grafana and Prometheus to show statistics to users.

Install CEEMS

Warning

DO NOT USE pre-release versions as the API has changed quite a lot between the pre-release and stable versions.

Installation instructions of CEEMS components can be found in docs.

Visualizing metrics with Grafana

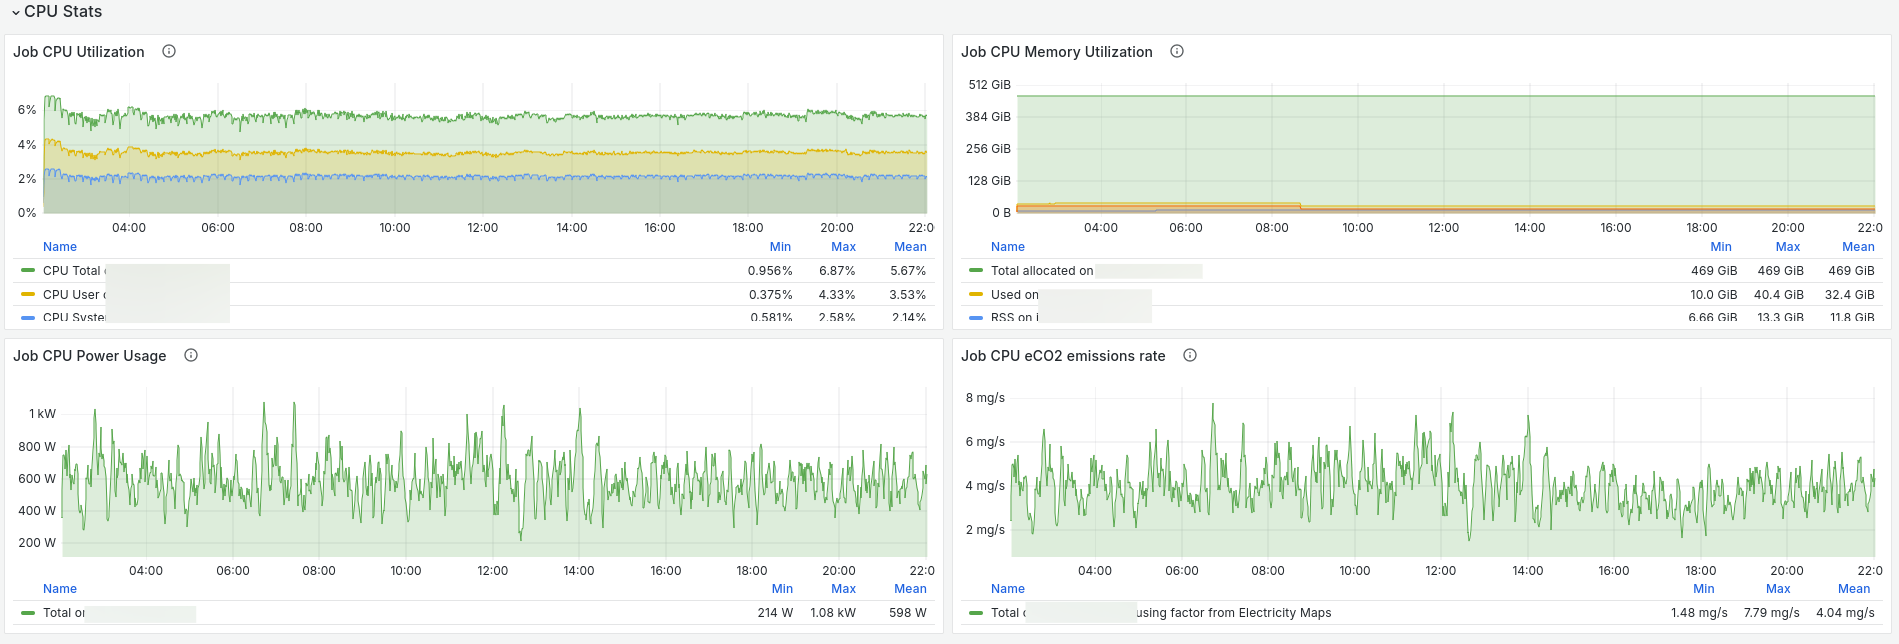
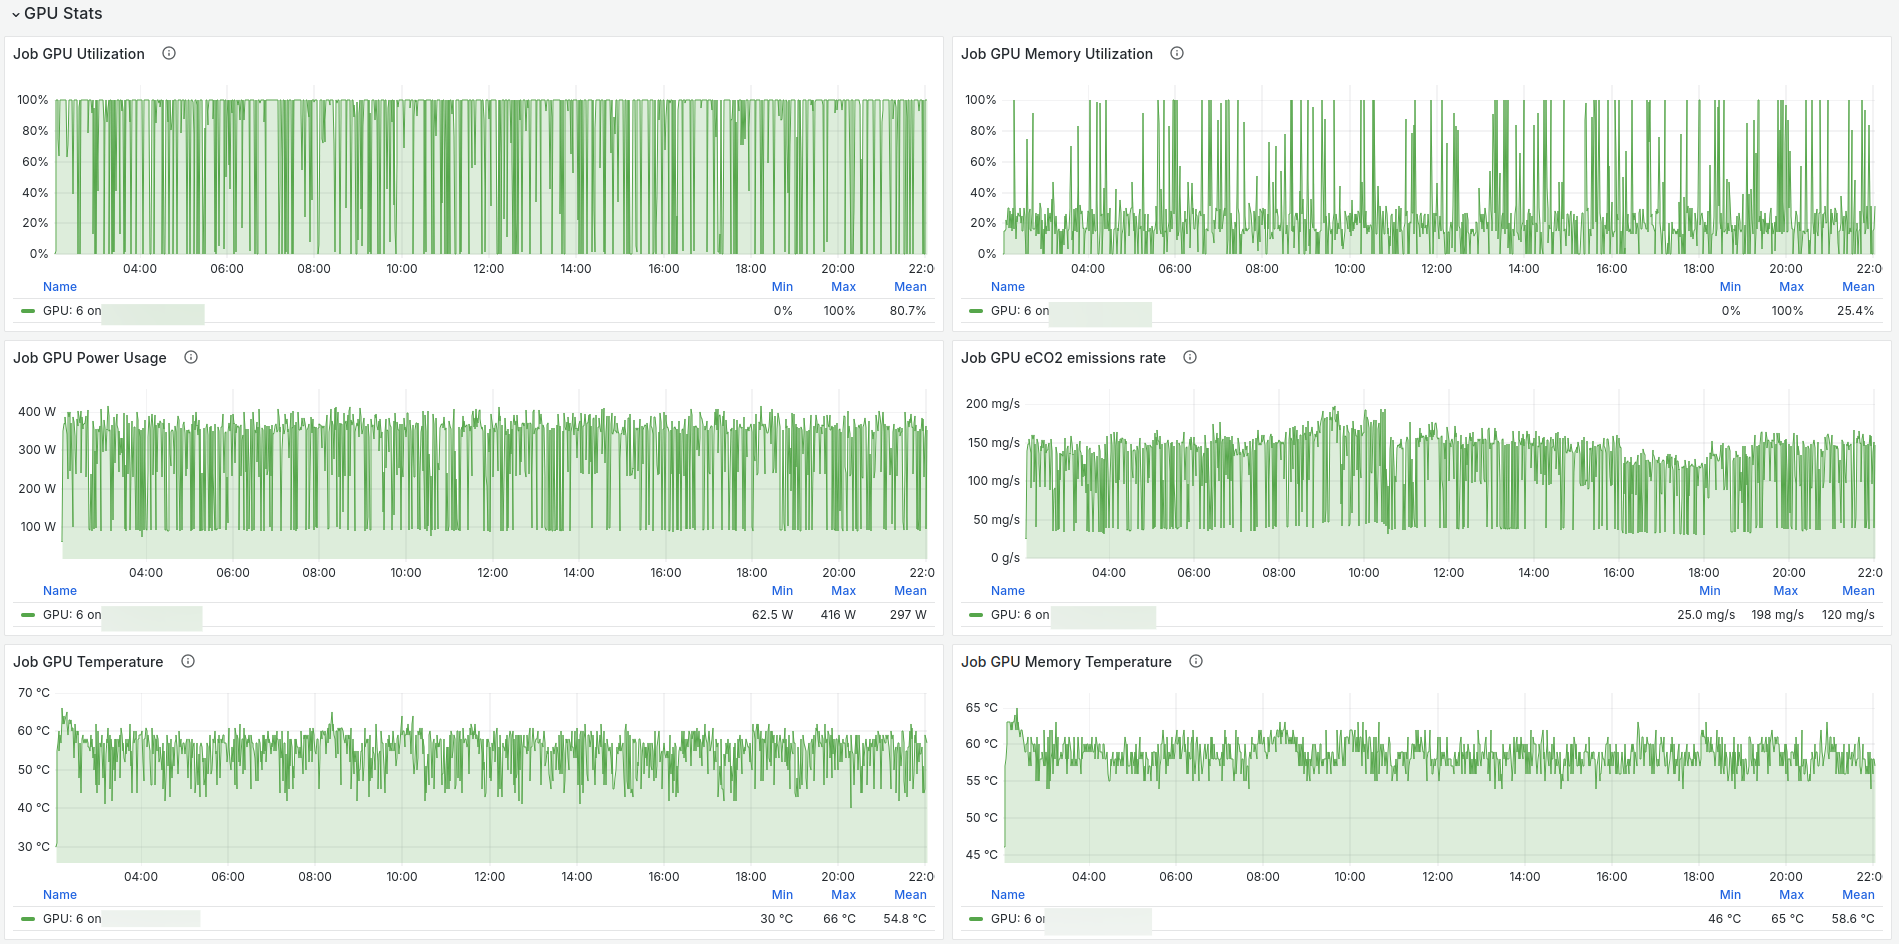
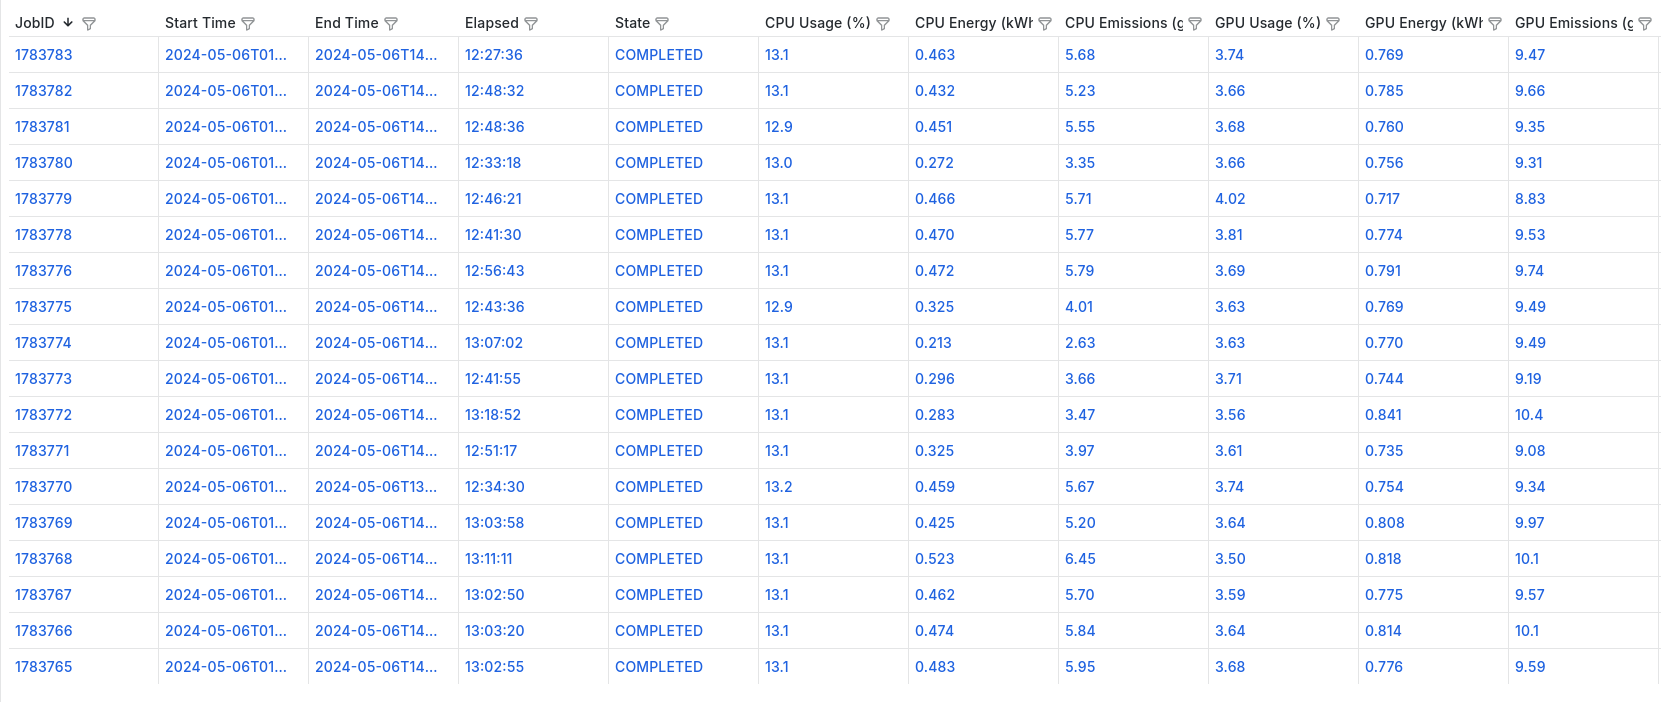
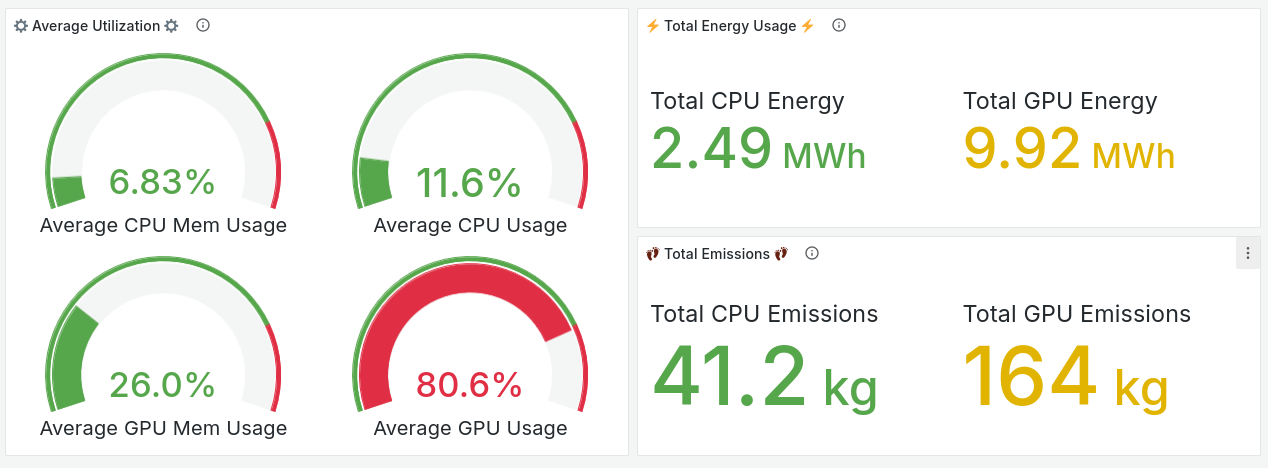
CEEMS is meant to be used with Grafana for visualization and below are some of the screenshots few possible metrics.

Time series compute unit CPU metrics

Time series compute unit GPU metrics

List of compute units of user with aggregate metrics

Aggregate usage metrics of a user

Talks and Demos

Contributing

We welcome contributions to this project, we hope to see this project grow and become a useful tool for people who are interested in the energy and carbon footprint of their workloads.

Please feel free to open issues and/or discussions for any potential ideas of improvement.

ceems's People

Contributors

dependabot[bot] avatar mahendrapaipuri avatar

Stargazers

 avatar  avatar  avatar  avatar  avatar  avatar  avatar  avatar  avatar  avatar

Watchers

 avatar  avatar

ceems's Issues

Add admin users config for LB. Sync admin users from Grafana

Currently, LB does not have notion of admin users to pass through the requests without additional checks. We need to add admin users to LB so that admins can look into dashboards of different users. We should do same thing as CEEMS API, sync admin users from Grafana.

Move all this logic into a middleware and add it to frontend handler.

Keep track most up to date user account association in a separate table in DB

Imagine a situation where user associated with a project at some point of time and submitted a compute unit during that time. If the user loses membership on that project, they should be able to look into units of that project anymore.

However, the way we check for user project association, that user will have access to that project (who they are not members anymore) until the DB entry has been purged. This should be improved.

We can create a table for user project association and sync with resource manager regularly and we check the association based on that table.

Support Cray's `capmc` in IPMI collector

Cray has its own IPMI implementation called capmc. We can support this in IPMI collector to get node power stats. An example output of command is as follows:

> capmc get_system_power -w 600
{
"start_time":"2015-04-01 17:02:10",
"avg":5942,
"min":5748,
"max":6132,
"window_len":600,
"e":0,
"err_msg":""
}

Ref: https://cug.org/proceedings/cug2015_proceedings/includes/files/pap132.pdf
API Docs: https://github.com/Cray-HPE/hms-capmc/blob/release/csm-1.0/api/swagger.yaml

Adjust query batch size in TSDB updater dynamically

We can improve query batching by adjusting batch size dynamically based on scrape interval, duration of query and TSDB's query-max.-samples. This ensures that we operate in a safe zone and avoid OOM errors on TSDB side and fetching metrics all the time on CEEMS side.

Recommend Projects

  • React photo React

    A declarative, efficient, and flexible JavaScript library for building user interfaces.

  • Vue.js photo Vue.js

    🖖 Vue.js is a progressive, incrementally-adoptable JavaScript framework for building UI on the web.

  • Typescript photo Typescript

    TypeScript is a superset of JavaScript that compiles to clean JavaScript output.

  • TensorFlow photo TensorFlow

    An Open Source Machine Learning Framework for Everyone

  • Django photo Django

    The Web framework for perfectionists with deadlines.

  • D3 photo D3

    Bring data to life with SVG, Canvas and HTML. 📊📈🎉

Recommend Topics

  • javascript

    JavaScript (JS) is a lightweight interpreted programming language with first-class functions.

  • web

    Some thing interesting about web. New door for the world.

  • server

    A server is a program made to process requests and deliver data to clients.

  • Machine learning

    Machine learning is a way of modeling and interpreting data that allows a piece of software to respond intelligently.

  • Game

    Some thing interesting about game, make everyone happy.

Recommend Org

  • Facebook photo Facebook

    We are working to build community through open source technology. NB: members must have two-factor auth.

  • Microsoft photo Microsoft

    Open source projects and samples from Microsoft.

  • Google photo Google

    Google ❤️ Open Source for everyone.

  • D3 photo D3

    Data-Driven Documents codes.