QGIS to Leaflet
###This repo is ready to be forked
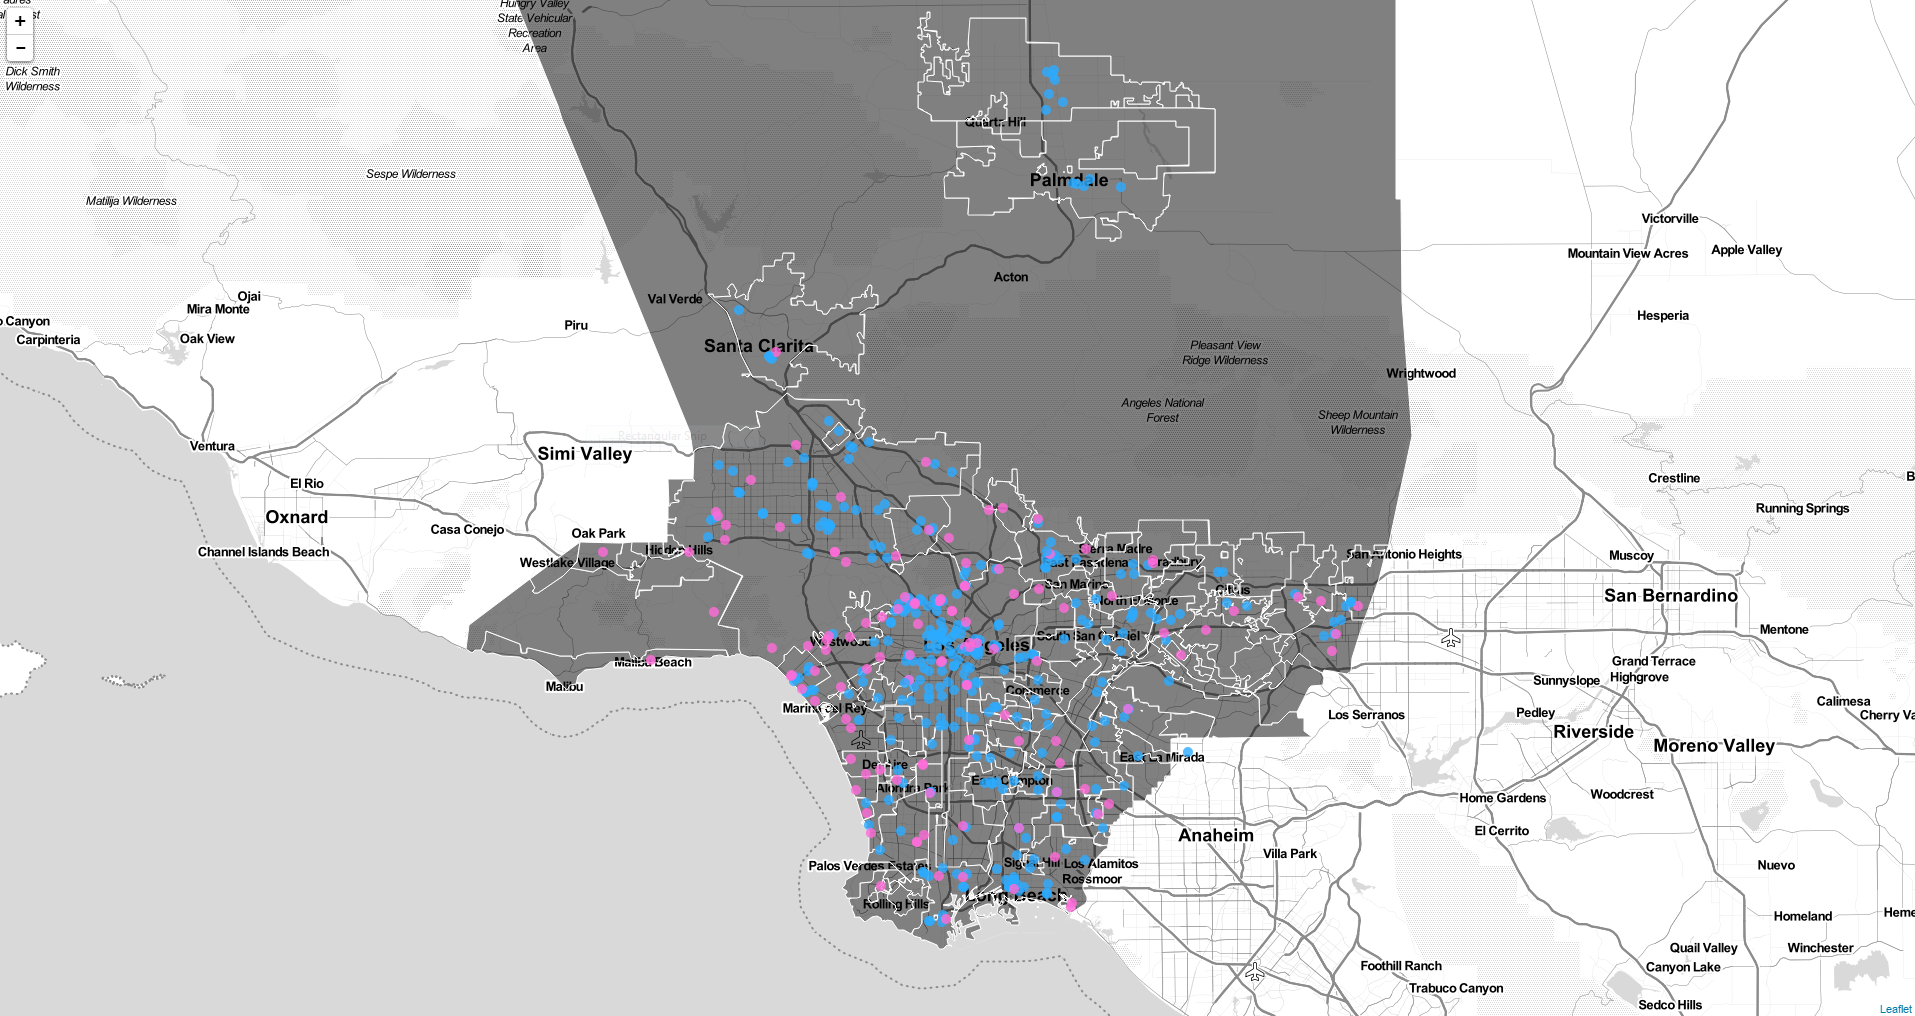 We'll take a look at the LA County data on Locations / Points of Interest and see what can be mapped using Leaflet.
Our main goal is to map certain data points from the LMS Data in the cities within LA County with the following:
- Using QGIS to open vector files or geodatabases
- Identifying the unique values in the fields of the data (EX: Arts and Recreation, Farmers Markets, Fire Stations)
- Styling the fields to highlight certain values using the RULE-BASED Styling (It's kind of like using functions in excel)
- Use a plugin like OpenLayers to add a base layer like Google Maps or Stamen Maps
- Select features using expressions (functions) and save the selected as geojson files to be loaded on leaflet
- Load up the python SimpleHTTPServer for local hosting your map
- Leaflet 101, Webmap basics
- Upload your map to Github for live hosting!
##What you'll need to install You'll need the following software ready (If you are having issues, don't worry we'll help you through it):
- QGIS | Free Open Source Geographic Information System
- Please download and install, its about 300 mb.
- Windows Users: Installation should be just downloading the install file.
- Mac Users: Installation requires additional software to make QGIS work. Instructions for additional software
- Text Editor | Software to write code like HTML, CSS and Javascript
- Sublime
- Brackets
- Atom
- Python | It's a programming language that has valuable tools and commands to help you build your maps like locally hosting your map on your computer with a command called
SimpleHTTPServer - Windows Users: Download Python 2.7.10 (Direct Link). During the install, in the setup labeled "Customize Python", scroll down to the feature "Add python.exe to Path" and select "Will be installed on local hard drive." This will allow you to call python commands when you are using your command terminal.
- Mac Users : Python is already installed and you can call python when in terminal.
- Github | Is a coding repository service that manages your code and data
- Sign-up for a free account!, This will allow you to fork (essentially copy) this repository to your computer and you can push your code and map to your account online to be hosted live!
- Windows Users: Install GitHub Desktop.
- Mac Users: Install GitHub Desktop
Step 1 - Load, style your spatial data in QGIS
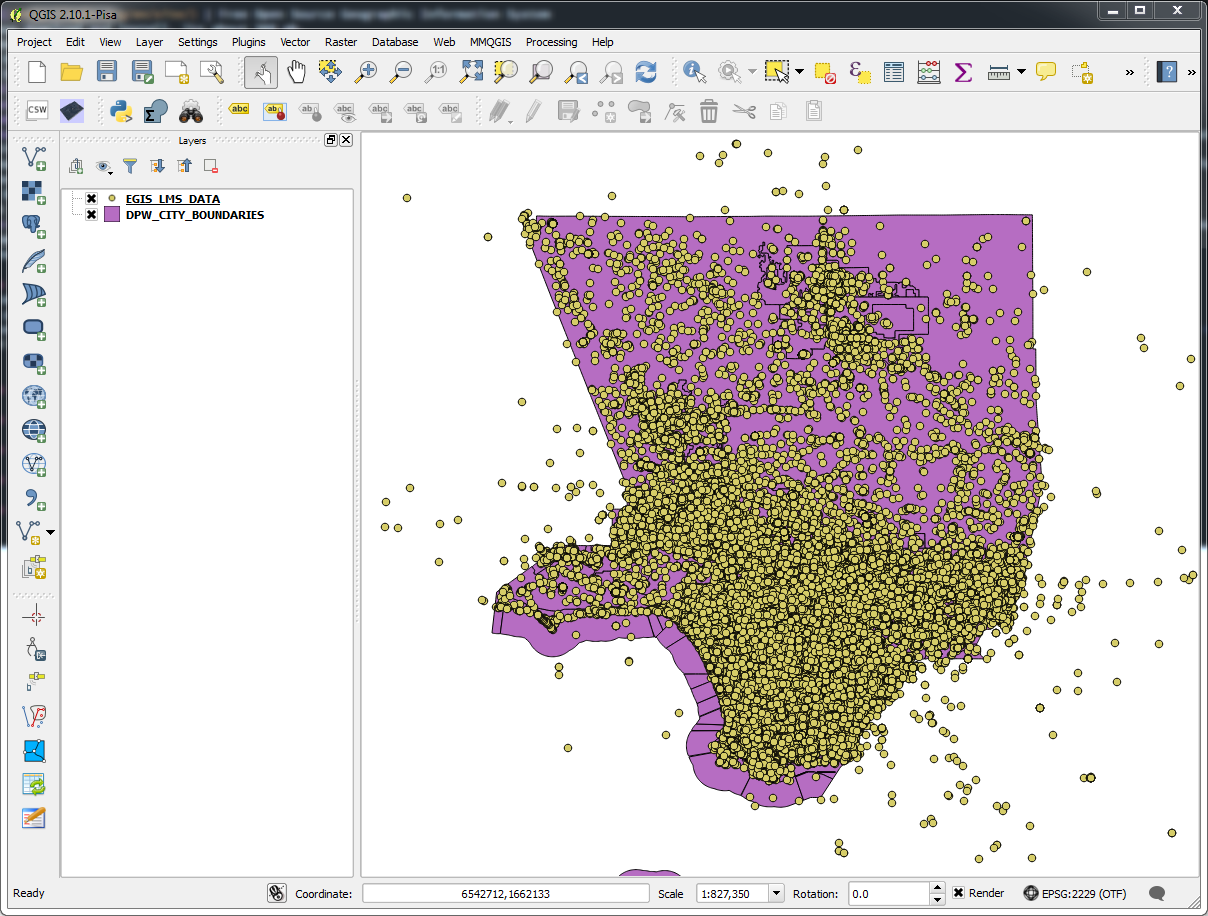
- Adding Data | Let's add the city boundaries (as a shapefile) and County location data (as a geodatabase) from the folder labeled
step 1 - You can drag and drop or use the
add vector layercommand under the layer menu of the top menu bar - Styling Data | Now that the data is loaded we can color style the way the map looks for your studies
- Double-clicking on the layer will open the properties to the dataset
- Clicking on the style menu will give you options to change the color, size, shape of each feature of the dataset
- Identifying the values or categories in your dataset | The LMS data has various kinds of categories ranging from Golf Courses to UPS Locations
- Find out the unique values by looking for the
List Unique Valuescommand in the Analysis Tools of the Vector Menu on the top menu bar - Styling Specific Data | With our list of unique values we can style the data according to what we want to see.
- Using the rule-based styling we can style the data to show just the
Farmers Markets and Food Assistancelocations
Step 2 - Export your data into geojson
- Selecting specific features | With the city boundaries we will select only the features labeled
land - Having these selected we can save the selected into a geojson file by right clicking the layer and hit save as
- Be sure to have the settings as follows (Format: geojson, CRS: WGS 84, [x] Save only selected features, [x] Add saved file to map)
- Rule based selecting | With the LMS data we will select only
Farmers Markets and Food Assistancelocations - Similar to the rule based styling, we will select features by expression
- Save your files to the folder labeled
dataas a place for you to test your map on leaflet - If you have issues, the files are already made for you in the folder labeled
step 2
Step 3 - Get a basic map in Leaflet
- In this step we will discuss how Leaflet enables you to make a map using HTML, CSS and Javascript
- Copy the file labeled
index.htmlto your main folder and open it with your text editor - Before we get to the code, you'll need to be running a server locally using Python
- Goto the location of your github folder in your terminal or command prompt
- Type
python -m SimpleHTTPServer 8000 - Go to your browser and open
http://localhost:8000/ - To open on your phone, find your IP address and open
http://[YOUR-IP-ADDRESS]:8000/ - Having the server run locally you can change your code, save and refresh your map with the new changes
Step 4 - Style your geojson file
- In this step we will learn how to use javascript to style features with different colors
Step 5 - Using popups to display information
- In this step we will learn how to change the contents of the popup
Step 6 - Push your own map to github.
-
In this step we will push our map to our github account
-
git clone https://github.com/cityhubla/mapstarter_lacounty -
Go back to github.com and create your own repository
-
git remote add machiko https://github.com/machikoyasuda/ugly-map.git(Your URL will be different) -
Origin is cityhubla/mapstarter_lacounty. You are creating your own on your own account.
-
git push -u machiko masterand pushing your edits into your master -
git checkout -b gh-pagescreate a new gh-pages branch -
git rebase mastermake sure to copy down the latest master onto this branch. -
git push machiko gh-pagespush up the latest to the gh-pages on your account -
it should now be here: http://machikoyasuda.github.io/ugly-map/


