- joinery [joi-nuh-ree]
- 1. In woodworking, the craft of joining together pieces of wood to produce more complex items.
- 2. In Java, a data analysis library for joining together pieces of data to produce insight.
Remember FizzBuzz (of course you do!), well imagine you have just
solved the puzzle (well done!) and you have written the results to
a comma-delimited file for further analysis. Now you want to know
how many times are the strings Fizz, Buzz, and FizzBuzz
printed out.
You could answer this question any number of ways, for example you
could modify the original program, or reach for Python/pandas, or even
(for the sadistic among us, you know who you are) type out a one-liner
at the command prompt (probably including cut, sort, and uniq).
Well, now you have one more option. This option is especially good if you are 1) using Java already and 2) may need to integrate your solution with other Java applications in the future.
You can answer this question with joinery.
df.groupBy("value")
  .count()
  .sortBy("-number")
  .head(3)
Printing out the resulting data frame gives us the following table.
  	   value 	number
 0	Fizz    	    27
 1	Buzz    	    14
 2	FizzBuzz	     6
See FizzBuzz.java for the complete code.
Get the executable jar and try it for yourself.
$ java -jar joinery-dataframe-1.4-jar-with-dependencies.jar shell
# Rhino 1.7 release 2 2009 03 22
# Java HotSpot(TM) 64-Bit Server VM, Oracle Corporation, 1.8.0_31
> df = new DataFrame()
[empty data frame]
> df.add("value")
[empty data frame]
> [10, 20, 30].forEach(function(val) {
      df.append([val])
  })
> df
        value
 0	   10
 1	   20
 2	   30

>A maven repository for joinery is hosted on JCenter. For instructions on setting up your maven profile to use JCenter, visit https://bintray.com/bintray/jcenter.
<dependency>
  <groupId>joinery</groupId>
  <artifactId>joinery-dataframe</artifactId>
  <version>1.4</version>
</dependency>JCenter also allows for direct download using the button below.

joinery includes some tools to make working with data frames easier.
These tools are available by running joinery.DataFrame as an application.
$ java joinery.DataFrame
usage: joinery.DataFrame [compare|plot|show|shell] [csv-file ...]Show displays the tabular data of a data frame in a gui window.
$ java joinery.DataFrame show data.csv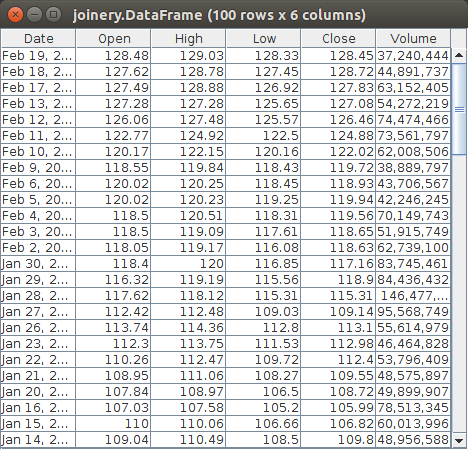
Plot displays the numeric data of a data frame as a chart.
$ java joinery.DataFrame plot data.csv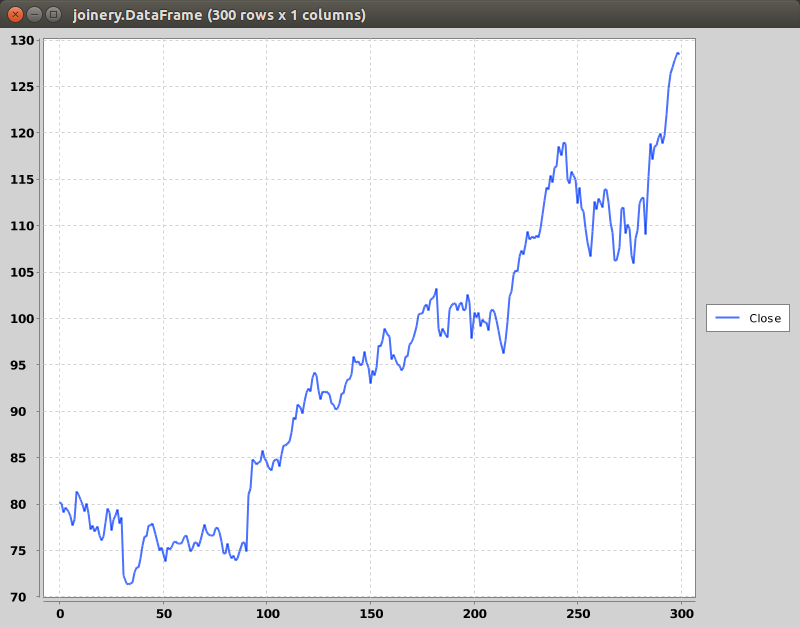
Launches an interactive JavaScript shell for working with data frames.
$ java joinery.DataFrame shell
# Rhino 1.7 release 2 2009 03 22
# Java HotSpot(TM) 64-Bit Server VM, Oracle Corporation, 1.8.0_31
> df = DataFrame.readCsv('https://www.quandl.com/api/v1/datasets/GOOG/NASDAQ_AAPL.csv')
             Date             Open            High            Low             Close              Volume
   0    2015-02-20      128.62000000    129.50000000    128.05000000    129.50000000     48948419.00000000
   1    2015-02-19      128.48000000    129.03000000    128.33000000    128.45000000     37362381.00000000
   2    2015-02-18      127.62000000    128.78000000    127.45000000    128.72000000     44891737.00000000
   3    2015-02-17      127.49000000    128.88000000    126.92000000    127.83000000     63152405.00000000
   4    2015-02-13      127.28000000    127.28000000    125.65000000    127.08000000     54272219.00000000
   5    2015-02-12      126.06000000    127.48000000    125.57000000    126.46000000     74474466.00000000
   6    2015-02-11      122.77000000    124.92000000    122.50000000    124.88000000     73561797.00000000
   7    2015-02-10      120.17000000    122.15000000    120.16000000    122.02000000     62008506.00000000
   8    2015-02-09      118.55000000    119.84000000    118.43000000    119.72000000     38889797.00000000

... 8629 rows skipped ...

8638    1980-12-12        0.00000000      4.12000000      4.11000000      4.11000000     14657300.00000000

> df.types()
[class java.util.Date, class java.lang.Double, class java.lang.Double, class java.lang.Double, class java.lang.Double, class java.lang.Double]
> df.sortBy('Date')
             Date             Open            High            Low             Close              Volume
8638    1980-12-12        0.00000000      4.12000000      4.11000000      4.11000000     14657300.00000000
8637    1980-12-15        0.00000000      3.91000000      3.89000000      3.89000000      5496400.00000000
8636    1980-12-16        0.00000000      3.62000000      3.61000000      3.61000000      3304000.00000000
8635    1980-12-17        0.00000000      3.71000000      3.70000000      3.70000000      2701300.00000000
8634    1980-12-18        0.00000000      3.82000000      3.80000000      3.80000000      2295300.00000000
8633    1980-12-19        0.00000000      4.05000000      4.04000000      4.04000000      1519700.00000000
8632    1980-12-22        0.00000000      4.25000000      4.23000000      4.23000000      1167600.00000000
8631    1980-12-23        0.00000000      4.43000000      4.41000000      4.41000000      1467200.00000000
8630    1980-12-24        0.00000000      4.66000000      4.64000000      4.64000000      1500100.00000000

... 8629 rows skipped ...

   0    2015-02-20      128.62000000    129.50000000    128.05000000    129.50000000     48948419.00000000

> .reindex('Date')
                  Open                High            Low             Close              Volume
1980-12-12        0.00000000      4.12000000      4.11000000      4.11000000     14657300.00000000
1980-12-15        0.00000000      3.91000000      3.89000000      3.89000000      5496400.00000000
1980-12-16        0.00000000      3.62000000      3.61000000      3.61000000      3304000.00000000
1980-12-17        0.00000000      3.71000000      3.70000000      3.70000000      2701300.00000000
1980-12-18        0.00000000      3.82000000      3.80000000      3.80000000      2295300.00000000
1980-12-19        0.00000000      4.05000000      4.04000000      4.04000000      1519700.00000000
1980-12-22        0.00000000      4.25000000      4.23000000      4.23000000      1167600.00000000
1980-12-23        0.00000000      4.43000000      4.41000000      4.41000000      1467200.00000000
1980-12-24        0.00000000      4.66000000      4.64000000      4.64000000      1500100.00000000

... 8629 rows skipped ...

2015-02-20      128.62000000    129.50000000    128.05000000    129.50000000     48948419.00000000

> .retain('Close')
                  Close
1980-12-12        4.11000000
1980-12-15        3.89000000
1980-12-16        3.61000000
1980-12-17        3.70000000
1980-12-18        3.80000000
1980-12-19        4.04000000
1980-12-22        4.23000000
1980-12-23        4.41000000
1980-12-24        4.64000000

... 8629 rows skipped ...

2015-02-20      129.50000000

> .plot()The complete api documentation for the DataFrame class is available
at http://cardillo.github.io/joinery


