linkedin / cruise-control-ui Goto Github PK
View Code? Open in Web Editor NEWCruise Control Frontend (CCFE): Single Page Web Application to Manage Large Scale of Kafka Clusters
License: BSD 2-Clause "Simplified" License
Cruise Control Frontend (CCFE): Single Page Web Application to Manage Large Scale of Kafka Clusters
License: BSD 2-Clause "Simplified" License


![dependabot[bot] avatar](https://avatars.githubusercontent.com/in/29110?v=4 "dependabot[bot]")


Is there a way to change both the logical group name and CC UI instance name when running in embedded mode? I tried changing the first two columns in static/config.csv but the UI always shows dev>>dev. It would be nice since we have multiple environments and would like to keep the UI instance separate for each environment as well.
Most of the GET/POST endpoints in CC is aync operation and if a calculation does not finish in 10 second, an in-progress response is returned. Then CC expects a follow-up request with same URL and with the same cookie or the UUID which is returned in the first in-progress response to get the final result.
Looks like currently CCFE does not follow this assumption and specify neither cookie or UUID in follow up request, which result in user never see final result and get a false impression that CC is stuck. What's worse, in this way CCFE initiate a new operation each time and can potential user up all the session execution thread inside CC.
It displays error 500 instead of an appropriate message. Server logs:
cruise-control_1        | Caused by: com.linkedin.cruisecontrol.exception.NotEnoughValidWindowsException: There are only 0 valid windows when aggregating in range [-1, 1610215532372] for aggregation options (minValidEntityRatio=0.95, minValidEntityGroupRatio=0.00, minValidWindows=1, numEntitiesToInclude=104, granularity=ENTITY)
cruise-control_1        | 	at com.linkedin.cruisecontrol.monitor.sampling.aggregator.MetricSampleAggregator.validateCompleteness(MetricSampleAggregator.java:541)
cruise-control_1        | 	at com.linkedin.cruisecontrol.monitor.sampling.aggregator.MetricSampleAggregator.aggregate(MetricSampleAggregator.java:213)
cruise-control_1        | 	at com.linkedin.kafka.cruisecontrol.monitor.sampling.aggregator.KafkaPartitionMetricSampleAggregator.aggregate(KafkaPartitionMetricSampleAggregator.java:151)
cruise-control_1        | 	at com.linkedin.kafka.cruisecontrol.monitor.LoadMonitor.clusterModel(LoadMonitor.java:544)
cruise-control_1        | 	at com.linkedin.kafka.cruisecontrol.KafkaCruiseControl.clusterModel(KafkaCruiseControl.java:350)
cruise-control_1        | 	at com.linkedin.kafka.cruisecontrol.servlet.handler.async.runnable.LoadRunnable.clusterModel(LoadRunnable.java:111)
cruise-control_1        | 	... 10 more
Best
Jerome
review end point list all the POST requests which are not approved yet. Add a new tab to support rendering and also approving the requests.
https://github.com/linkedin/cruise-control/wiki/2-step-verification-for-POST-requests
Using with Cruise Control version 2.4
When you go to UI - Monitor Tab and click - Bootstrap Metrics, it kicks off an API Call that gets stuck in an infinite loop (with no start and end times)
Cruise Control State -> Monitor State -> Bootstrap Metrics
curl GET kafkacruisecontrol/bootstrap?clearmetrics=true&start=0
Instead, bootstrap Metrics should have some option on UI for start and end-time
Ex. Start time = now - 1 day and End time = now
Not having this option on UI makes the UI unusable for Bootstrapping Metrics. I was able to fix this by running manual API Call and hard-code the start and end times.
curl GET kafkacruisecontrol/bootstrap?clearmetrics=true&start=1591130000000&end=1591137027000
The relaxed version of RackAwareGoal is missing from Cruise Control UI in "Kafka Cluster Administration" tab preventing users to trigger actions like rebalance.
Fixed in #51
dist
├── index.html
└── static
├── cc-logo.png
├── config.csv
├── css
│ ├── app.css
│ └── app.css.map
└── js
├── app.js
├── manifest.js
└── vendor.js
Hi,
I am using Cruise Control 2.5.x, and I was wondering which UI branch or tag is best for Cruise Control 2.5.33? Or is there a Wiki page for me to read? I am having issue get certain goals from UI (I meant from Kafka Cluster Administration page). For example, CC 2.5.33 has RackAwareDistributionGoal but CC-UI v0.3.4 doesn't have that goal. Maybe I am using the wrong branch. Please help. Thank you in advance.
CC version-2.0.191
Apache Kafka Version -2.2.1

Tried by reducing scrape interval less than 30 secs , still getting same error
I am getting the below issue while running CC-UI locally. Can someone kindly help me out.
Refused to load the image 'http://0.0.0.0:8090/favicon.ico' because it violates the following Content Security Policy directive: "default-src 'none'". Note that 'img-src' was not explicitly set, so 'default-src' is used as a fallback.
Hello everyone, I'm having trouble deploying CC & CCFE and would like to ask for help.
So, I got below error on some tabs of CCFE:
User-Task-ID header is not found in the response from the server.
I got 3 nodes where zookeeper, kafka, cc & ccfe is deployed on each node.
Kafka 3.1.0
Scala 2.13
CC 2.5.89
CCFE 0.3.4
I configured cruisecontrol.properties as it says here
webserver.http.port={{ cruise_control_port }}
webserver.http.address=0.0.0.0
webserver.http.cors.enabled=true
webserver.http.cors.origin=http://localhost:{{ cruise_control_port }}
webserver.http.cors.allowmethods=OPTIONS,GET,POST
webserver.http.cors.exposeheaders=User-Task-ID,Content-Type
webserver.api.urlprefix=/kafkacruisecontrol/*
webserver.ui.diskpath={{ cruise_control_ui_work_dir }}/dist
webserver.ui.urlprefix=/*
webserver.request.maxBlockTimeMs=10000
webserver.session.maxExpiryTimeMs=60000
webserver.session.path=/
webserver.accesslog.enabled=true
In this configuration {{ cruise_control_port }} is 9898.
That's what config.csv Insights says:

I found User-Task-Id in Response Headers, but still got this error.

Maybe I missed somethig, I'll be really appreciate with any help.
CC support User-Task-Id header for long running tasks. Leverage this feature in addition to current sessions implementation.
Setup is CC 0.1.68 on RHEL hosts, with a separate server hosting Nginx and CC-UI (from the 0.3.0 release tarball). I've followed the instructions for a non-CORS install (after reading the advice about CORS in issue #7 . This seems to work fine, apart from the "User-Task-ID header..." red banner being printed on the Cluster Load and Control Proposals pages.
I've tried switching to CORS (following the instructions for that setup) and while my CC's look good, I just get the Network error message given in issue #7 and that banner in the UI.
If non-CORS is the recommended way, then is there a way to suppress this (unnecessary?) warning? Especially annoying given that the Insights page is able to figure when CORS is Required or not.
For info, the CORS Options check of one of my CC's returns this:
< Date: Tue, 17 Sep 2019 15:00:43 GMT
< Access-Control-Allow-Origin: http://server-name-removed
< Access-Control-Allow-Methods: OPTIONS,GET,POST
< Access-Control-Allow-Headers: User-Task-ID
< Access-Control-Allow-Credentials: true
< Access-Control-Max-Age: 1728000
< Content-Length: 0
< Server: Jetty(9.4.18.v20190429)
which looks to be what's asked for in the documentation.
I am running CC server on a different node than CC UI and in the config.csv, I have specified the complete hostname and port for CC server. However when I start CC UI and select the instance, i get "network error" for all the selections. I can use the REST APIs and get the CC status successfully from the node I am running CC UI on which means I can access the server on the host and port. Why is the UI showing network error ?
CC has added new feature to make POST requests go through peer review (for safety) reasons.
This makes the responses from the CC to not contain the actual output, but a review-id which needs to be submitted again for actual confirmation of the request.
Details are in https://github.com/linkedin/cruise-control/wiki/2-step-verification-for-POST-requests
It would be nice to have the cruise control status pages show a bit more verbose messages especially when interbroker movements are happening, That could potentially show you which actions are happening in near real time.
I'm trying to connect to CC UI from http:localhost:8090 but the page doesn't load. if I use curl localhost:8090 from inside the container it gets the html for the webpage, but if i try to connect using the browser it doesn't respond.
My config.csv : dev,dev,/kafkacruisecontrol/
cruisecontrol.properties:
HTTP listen port
webserver.http.port=8090
HTTP listen address
webserver.http.address=0.0.0.0
webserver.api.urlprefix=/kafkacruisecontrol/*
Location where the Cruise Control frontend is deployed
webserver.ui.diskpath=/opt/cruise-control/cruise-control-ui/dist
URL path prefix for UI
(dont forget the ending *)
webserver.ui.urlprefix=/
********************************************* <<
Application directory : /opt/cruise-control
REST API available on : /kafkacruisecontrol/*
Web UI available on : /*
Web UI Directory : ./cruise-control-ui/dist/
Cookie prefix path : /
Kafka Cruise Control started on : http://0.0.0.0:8090/
CORS Enabled ? : false
********************************************* <<*
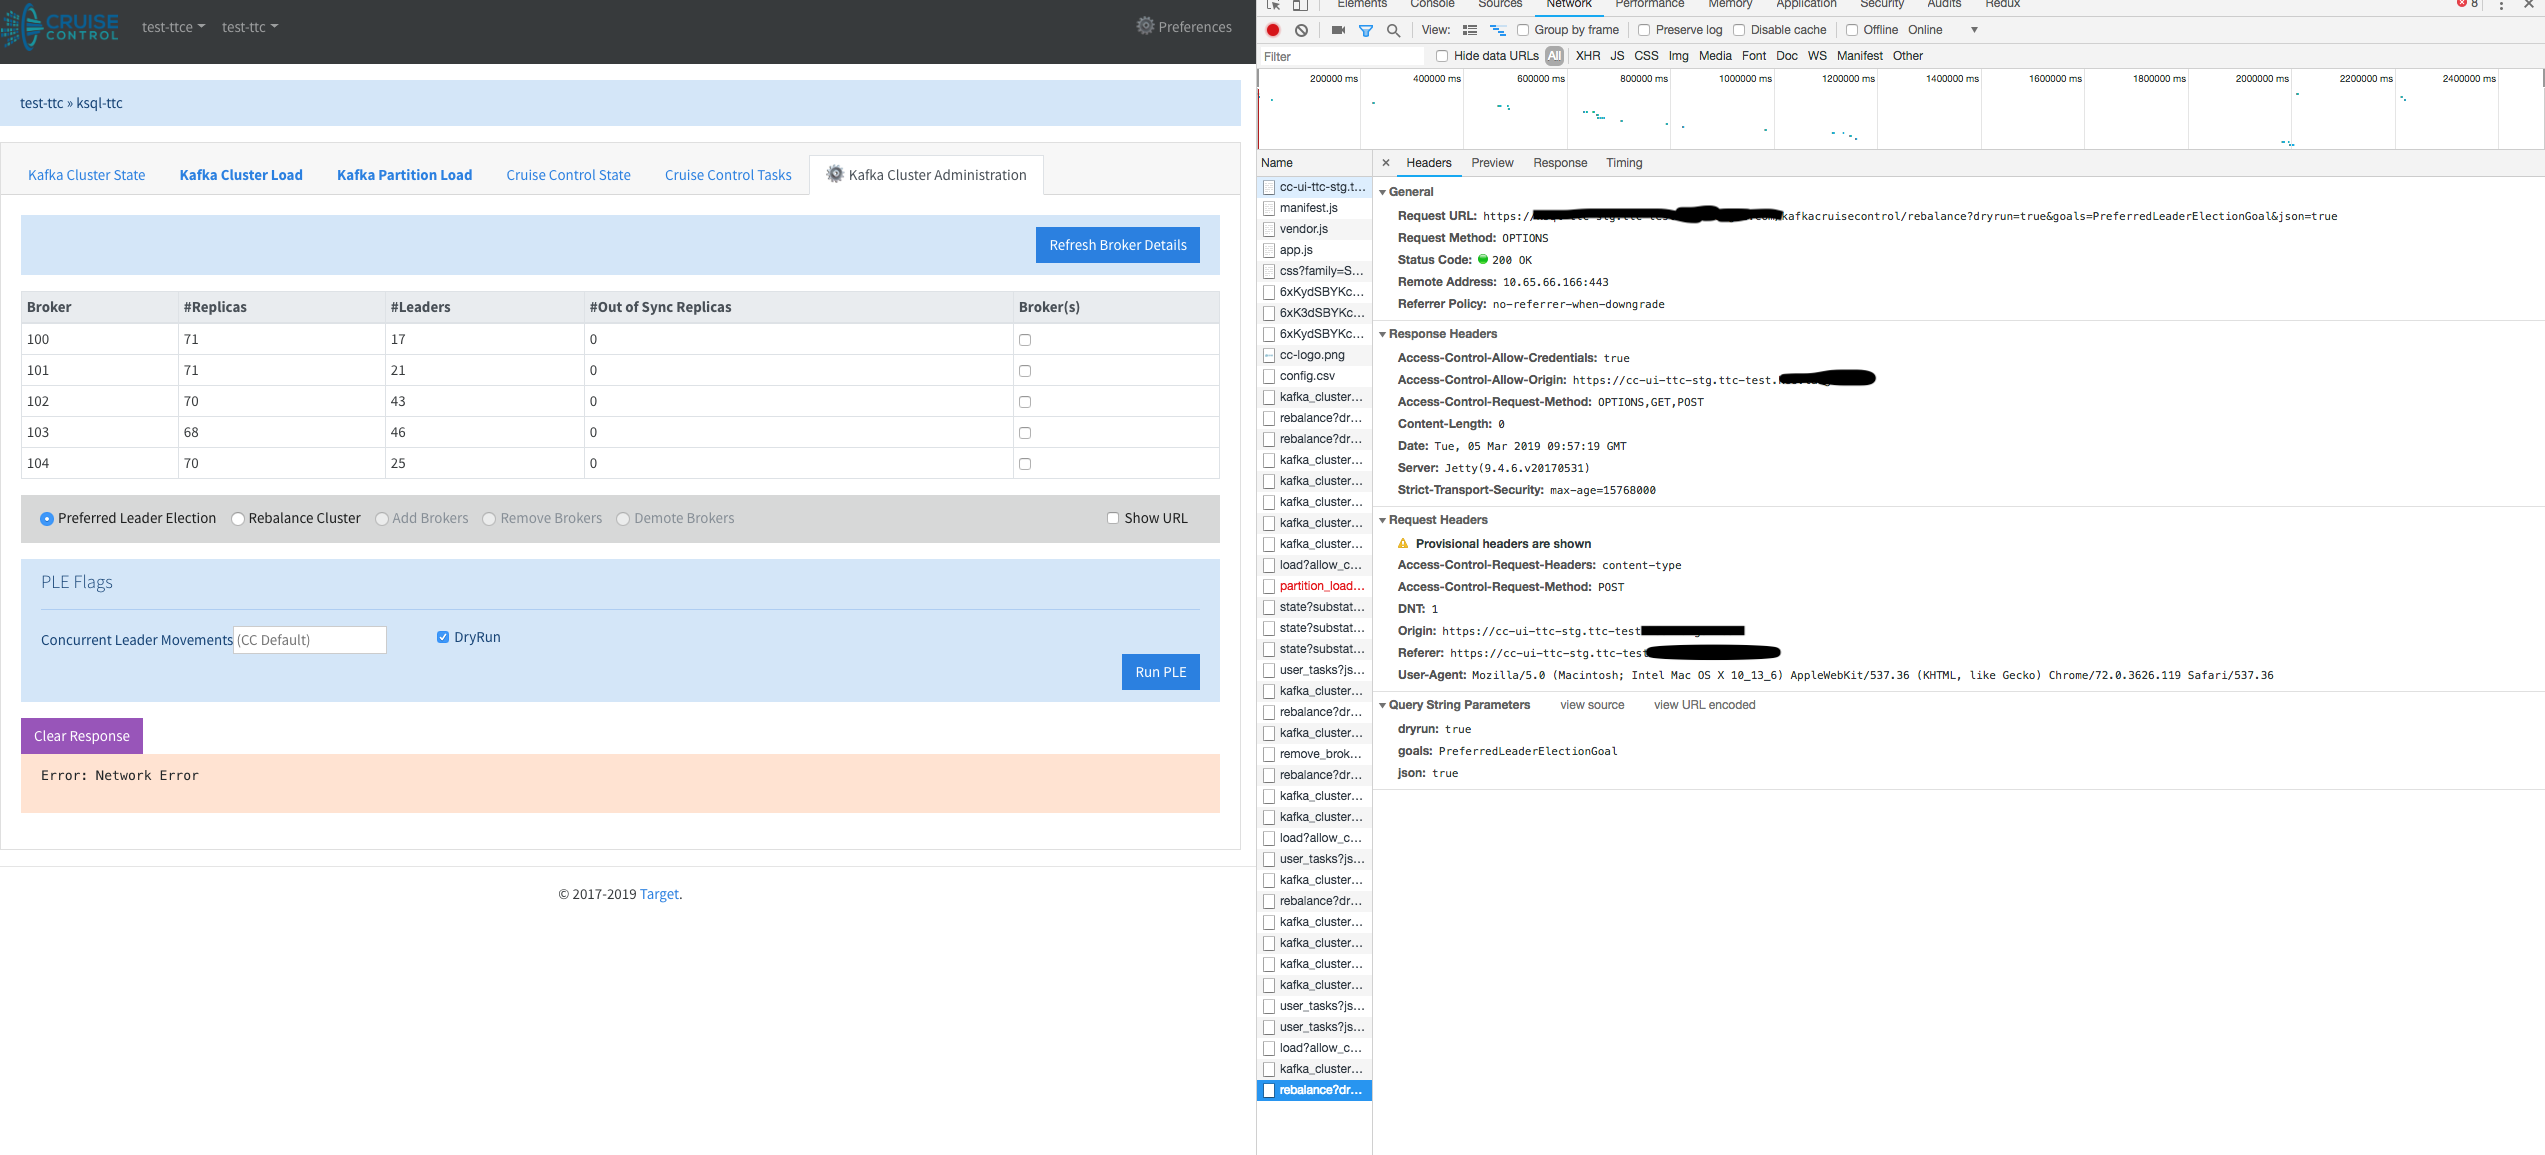
@nareshv Here is the scenario what I am seeing.
Whenever I am on Kafka Cluster administration tab and trying to execute any of the task such as "Preferred Leader Election" "Rebalance Cluster" "Add Brokers" "Remove Brokers" "Demote Brokers" etc, I am getting Error: Network Error.
Though when I inspect, my console shows me Has been blocked by CORS policy, I frankly feel this is something to do more then CORS policy. Because of two reasons
GET calls works fine. (if CORS issue then even this should have failed)OPTIONS instead of POST (which UI should have used) and I see empty response even though the status shows as 200 OK.To cross verify, I took the URL generated by CCFE and call it using POSTMAN as POST method, I am able to get response here but not from CCFE. Screenshot attached for more reference.
I see that last release was in Mar and there have been multiple commits post that. When can we expect a new release for all these fixes?
Excerpts copied from the issue: linkedin/cruise-control#979
--
For the following rebalance request:
         https://cruise-control.company.net/kafkacruisecontrol/rebalance?dryrun=true
		&goals=RackAwareGoal
		&skip_hard_goal_check=true
		&excluded_topics=(_heartbeats|__CruiseControlMetrics)
		&json=true
Running from GUI get the regexp wrong (excluded_topics=_heartbeats%257C__CruiseControlMetrics)
DEBUG:
Oct 25 08:34:37 cruise-control-app.company.net cruise-control[16209]: [2019-10-25 08:34:37,032] DEBUG REQUEST POST /kafkacruisecontrol/rebalance on HttpChannelOverHttp@17e809fb{r=1,c=false,c=false/false,a=DISPATCHED,uri=//localhost:8081/kafkacruisecontrol/rebalance?dryrun=true&goals=RackAwareGoal&skip_hard_goal_check=true&excluded_topics=_heartbeats%257C__CruiseControlMetrics&json=true,age=0} (org.eclipse.jetty.server.Server)
Running via curl works:
DEBUG:
Oct 25 08:36:30 cruise-control-app.company.net cruise-control[16209]: [2019-10-25 08:36:30,043] DEBUG REQUEST POST /kafkacruisecontrol/rebalance on HttpChannelOverHttp@75afb24c{r=1,c=false,c=false/false,a=DISPATCHED,uri=//localhost:8081/kafkacruisecontrol/rebalance?dryrun=true&excluded_topics=_heartbeats|__CruiseControlMetrics&goals=RackAwareGoal&skip_hard_goal_check=true&json=true,age=0} (org.eclipse.jetty.server.Server)
It drills-down to %257C that will be translated to %| for the gui call which don't work
--
Sending just a %7C instead of the pipe | works as well. But as stated a %257C dont.
It would be awesome if the Monitor State pane included a button to toggle the current monitoring state.
100 is too small. Just think of the productivity increase if I didn't have to type an extra 00...!
Leverage the /kafka_cluster_state endpoint of all the configured clusters and show a single page summary on the homescreen.
Since this involves polling, have sensible timeouts along with grouping based on region, etc..
Hello, can cruise-control show kafka cluster logs?
Hello Naresh,
this #64 fixes an issue where the URL was reset when changing the type of resource to display on the charts view.
Happy to discuss should you have any feedbacks regarding this
Hello @nareshv this may look like a small one, but I keep losing the KCC tab among all the others, would it be possible to add a favicon with the kcc logo? I can do the PR but I don't have the icon for this
thanks :)
When Cruise Control is managing many, many clusters - the bottom items on the nav menu aren't accessible as there is no scrollbar available. I'm happy to raise a PR to add scroll to the nav if that's the path forward.
Hello, we are trying to expose the cruse control ui through our ingress on a predetermined shared port.
I'm trying to set webserver.ui.urlprefix to /cruisecontrol-ui/* so that when requests come in through the ingress they are forwarded correctly. Right now I can access index.html through our ingress, but subsequent requests to static resources fail.
However, if I set the value to webserver.ui.urlprefix in the properties and restart I'm not even able to get a successful response using curl on localhost. Am I misunderstanding the usage of webserver.ui.urlprefix or are there additional configurations that are needed for this?
webserver.ui.urlprefix=/*
curl http://127.0.0.1:9090
<!doctype html><html lang=en><head><meta charset=utf8><meta name=viewport content="width=device-width,initial-scale=1,shrink-to-fit=no"><title>Kafka Cruise Control UI</title><link href=/static/css/app.css rel=stylesheet></head><body><div id=app></div><script type=text/javascript src=/static/js/manifest.js></script><script type=text/javascript src=/static/js/vendor.js></script><script type=text/javascript src=/static/js/app.js></script></body></html>
webserver.ui.urlprefix=/cruisecontrol-ui/*
curl http://127.0.0.1:9090/cruisecontrol-ui
curl http://127.0.0.1:9090
curl http://127.0.0.1:9090/cruisecontrol-ui/index.html
`
| URI: | / |
|---|---|
| STATUS: | 404 |
| MESSAGE: | Not Found |
| SERVLET: | org.eclipse.jetty.servlet.ServletHandler$Default404Servlet-ce5a68e |
| URI: | /cruisecontrol-ui |
|---|---|
| STATUS: | 404 |
| MESSAGE: | Not Found |
| SERVLET: | default |
As per your doc latest compiled artifact has different directory structure as below
tar zxvf cruise-control-ui.tar.gz
x cruise-control-ui/
x cruise-control-ui/index.html
x cruise-control-ui/Changelog
x cruise-control-ui/README.md
x cruise-control-ui/static/
x cruise-control-ui/static/cc-logo.png
x cruise-control-ui/static/css/
x cruise-control-ui/static/js/
x cruise-control-ui/static/config.csv
x cruise-control-ui/static/js/manifest.js
x cruise-control-ui/static/js/vendor.js
x cruise-control-ui/static/js/app.js
x cruise-control-ui/static/css/app.css
x cruise-control-ui/static/css/app.css.map
Following below doc
https://github.com/linkedin/cruise-control-ui/wiki/Single-Kafka-Cluster
I'm experiencing this issue on Executor State tab, though every other tab and everything in general works perfectly fine.

Looks like I get the error on CORS preflight request.

Tried to fix this issue myself, removing cache headers from Executor component resolves it, Executor tab works good with the request like that:
vm.$http.get(vm.url, {withCredentials: true}).then((r) => {
Any thoughts on the appearing issue?
CC-UI is on master branch
CC is on migrate_to_kafka_2_5 branch
Kafka: 3.1.1 (Commit:5cf0285dc9728b0b)
In order to give more insights to the user; parse the config.csv and compare it with the origin webserver to suggest user of any config issues.
I have set up cruise control and cruise control UI for a single kafka cluster. When I click on add brokers button, I get a response from the server listing all the attriutes but a new broker is not created.
Also, I am not sure how cruise control will be able to create a new broker without creating a new instance ( we have created EC2 instances - 3 brokers and 3 zookeepers )
Can somebody please help me in fixing this asap.
Version: v0.3.0
Fails with ERROR: REVIEW endpoint requires at least one of 'approve' or 'discard' parameter.
Inspecting this further - shows this:
Request URL: http://<IP>:8090/kafkacruisecontrol/review?json=true Request Method: POST Status Code: 400 Bad Request Remote Address: <IP>:8090 Referrer Policy: no-referrer-when-downgrade
I do have pending reviews:
curl -X GET http://<IP>:8090/kafkacruisecontrol/review_board?json=true {"RequestInfo":[{"Status":"PENDING_REVIEW","SubmissionTimeMs":1565740145389,"SubmitterAddress":"<IP_1>","Id":0,"EndpointWithParams":"REBALANCE?json\u003dtrue\u0026dryrun\u003dtrue","Reason":"Awaiting review."}],"version":1}
Attaching the screen shot as well for reference.
FYI - this doesn't work both on single cluster mode nor on the multi cluster mode (separate nginx CC-UI)
@nareshv - filing the ticket as per your request.
When I go to Cluster Load or Proposals tab from other tabs everything loads and works as intended, but if I refresh the page when I'm on these tabs I get 404 Not Found json message. Same message shows up if I go directly to the address of these pages from browser url bar.

Any ideas why this happens?
I'm using the latest version of CC-UI.
I would like to specify 2 different config.csv files and have CC-UI pick up the appropriate config.csv based on some environment variable (prod/qa). How do I do that ?
Lodash full package is not required, instead use just sortBy method as a different package.
I'm getting the following exception whenever trying to open the cluster state and the admin page.
The error happens only on a slightly larger Kafka cluster (30+ nodes)

is there any workaround to fix it?
The git commit hash I deployed: cf37ebf
I would like to have login enabled for Cruise Control UI . Can someone guide me with details if its possible
I am trying to start the application in a docker container. When I start the app with npm run dev, I get the following error:
npm ERR! code ELIFECYCLE
npm ERR! errno 1
npm ERR! [email protected] start: test -d cruise-control-ui && cd cruise-control-ui; node build/dev-server.js
npm ERR! Exit status 1
npm ERR!
npm ERR! Failed at the [email protected] start script.
npm ERR! This is probably not a problem with npm. There is likely additional logging output above.
npm ERR! A complete log of this run can be found in:
npm ERR! /app/.npm/_logs/2019-03-01T19_28_47_361Z-debug.log
Bootstrap v5 is upcoming, upgrade this app to take advantage of the new framework.
Sometimes CC API sends empty responses due to internal exceptions like #14, its worth capture empty responses on HTTP/200 OK and show appropriate message to the user.
Hi Team,
I am able to run CC on my local machine and able to see data on 9090 for CC but when I deploy CC UI, I end up getting this error. Anything that needs to be done, can you kindly help me out.
Module build failed: Error: No ESLint configuration found.
    at getLocalConfig (/Users/z076952/Documents/Data_movement_git/cruise-control-ui/node_modules/eslint/lib/config.js:162:35)
    at Config.getConfig (/Users/z076952/Documents/Data_movement_git/cruise-control-ui/node_modules/eslint/lib/config.js:260:26)
    at processText (/Users/z076952/Documents/Data_movement_git/cruise-control-ui/node_modules/eslint/lib/cli-engine.js:224:33)
    at CLIEngine.executeOnText (/Users/z076952/Documents/Data_movement_git/cruise-control-ui/node_modules/eslint/lib/cli-engine.js:754:26)
    at lint (/Users/z076952/Documents/Data_movement_git/cruise-control-ui/node_modules/eslint-loader/index.js:218:17)
    at Object.module.exports (/Users/z076952/Documents/Data_movement_git/cruise-control-ui/node_modules/eslint-loader/index.js:213:21)

You may use special comments to disable some warnings.
Use // eslint-disable-next-line to ignore the next line.
Use /* eslint-disable */ to ignore all warnings in a file.
> Listening at http://0.0.0.0:8090```
When I hit CC UI service on 8090, I do get `Cannot GET /`
I am currently working on adding charts based on cruise control APIs to visualise things such as:
Would you be interested in a PR about it? For now we did it in another tool but this could be ported in the CC ui.
See for example:

In some dynamic environments, config.csv changes periodically. Update the code to support this periodic refresh
Latest CCFE uses the User Tasks feature in CC to prevent submitting duplicate request. In an effort to educate the end user, we now show a message where this feature is enabled.
CC backend started to support intra broker disk balance feature which is very neat and useful. the RESTful endpoint looks like this:
/kafkacruisecontrol/rebalance?dryrun=false&rebalance_disk=true
MonitorState: {state: RUNNING(18.400% trained), NumValidWindows: (1/1) (100.000%), NumValidPartitions: 210/210 (100.000%), flawedPartitions: 0}
ExecutorState: {state: NO_TASK_IN_PROGRESS}
AnalyzerState: {isProposalReady: true, readyGoals: [NetworkInboundUsageDistributionGoal, CpuUsageDistributionGoal, PotentialNwOutGoal, NetworkInboundCapacityGoal, LeaderBytesInDistributionGoal, DiskCapacityGoal, ReplicaDistributionGoal, RackAwareGoal, TopicReplicaDistributionGoal, NetworkOutboundCapacityGoal, CpuCapacityGoal, DiskUsageDistributionGoal, NetworkOutboundUsageDistributionGoal, ReplicaCapacityGoal]}
AnomalyDetectorState: {selfHealingEnabled:[GOAL_VIOLATION, METRIC_ANOMALY, BROKER_FAILURE], selfHealingDisabled:[], recentGoalViolations:[], recentBrokerFailures:[], recentMetricAnomalies:[]}
Monitored Windows [Window End_Time=Data_Completeness]:
{1550179500000=100.000%}
Goal Readiness:
RackAwareGoal, (requiredNumWindows=1, minMonitoredPartitionPercentage=0.000, includedAllTopics=true), Ready
ReplicaCapacityGoal, (requiredNumWindows=1, minMonitoredPartitionPercentage=0.000, includedAllTopics=true), Ready
DiskCapacityGoal, (requiredNumWindows=1, minMonitoredPartitionPercentage=0.995, includedAllTopics=true), Ready
NetworkInboundCapacityGoal, (requiredNumWindows=1, minMonitoredPartitionPercentage=0.995, includedAllTopics=true), Ready
NetworkOutboundCapacityGoal, (requiredNumWindows=1, minMonitoredPartitionPercentage=0.995, includedAllTopics=true), Ready
CpuCapacityGoal, (requiredNumWindows=1, minMonitoredPartitionPercentage=0.995, includedAllTopics=true), Ready
ReplicaDistributionGoal, (requiredNumWindows=1, minMonitoredPartitionPercentage=0.000, includedAllTopics=true), Ready
PotentialNwOutGoal, (requiredNumWindows=1, minMonitoredPartitionPercentage=0.995, includedAllTopics=false), Ready
DiskUsageDistributionGoal, (requiredNumWindows=1, minMonitoredPartitionPercentage=0.995, includedAllTopics=true), Ready
NetworkInboundUsageDistributionGoal, (requiredNumWindows=1, minMonitoredPartitionPercentage=0.995, includedAllTopics=false), Ready
NetworkOutboundUsageDistributionGoal, (requiredNumWindows=1, minMonitoredPartitionPercentage=0.995, includedAllTopics=false), Ready
CpuUsageDistributionGoal, (requiredNumWindows=1, minMonitoredPartitionPercentage=0.995, includedAllTopics=false), Ready
TopicReplicaDistributionGoal, (requiredNumWindows=1, minMonitoredPartitionPercentage=0.000, includedAllTopics=true), Ready
LeaderBytesInDistributionGoal, (requiredNumWindows=1, minMonitoredPartitionPercentage=0.995, includedAllTopics=false), Ready
A declarative, efficient, and flexible JavaScript library for building user interfaces.
🖖 Vue.js is a progressive, incrementally-adoptable JavaScript framework for building UI on the web.
TypeScript is a superset of JavaScript that compiles to clean JavaScript output.
An Open Source Machine Learning Framework for Everyone
The Web framework for perfectionists with deadlines.
A PHP framework for web artisans
Bring data to life with SVG, Canvas and HTML. 📊📈🎉
JavaScript (JS) is a lightweight interpreted programming language with first-class functions.
Some thing interesting about web. New door for the world.
A server is a program made to process requests and deliver data to clients.
Machine learning is a way of modeling and interpreting data that allows a piece of software to respond intelligently.
Some thing interesting about visualization, use data art
Some thing interesting about game, make everyone happy.
We are working to build community through open source technology. NB: members must have two-factor auth.
Open source projects and samples from Microsoft.
Google ❤️ Open Source for everyone.
Alibaba Open Source for everyone
Data-Driven Documents codes.
China tencent open source team.
