This Project aims to give you better insight of what's going on your pfSense Firewall. It's based on some heavylifting alrerady done by devopstales and opc40772. Since it still was a bit clumsy and outdated I wrapped some docker-compose glue around it, to make it a little bit easier to get up and running. It should work hasslefree with a current Linux that has docker and docker-compose. Thanks as well to MatthewJSalerno for some Streamlining of the Graylog provisioning Process.
I have recently updated the whole stack to utilize Graylog 4 and Elasticsearch 7 and Grafana 7. I don't include any directions for Upgrading GL3/ES6 to GL4/ES7.
This doc has been tested with the following Versions:
| Component | Version |
|---|---|
| Elasticsearch | 7.11.1 |
| Grafana | 7.4.2 |
| Graylog | 4.0.3 |
| Cerebro | 0.9.3 |
| pfSense | 2.5.0 CE |
If it's easier for you, you can find a video guide here: https://youtu.be/uOfPzueH6MA (Still the Guide for GL3/ES6, will make a new one some day.)
The whole metric approach is split into several subtopics.
| Metric type | Stored via | stored in | Visualisation |
|---|---|---|---|
| pfSense IP Filter Log | Graylog | Elasticsearch | Grafana |
| NTOP DPI Data | NTOP timeseries export | InfluxDB | Grafana |
Optional Succicata/SNORT logs can be pushed to Elasticsearch, Graylog has ready made extractors for this, but currently this is not yet included in this Documentation.
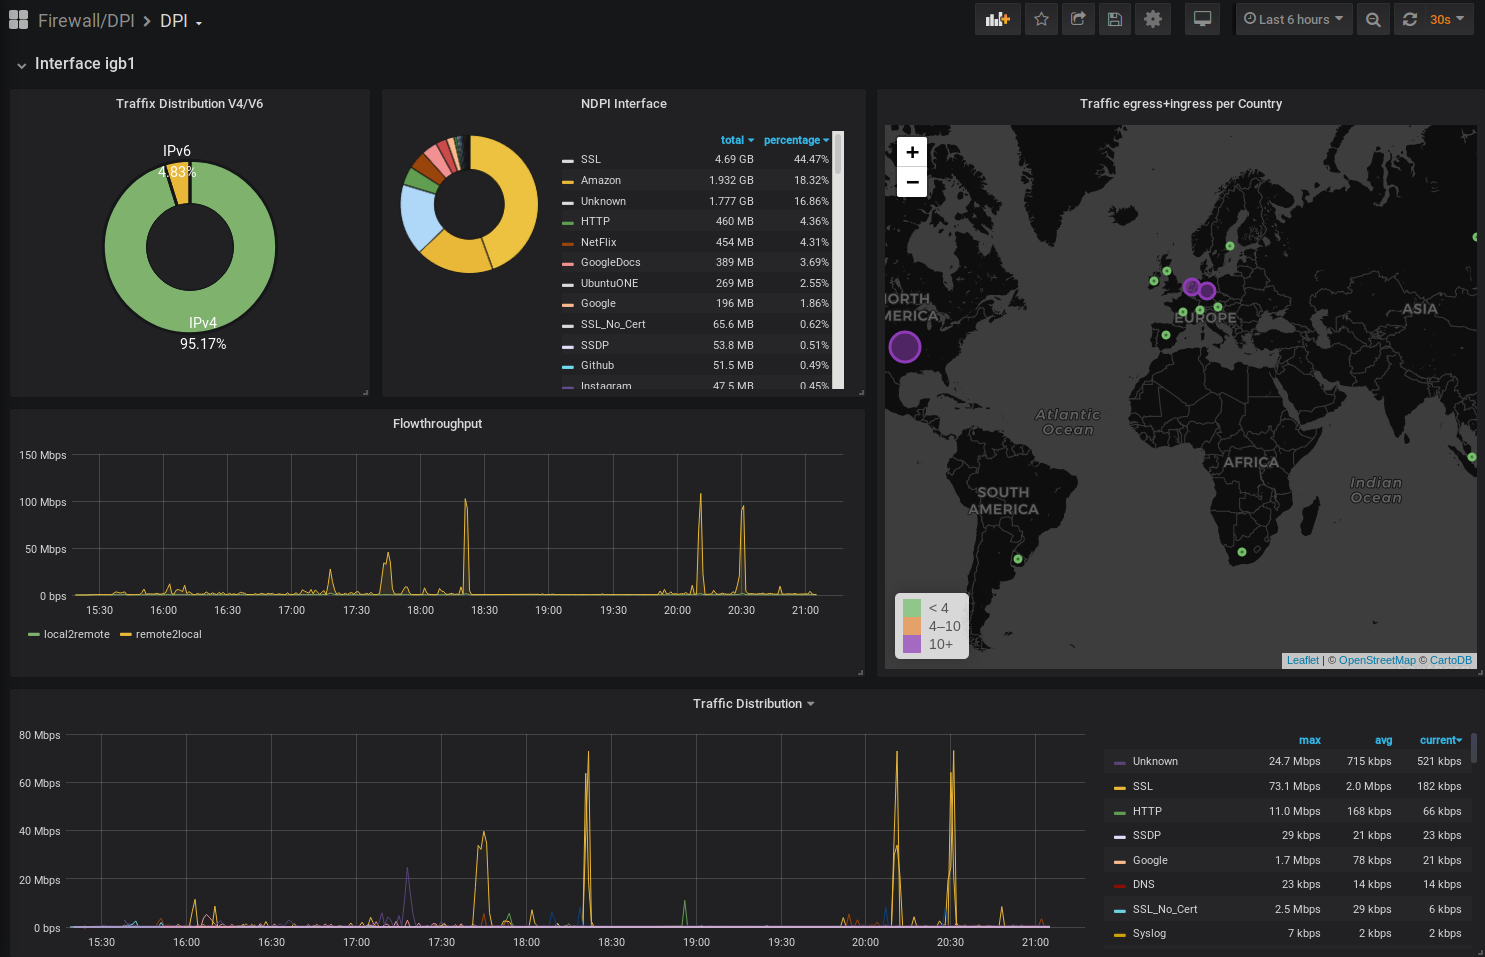
What you get is Eyecandy like this:
DPI Data:
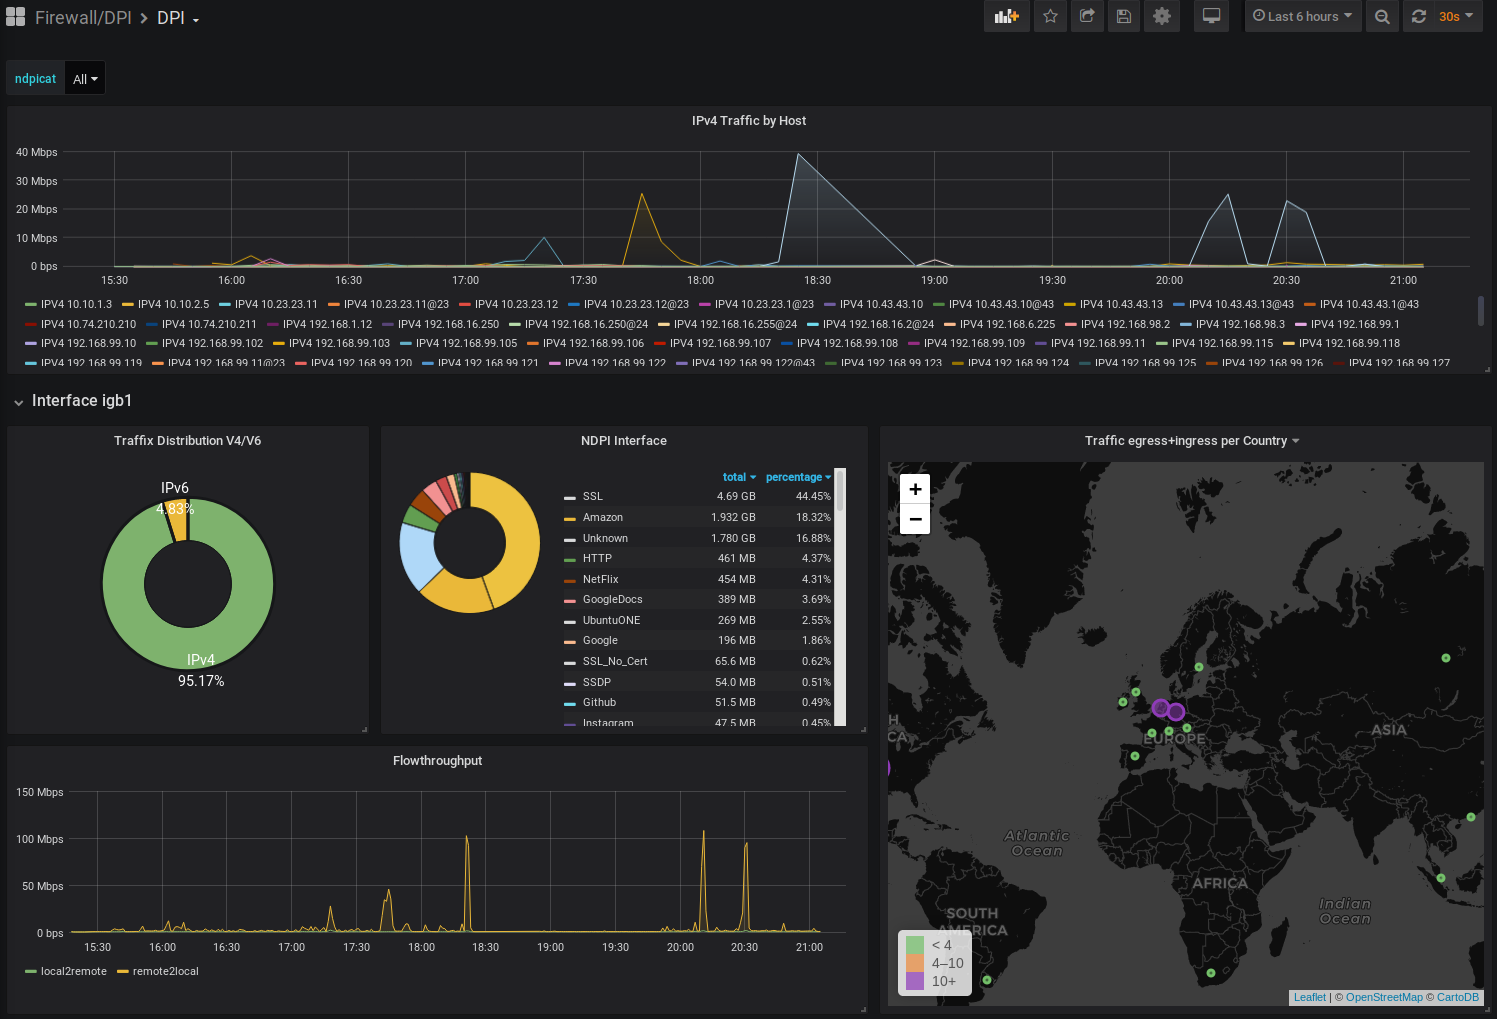
More DPI Data:
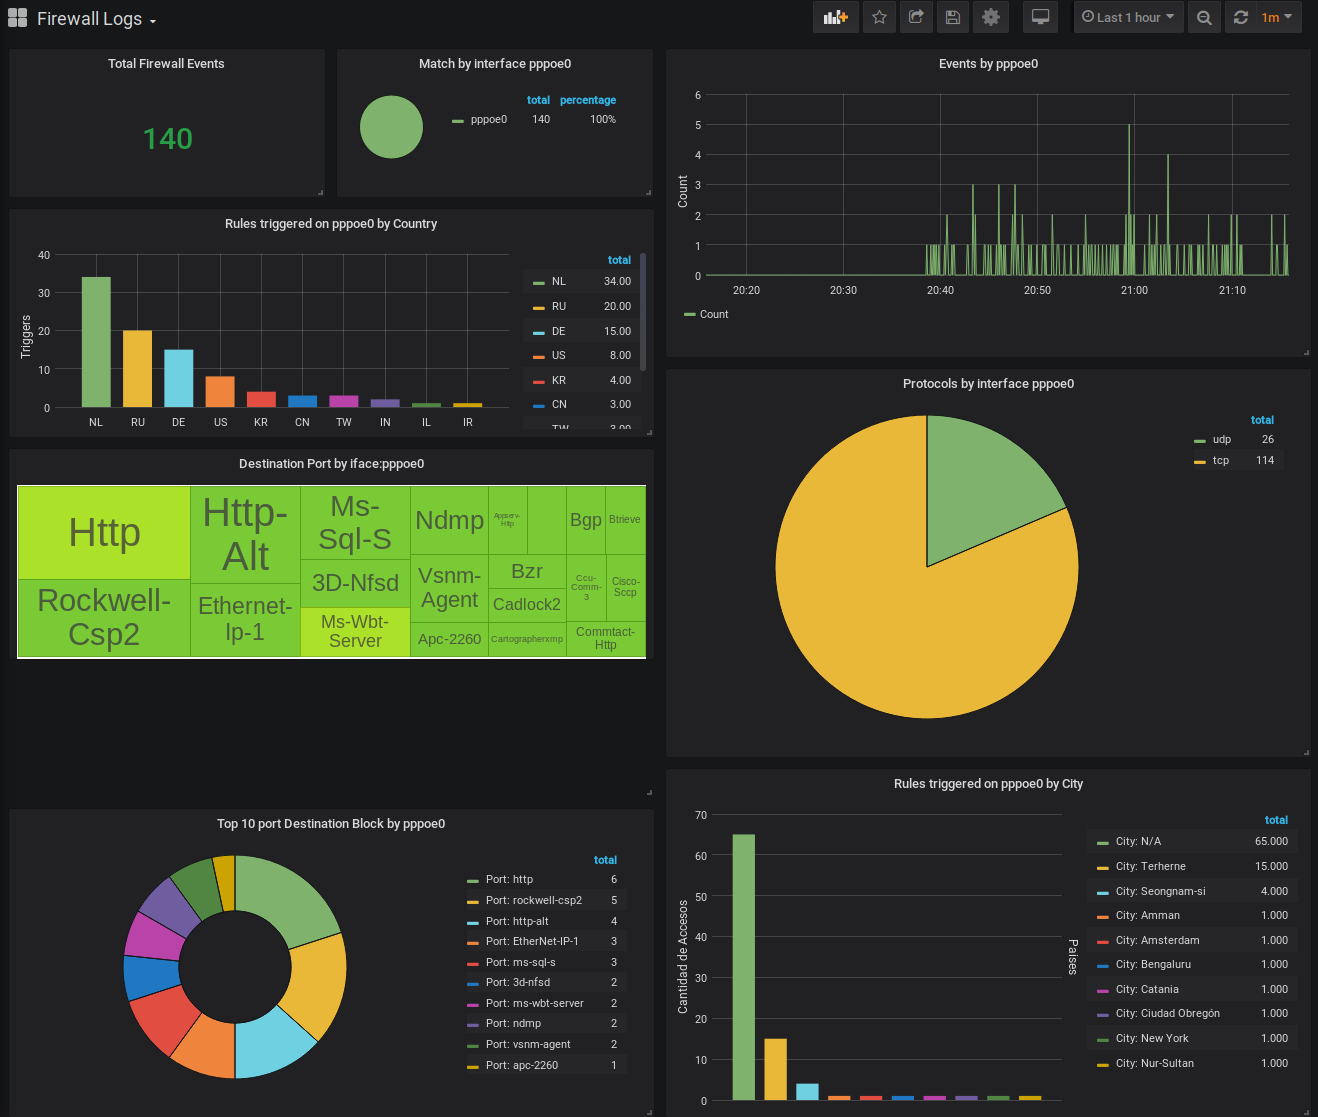
Firewall Insights:
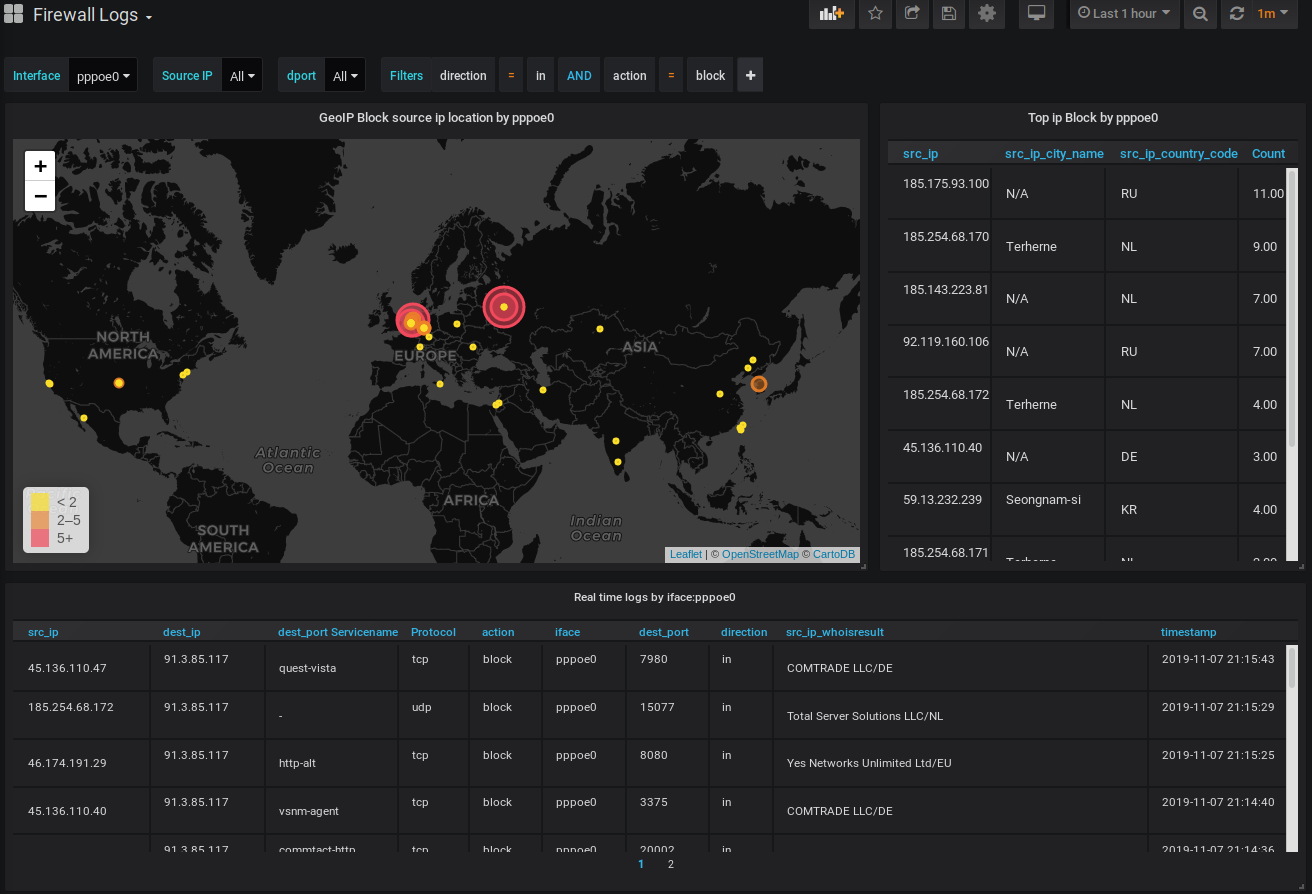
Moar Insights:
This walkthrough has been made with a fresh install of Ubuntu 18.04 Bionic but should work flawless with any debian'ish linux distro.
Since this involves Elasticsearch 7 a few GB of RAM will be required. Don't bother with less than 8GB. It just won't run.
Please install docker, docker-compose and git as basic prerequisite.
sudo apt install docker.io docker-compose git
Let's pull this repo to the Server where you intend to run the Analytics front- and backend.
git clone https://github.com/lephisto/pfsense-analytics.git
cd pfsense-analytics
We have to adjust some Systemlimits to allow Elasticsearch to run:
sudo sysctl -w vm.max_map_count=262144
to make it permanent edit /etc/sysctl.conf and add the line:
vm.max_map_count=262144
Next edit the ./Docker/graylog.env file and set some values:
Set the proper Time Zone: https://en.wikipedia.org/wiki/List_of_tz_database_time_zones
- GRAYLOG_TIMEZONE=Europe/Berlin
The URL you want your graylog to be available under:
- GRAYLOG_HTTP_EXTERNAL_URI (eg: http://localhost:9000)
A salt for encrypting your graylog passwords
- GRAYLOG_PASSWORD_SECRET (Change that now)
Edit Docker/graylog/getGeo.sh and insert your license Key for the Maxmind GeoIP Database. Create an account on https://www.maxmind.com/en/account/login and go to "My Account -> Manage License Keys -> Generate new License key" and copy the that Key to the placeholder in your getGeo.sh File. If you don't do that the geolookup feature for IP Addresses won't work.
Finally, spin up the stack with:
cd ./Docker
sudo docker-compose up -d
Note: graylog will be built the first time you run docker-compose. The below step is only for updating the GeoLite DB. To update the geolite.maxmind.com GeoLite2-City database, simply run:
cd ./Docker
sudo docker-compose up -d --no-deps --build graylog
This should expose you the following services externally:
| Service | URL | Default Login | Purpose |
|---|---|---|---|
| Graylog | http://localhost:9000 | admin/admin | Configure Data Ingestions and Extractors for Log Inforation |
| Grafana | http://localhost:3000 | admin/admin | Draw nice Graphs |
| Kibana | http://localhost:5601/ | none | Default Elastic Data exploratiopn tool. Not required. |
| Cerebro | http://localhost:9001 | none - provide with ES API: http://elasticsearch:9200 | ES Admin tool. Only required for setting up the Index. |
Depending on your hardware a few minutes later you should be able to connect to your Graylog Instance on http://localhost:9000. Let's see if we can login with username "admin", password "admin".
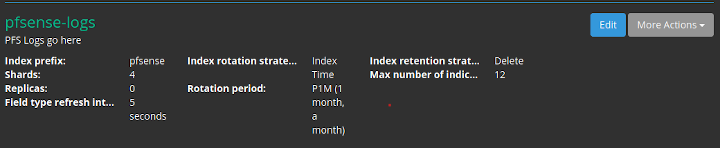
Next we have to create the Index in Elasticsearch for the pfSense logs in System / Indices
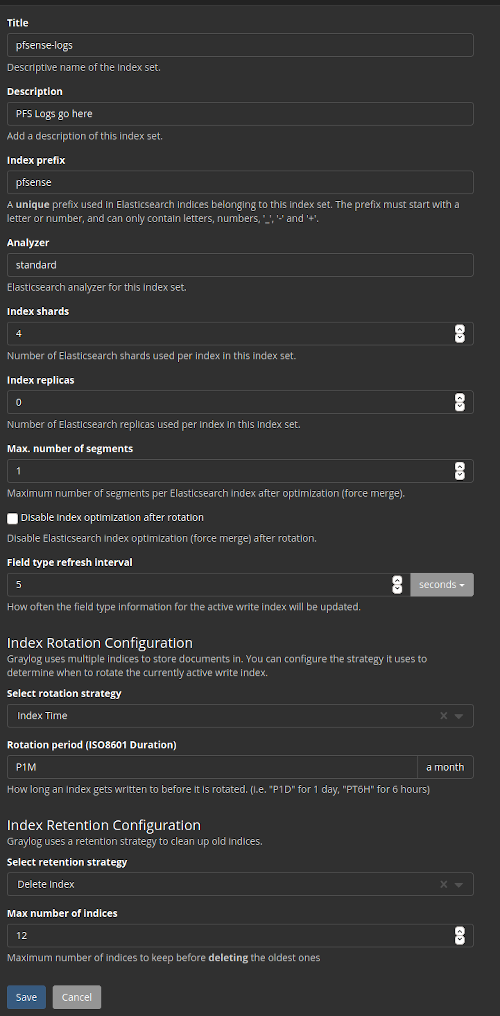
Index shard 4 and Index replicas 0, the rotation of the Index time index and the retention can be deleted, closure of an index according to the maximum number of indices or doing nothing. In my case, I set it to rotate monthly and eliminate the indexes after 12 months. In short there are many ways to establish the rotation. This index is created immediately.
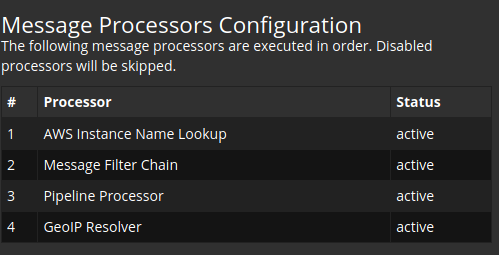
In Graylog go to System->Configurations and:
- Change the order by Message processors, to have the following sequence:
1. AWS Instance Name Lookup
2. Message Filter Chain
3. Pipeline Processor
4. GeoIP Resolver
This should look like:
- In the Plugins section update enable the Geo-Location Processor
This content pack includes Input rsyslog type , extractors, lookup tables, Data adapters for lockup tables and Cache for lookup tables. You could do this manually, but this is preconfigured for what we want, so you don't have to fight with lookups, data adapters etc.
We can take it from the Git directory or sideload it from github to the Workstation you do the deployment on:
Once it's uploaded, press the Install button. If everthing went well it should look like:
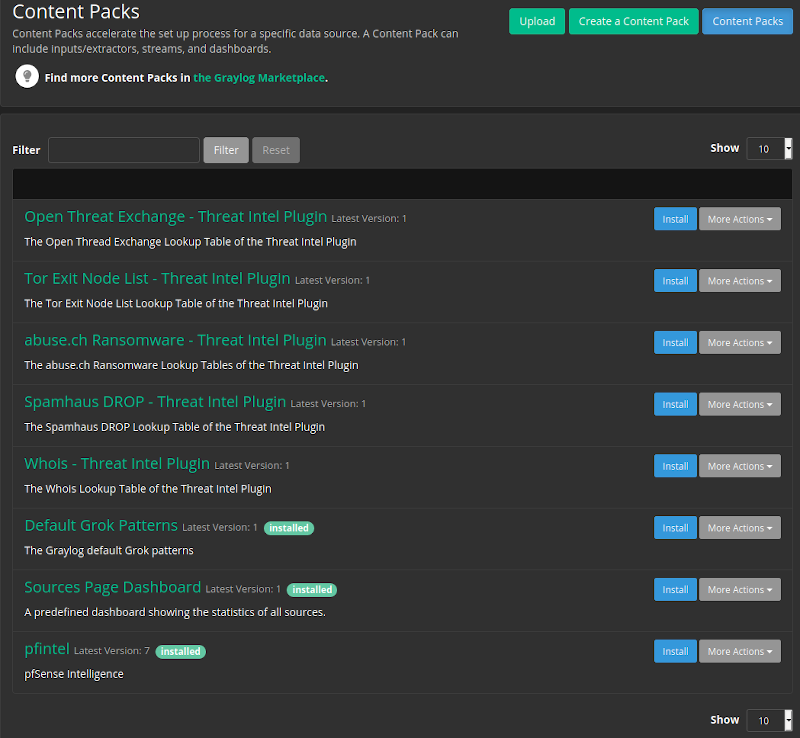
Note the "pfintel" on the bottom of the list.
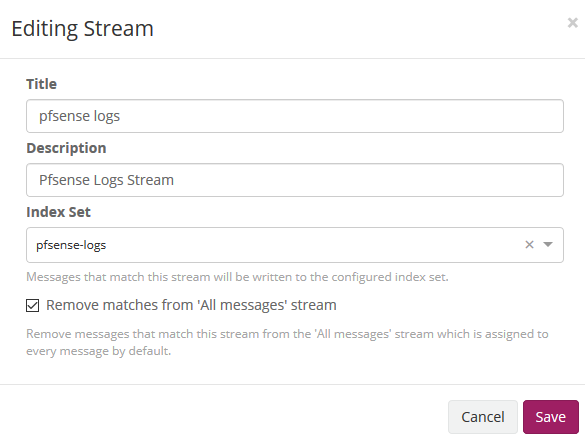
Now edit then Streams: Assign your Index pfsense in Streams to associate the index that we created initially. We mark that it eliminates the coincidences for the default stream 'All message' so that only it stores it in the index of pfsense.
This part might be a little bit confusing, so read carefully!
As previously explained, by default graylog for each index that is created generates its own template and applies it every time the index rotates. If we want our own templates we must create them in the same elasticsearch. We will convert the geo type dest_ip_geolocation and src_ip_geolocation to type geo_point to be used in the World Map panels since graylog does not use this format.
Get the Index Template from the GIT repo you cloned or sideload it from:
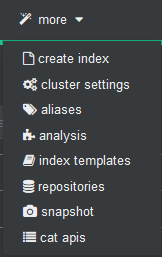
To import personalized template open cerebro and will go to more/index template
We create a new template
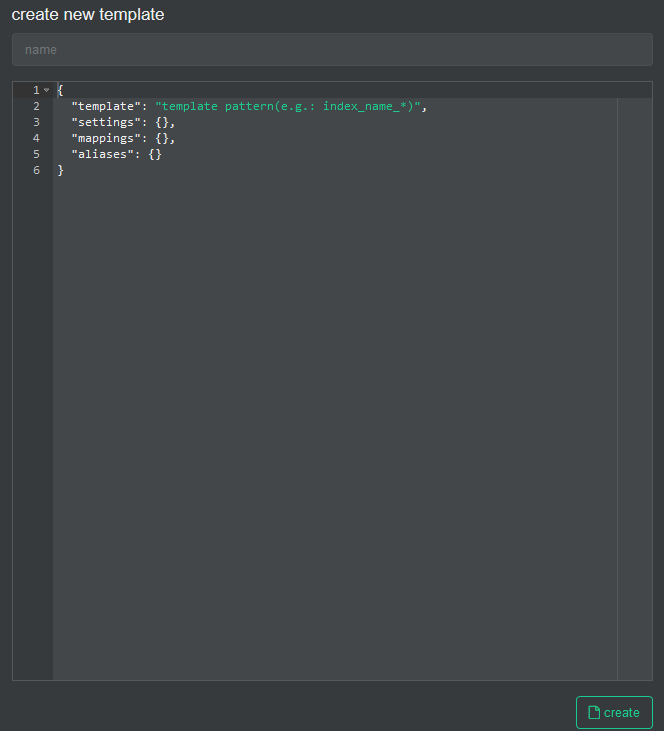
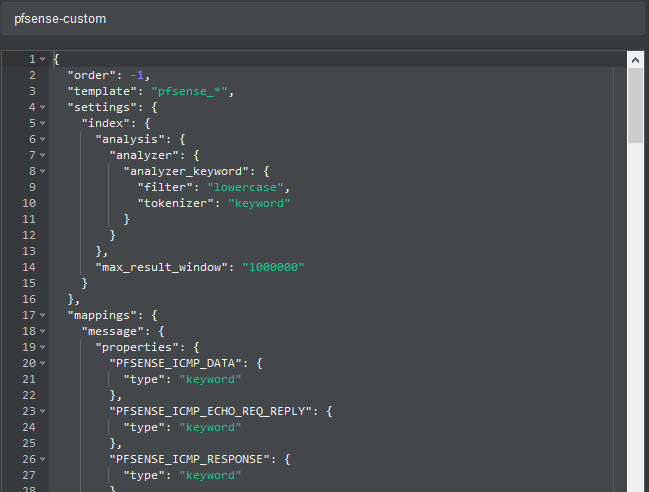
In the name we fill it with pfsense-custom and open the git file that has the template and paste its content here.
And then we press the create button.
!!! IMPORTANT: Now we will stop the graylog service to proceed to eliminate the index through Cerebro.
sudo docker-compose stop graylog
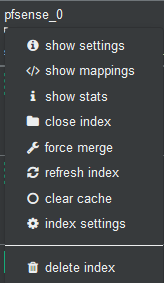
In Cerebro we stand on top of the index and unfold the options and select delete index.
We start the graylog service again and this will recreate the index with this template.
sudo docker-compose start graylog
Once this procedure is done, we don't need Cerebro for daily work, so it could be disable in docker-compose.yml.
We will now prepare Pfsense to send logs to graylog and for this in Status/System Logs/ Settings we will modify the options that will allow us to do so.
We go to the Remote Logging Options section and in Remote lo7g servers we specify the ip address and the port prefixed in the content pack in the pfsense input of graylog that in this case 5442.
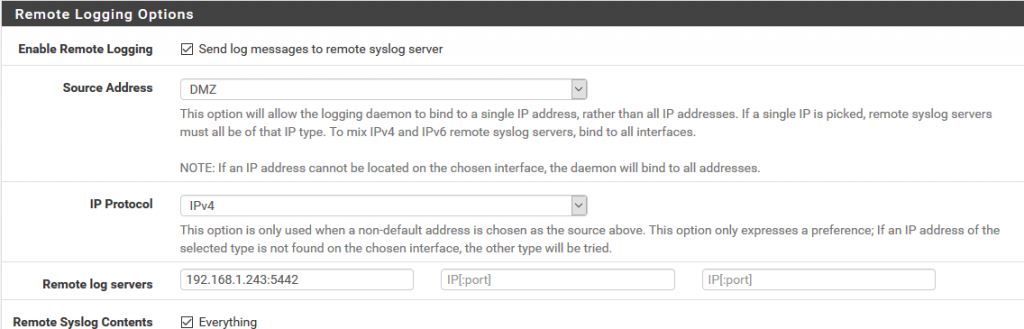
We save the configuration.
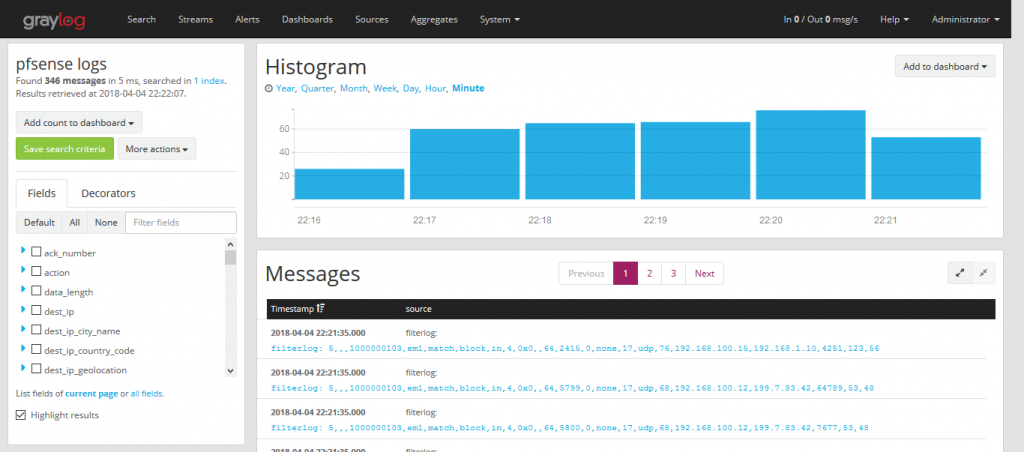
We now go to graylog by selecting the pfsense stream and we will see how it is parsing the log messages creating the fields.
Dashboards and Datasource are auto-provisioned to Grafana. Log in at http://localhost:3000 with admin/admin and you should see your Firewall Logs pouring in.
Now that we have the Firewall logs we want to get some Intel about legit Traffic on our Network.
- On your pfSense go to System->Package Manager->Available Packages and install ntopng.
- Head to Diagnostics -> ntopng Settings and do basic Configuration
- Update GeoIP Data there as well. (Install "PFSENSE-9211: Fix GeoIP DB" if it fails)
- Go to Diagnostics -> ntopng Settings and log in to ntopng
- Go to Settings -> Preferences -> timeseries
Configure according your needs, I propose following Settings:
| Setting | Value | remarks |
|---|---|---|
| Timeseries Driver | InfluxDB | |
| InfluxDB URL | http://yourdockerserverip:8086 | |
| InfluxDB Datebase | ndpi | |
| InfluxDB Authentication | off | unless you have enabled. |
| InfluxDB Storage | 365d | |
| Interface TS: Traffic | on | |
| Interface TS: L7 Applications | per Protocol | |
| Local Host Timeseries: Traffic | on | |
| Local Host Timeseries: L7 Applications | per Protocol | |
| Device Timeseries: Traffic | on | |
| Device Timeseries: L7 Applications | per Category | |
| Device Timeseries: Retention | 30d | |
| Other Timeseries: TCP Flags | off | |
| Other Timeseries: TCP OfO,Lost,Retran | off | |
| Other Timeseries: VLANs | on | |
| Other Timeseries: Autonomous Systems | on | |
| Other Timeseries: Countries | on | |
| Datebase Top Talker Storage | 365d |
Since Cerebro is mainly used for applying a custom Index Template, we don't need it in our daily routine and we can disable it. Edit your docker-compose.yml and remove the comment in the service block for Cerebro:
  cerebro:
    image: lmenezes/cerebro
    entrypoint: ["echo", "Service cerebro disabled"]
No need to restart the whole Stack, just stop Cerebro:
sudo docker-compose stop cerebro
That should do it. Check your DPI Dashboard and enjoy :)


