Statistical Learning Theory
Introduction
This lesson will introduce you to the basics of statistical learning theory and some key components in the framework of this theory. The is particularly important and all the machine learning approaches that we will come across later are built upon the ideas of statistical machine learning.
Objectives
You will be able to:
- Understand and describe the statistical learning theory
- Understand dependent and independent variables as key components of statistical learning approaches
- Give an introduction on model development and model parameters
- Demonstrate a basic understanding of ideas of model loss and model validation
Statistical Learning
Statistical learning theory is a framework for machine learning drawing from the fields of statistics and functional analysis. Statistical learning theory deals with the problem of finding a predictive function based on data. The goal of statistical learning theory is to study, in a statistical framework, the properties of learning algorithms.
Statistical learning theory has led to successful applications in fields such as computer vision, speech recognition, bioinformatics and sports. We shall look at some of these domains in the machine learning module.
So how do we get started on this? what does it involve? Statistical learning refers to tools and techniques that enable us to investigate and understand data in a better way. Let's see what this involves:
Types of data in statistical learning
In the context of Statistical learning, there are two types of data:
- Data that can be controlled directly OR independent variables
- Data that cannot be controlled directly OR dependent variables

Note: There is a third type of variable called a controlled variable used for control/clinical testing. We shall visit that later.
Two examples of common independent variables are age and time. There’s nothing you or anything else can do to speed up or slow down time or increase or decrease age. They’re independent of everything else.
An example of a dependent variable is how much you weigh at different ages. The dependent variable (height) depends on the independent variable (age).
The dependent variable is 'dependent' on the independent variable. As the experimenter changes the independent variable, the effect on the dependent variable is observed and recorded.
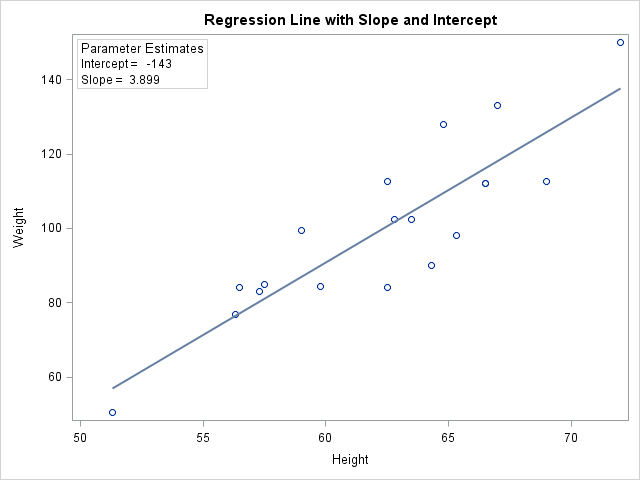
Independent and dependent variables always go on the same places in a graph. This makes it easy for you to quickly see which variable is independent and which is dependent when looking at a graph or chart. The independent variable always goes on the x-axis, or the horizontal axis. For the height weight data that we have been seeing , a scatter plot may look as shown below. Here we have set height as independant and weight as a dependent variable i.d. we want to study if height has some effect on weight:

A Statistical Model
A statistical model can be thought as some kind of a transformation that helps us express dependent variables as a function of independent variables.
SO a model essentially defines a Relationship between a dependent and an independent variable. For the plot we see above, the relationship between height and weight, in its simplest form, can be shown using a straight line connecting all the individual observations in the data. So this line here would be our model as shown.
We can define and fit such a straight line to our data following a straight line equation: y = m * x + b . Such a simple model would simply describes, a person's height has almost a linear relationship with weight i.e. weight increases with height.
So this is our simple model for the relationship. Of course we can use more sophisticated models like quadratic equations or polynomial equations for a better fit, and we shall see that with advanced modeling techniques. Let's get back to our plain old straight line for now.
Looking at this line above, we can define is as Weight = -143 + 3.9 * Height, based on slope(m) and intercept(c) values for y = mx+ b.
This would be our model, which can help us work out a weight value for a given height OR in some cases you may put to change the orientation of data and try to predict height based on an individual's weight. That's all got to do with the question you are trying to ask.
A model is expressed as a mathematical equation showing the relationship between dependent and independent variables.
Model Parameters
Every model Parameters are the co-efficients of the model equation for estimating the output. Statistical Learning is all about learning these parameters. A statistical learning approach would help us learn these parameters so we have a clear description of their relationship which we can replicate and analyze under different circumstances.
For the straight line above, we need to learn the slope and intercept for a line that best describes the relationship between the data elements. So in the formula below:

Once we have learned the m and b values, we can predict a value of y (weight in our example) for a given value of x (the height above). In our next lab, we shall see how to calculate these for a given dataset.
An example
What determines an individual's income? If we suppose that income is a a function of one’s years of education and years of experience. A model that estimates the income could look like:
$income = m_0 . education + m_1 . experience + b$
Education and experience are Independent variables. These controllable variables are also called as features of the model.
Income is uncontrollable variable. It is a dependent variable, also known as a target.
Model Validation
Data is finite.
The available data needs to be used very efficiently to build and validate a model.
Here is a brief introduction to validation, in its simplest form:
-
Split the data into two parts.
-
Use one part for training so the model learns from it. This set of data is normally called the Training Data
-
Use the other part for testing the model. This is data is kept away from the model during learning process and used only for testing the performance of a learned model. This dataset is called as the Testing Data.
This setup looks like as shown below:

In statistical learning, if the model has learned well from the training data, it will perform well on the test data and that would be our measure of accuracy. It is assessed based on how close it has estimated the output to the actual value.
Loss Functions
A loss function method of evaluating how well your model represents the relationship between data variables.
If the model can not figure out the underlying relationship between independent and dependent variable(s), the loss function outputs a higher number. If the relationship is well modeled, the loss function will be a lower value. As you change parameters of your model to try and improve results, your loss function is your best friend, telling you if you are on the right track. Below is an example loss function which calculates a loss for fitting straight line to set of variables (as in our case above). The function tries to measure the distance between data points and line to measure the level of LOSS.

We shall go into details of this particular loss function in upcoming lessons. In fact, we can design our own (very) basic loss function to further explain how it works.
Summary
In this lesson we briefly looked at statistical learning theory and its main components. We looked at what a statistical model is and what the model parameters. We looked at this in context of most simple model, a straight line. Next we shall see the "Learning" part of statistical learning theory by learning learning slope and intercept parameters of a straight line.


