Phase 2 Project Description
It's time for your second project!
Project Overview
For this project, you will use exploratory data analysis to generate insights for a business stakeholder.
Business Problem
Microsoft sees all the big companies creating original video content and they want to get in on the fun. They have decided to create a new movie studio, but they don’t know anything about creating movies. You are charged with exploring what types of films are currently doing the best at the box office. You must then translate those findings into actionable insights that the head of Microsoft's new movie studio can use to help decide what type of films to create.
The Data
In the folder zippedData are movie datasets from:
Because it was collected from various locations, the different files have different formats. Some are compressed CSV (comma-separated values) or TSV (tab-separated values) files that can be opened using spreadsheet software or pd.read_csv, while the data from IMDB is located in a SQLite database.
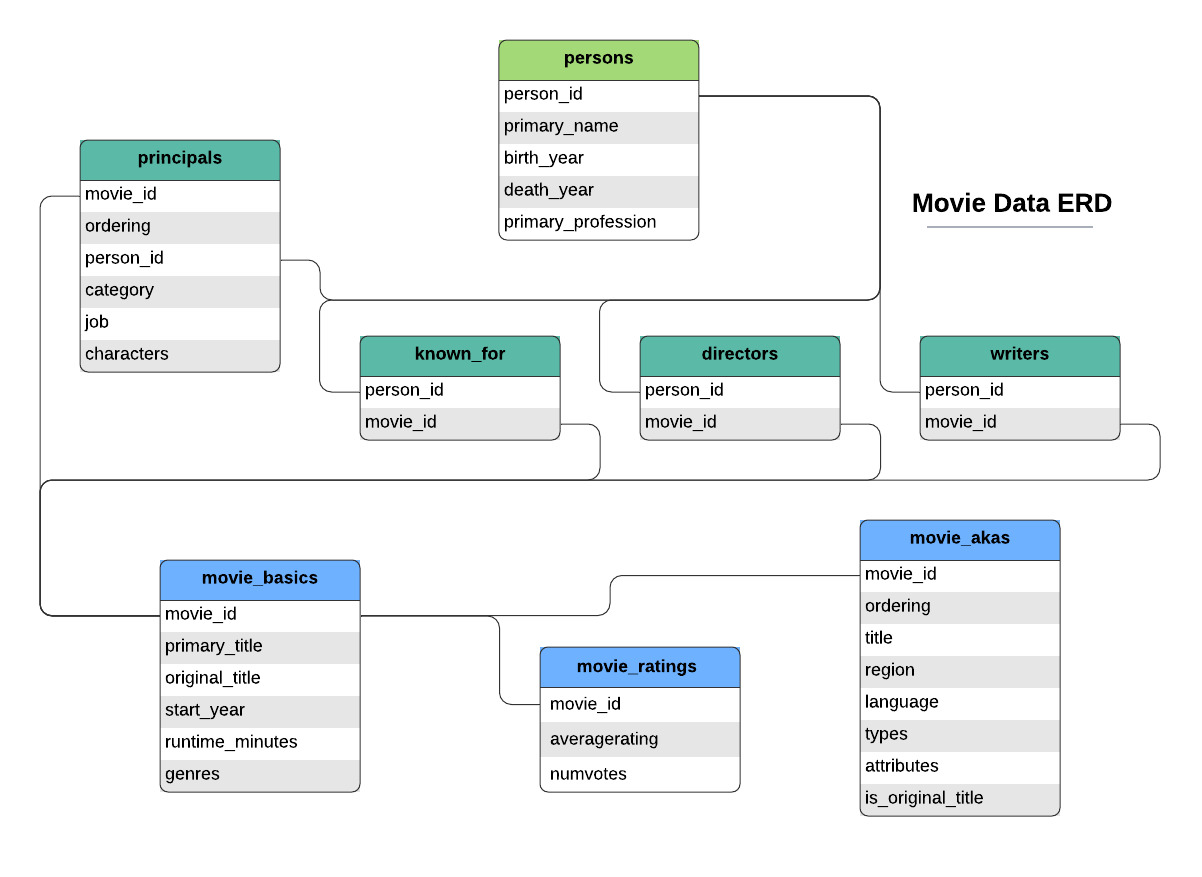
Note that the above diagram shows ONLY the IMDB data. You will need to look carefully at the features to figure out how the IMDB data relates to the other provided data files.
It is up to you to decide what data from this to use and how to use it. If you want to make this more challenging, you can scrape websites or make API calls to get additional data. If you are feeling overwhelmed or behind, we recommend you use only the following data files:
im.db.zip- Zipped SQLite database (you will need to unzip then query using SQLite)
movie_basicsandmovie_ratingstables are most relevant
bom.movie_gross.csv.gz- Compressed CSV file (you can open without expanding the file using
pd.read_csv)
- Compressed CSV file (you can open without expanding the file using
Key Points
-
Your analysis should yield three concrete business recommendations. The ultimate purpose of exploratory analysis is not just to learn about the data, but to help an organization perform better. Explicitly relate your findings to business needs by recommending actions that you think the business (Microsoft) should take.
-
Communicating about your work well is extremely important. Your ability to provide value to an organization - or to land a job there - is directly reliant on your ability to communicate with them about what you have done and why it is valuable. Create a storyline your audience (the head of Microsoft's new movie studio) can follow by walking them through the steps of your process, highlighting the most important points and skipping over the rest.
-
Use plenty of visualizations. Visualizations are invaluable for exploring your data and making your findings accessible to a non-technical audience. Spotlight visuals in your presentation, but only ones that relate directly to your recommendations. Simple visuals are usually best (e.g. bar charts and line graphs), and don't forget to format them well (e.g. labels, titles).
Deliverables
There are two deliverables for this project:
- A non-technical presentation (slides and video)
- A Jupyter Notebook
Non-Technical Presentation
The non-technical presentation is a slide deck presenting your analysis to business stakeholders.
- Non-technical does not mean that you should avoid mentioning the technologies or techniques that you used, it means that you should explain any mentions of these technologies and avoid assuming that your audience is already familiar with them.
- Business stakeholders means that the audience for your presentation is Microsoft, not the class or teacher. Do not assume that they are already familiar with the specific business problem, but also do not explain to them what Microsoft is.
The presentation describes the project goals, data, methods, and results. It must include at least three visualizations which correspond to three business recommendations.
We recommend that you follow this structure, although the slide titles should be specific to your project:
- Beginning
- Overview
- Business Understanding
- Middle
- Data Understanding
- Data Analysis
- End
- Recommendations
- Next Steps
- Thank You
- This slide should include your contact information (name and LinkedIn profile)
The graded elements of the presentation are:
- Presentation Content
- Slide Style
- Presentation Delivery
- Data Communication
See the Grading section for further explanation of these elements.
For further reading on creating professional presentations, check out:
Creating Non-Technical Presentation Deliverables
You will submit your slides in PDF format as well as a video recording of yourself giving the presentation.
Presentation Slides PDF Creation: Software for creating slide decks should have an option to save or export as a PDF. For example, on Google Slides this is located at File --> Download --> PDF Document (.pdf). You can use whichever software you prefer (Google Slides, PowerPoint, Keynote, etc.) and you are responsible for figuring out how to create the PDF export if using software other than Google Slides.
Presentation Video Creation: Zoom is useful for video meetings, but is also useful for recording a presentation! See these instructions for more information. You can use whichever software you prefer to create the recording, so long as you are able to create a 5-8 minute recording that shows your screen and records your voice, is under 500 MB, and is formatted as 3GP, ASF, AVI, FLV, M4V, MOV, MP4, MPEG, QT, or WMV.
Jupyter Notebook
The Jupyter Notebook is a notebook that uses Python and Markdown to present your analysis to a data science audience.
- Python and Markdown means that you need to construct an integrated
.ipynbfile with Markdown (headings, paragraphs, links, lists, etc.) and Python code to create a well-organized, skim-able document.- The notebook kernel should be restarted and all cells run before submission, to ensure that all code is runnable in order.
- Markdown should be used to frame the project with a clear introduction and conclusion, as well as introducing each of the required elements.
- Data science audience means that you can assume basic data science proficiency in the person reading your notebook. This differs from the non-technical presentation.
Along with the presentation, the notebook also describes the project goals, data, methods, and results. It must include at least three visualizations which correspond to three business recommendations.
You will submit the notebook in PDF format on Canvas.
The graded elements for the Jupyter Notebook are:
- Business Understanding
- Data Understanding
- Data Preparation
- Authoring Jupyter Notebooks
- Data Manipulation and Analysis with
pandas
See the Grading section for further explanation of these elements.
Grading
This project has a combination of Complete/Incomplete rubric items and rubric items graded on a scale from "Exceeds Objective" down to "Does Not Meet Objective".
Complete/Incomplete Rubric Items
These items will be graded as Complete/Incomplete:
- Presentation Content
- Slide Style
- Presentation Delivery
- Business Understanding
- Data Understanding
- Data Preparation
1. Presentation Content
This is graded based on the PDF submission of the presentation.
This element assesses the content of the non-technical presentation of a student’s project. Presentations are evaluated based on how clearly they demonstrate the value of the project to the business stakeholders.
- The intended audience is the project’s business stakeholders, not the class or teacher
- Presentations should aim to persuade stakeholders to value the project, not just describe it
- This element assesses the content of a presentation, not the delivery of it
- Content refers to the words and pictures describing the project
- Delivery refers to the manner in which those words and pictures are conveyed to an audience
- This element assesses the demonstration of a project’s value, not the value itself
Ideally, a presentation clearly demonstrates the value of the project to stakeholders by:
- Using plain language and clear visuals accessible to non-technical stakeholders
- Describing the project goals, data, methods, and results
- Explicitly connecting the descriptions of the project to stakeholder needs
- Having a distinct introduction and conclusion
2. Slide Style
This is graded based on the PDF submission of the presentation.
This element assesses the style of a student’s slides. Slides are evaluated based on how well the style enables the presenter to communicate with an audience and the audience to access the content.
- Style includes all visual elements, such as layout, colors, and fonts
- Style should match the expectations of a professional business presentation
3. Presentation Delivery
This is graded based on the video recording of the presentation.
This element assesses the delivery of the non-technical presentation of a student’s project. Presentations are evaluated based on how well the delivery of the presentation engaged the project’s business stakeholders in understanding the content.
- Presentations should engage stakeholders by talking about the project’s value to them
- The intended audience is the project’s business stakeholders, not the class or teacher
- This element assesses the delivery of a presentation, not the content of it
- Content refers to the words and pictures describing the project
- Delivery refers to the manner in which those words and pictures are conveyed to an audience
Ideally, you deliver your presentation clearly and engagingly by:
- Describing your project simply and succinctly in 5-8 minutes
- Using pauses and emphasis while speaking at a moderate volume and pace
- Being sensitive to the knowledge level of your audience, using plain language where possible
4. Business Understanding
This is graded based on the notebook PDF submission.
This element assesses how well students explain the value of their projects. We frame value in terms of the problems and stakeholders that are the focus of the project.
- Students must explain how their projects address a real-world problem
- In Phase 2, the problem basics are provided in the project description
- A real-world problem is an actual problem faced by an actual stakeholder
- A stakeholder is a specific individual, group of people, or organization
- A problem is a challenge faced by a stakeholder in pursuit of some goal
- A real-world problem is one that exists in reality, i.e. students could present the project to an actual human being and they could actually find value in it.
- This element assesses the explanation of a project’s value, not the value itself
5. Data Understanding
This is graded based on the notebook PDF submission.
This element assesses how well students demonstrate the utility of their data for helping solve a business problem. We frame utility in terms of the properties, source, and business relevance of the data.
- Students must show how the data are useful for addressing a real-world problem. See the Business Understanding section for an extended explanation of the terminology.
- Describe the data sources and explain why the data are suitable for the project
- Present the size of the dataset and descriptive statistics for all features used in the analysis
- Justify the inclusion of features based on their properties and relevance for the project
- Identify any limitations of the data that have implications for the project
6. Data Preparation
This is graded based on the notebook PDF submission.
This element assesses how well students prepare their data for analysis. Good data preparation is reproducible, well-documented, and justified.
- Data preparation is reproducible if a third party with the same data access could get the same results using the code in the notebook
- A data preparation step is justifiable if there could be a valid rationale for how that step makes the data better suited for analyses that will address the real-world problem
- Data preparation is well-documented if it includes enough code comments and explanatory text for a third party to easily understand the steps that were taken and their justifications
Ideally, the notebook shows how you prepare your data and explains why by including:
- Code needed to get and prepare the raw data for analysis
- Code comments and text to explain what your data preparation code does
- Valid justifications for why the steps you took are appropriate for the problem you are solving
3-Point Graded Rubric Items
These items will be graded on a scale from "Exceeds Objective" to "Does Not Meet Objective". They are:
- Data Communication
- Authoring Jupyter Notebooks
- Data Manipulation and Analysis with
pandas
Data Communication
Communication is a key "soft skill". In a recent survey, 46% of hiring managers said that recent college grads were missing this skill.
Because "communication" can encompass such a wide range of contexts and skills, we will specifically focus our Phase 2 objective on Data Communication. We define Data Communication as:
Communicating basic data analysis results to diverse audiences via writing and live presentation
To further define some of these terms:
- By "basic data analysis" we mean that you are filtering, sorting, grouping, and/or aggregating the data in order to answer business questions. This project does not involve inferential statistics or machine learning, although descriptive statistics such as measures of central tendency are encouraged.
- By "results" we mean your three visualizations and recommendations.
- By "diverse audiences" we mean that your presentation and notebook are appropriately addressing a business and data science audience, respectively.
Below are the definitions of each rubric level for this objective. This information is also summarized in the rubric, which is attached to the project submission assignment.
Exceeds Objective
Creates and describes appropriate visualizations for given business questions, where each visualization fulfills all elements of the checklist
This checklist means that the visualizations:
- Help the project stakeholder understand the value or success of the project
- Have text and marks to aid reader interpretation, such as graph and axis titles, axis ticks and labels, or legend (varies by visualization type)
- Use color, size, and/or location to appropriately facilitate comparisons
- Are not cluttered, dense, or illegible
Meets Objective
Creates and describes appropriate visualizations for given business questions
This objective can be met even if all checklist elements are not fulfilled. For example, if there is some illegible text in one of your visualizations, you can still meet this objective
Approaching Objective
Creates visualizations that are not related to the business questions, or uses an inappropriate type of visualization
Even if you create very compelling visualizations, you cannot pass this objective if the visualizations are not related to the business questions
An example of an inappropriate type of visualization would be using a line graph to show the correlation between two independent variables, when a scatter plot would be more appropriate
Does Not Meet Objective
Does not submit the required number of visualizations
Authoring Jupyter Notebooks
According to Kaggle's 2020 State of Data Science and Machine Learning Survey, 74.1% of data scientists use a Jupyter development environment, which is more than twice the percentage of the next-most-popular IDE, Visual Studio Code. Jupyter Notebooks allow for reproducible, skim-able code documents for a data science audience. Comfort and skill with authoring Jupyter Notebooks will prepare you for job interviews, take-home challenges, and on-the-job tasks as a data scientist.
The key feature that distinguishes authoring Jupyter Notebooks from simply writing Python code is the fact that Markdown cells are integrated into the notebook along with the Python cells in a notebook. You have seen examples of this throughout the curriculum, but now it's time for you to practice this yourself!
Below are the definitions of each rubric level for this objective. This information is also summarized in the rubric, which is attached to the project submission assignment.
Exceeds Objective
Uses Markdown and code comments to create a well-organized, skim-able document that follows all best practices
Refer to the repository readability reading for more tips on best practices
Meets Objective
Uses some Markdown to create an organized notebook, with an introduction at the top and a conclusion at the bottom
Approaching Objective
Uses Markdown cells to organize, but either uses only headers and does not provide any explanations or justifications, or uses only plaintext without any headers to segment out sections of the notebook
Headers in Markdown are delineated with one or more
#s at the start of the line. You should have a mixture of headers and plaintext (text where the line does not start with#)
Does Not Meet Objective
Does not submit a notebook, or does not use Markdown cells at all to organize the notebook
Data Manipulation and Analysis with pandas
pandas is a very popular data manipulation library, with over 2 million downloads on Anaconda (conda install pandas) and over 19 million downloads on PyPI (pip install pandas) at the time of this writing. In our own internal data, we see that the overwhelming majority of Flatiron School DS grads use pandas on the job in some capacity.
Unlike in base Python, where the Zen of Python says "There should be one-- and preferably only one --obvious way to do it", there is often more than one valid way to do something in pandas. However there are still more efficient and less efficient ways to use it. Specifically, the best pandas code is performant and idiomatic.
Performant pandas code utilizes methods and broadcasting rather than user-defined functions or for loops. For example, if you need to strip whitespace from a column containing string data, the best approach would be to use the pandas.Series.str.strip method rather than writing your own function or writing a loop. Or if you want to multiply everything in a column by 100, the best approach would be to use broadcasting (e.g. df["column_name"] * 100) instead of a function or loop. You can still write your own functions if needed, but only after checking that there isn't a built-in way to do it.
Idiomatic pandas code has variable names that are meaningful words or abbreviations in English, that are related to the purpose of the variables. You can still use df as the name of your DataFrame if there is only one main DataFrame you are working with, but as soon as you are merging multiple DataFrames or taking a subset of a DataFrame, you should use meaningful names. For example, df2 would not be an idiomatic name, but movies_and_reviews could be.
We also recommend that you rename all DataFrame columns so that their meanings are more understandable, although it is fine to have acronyms. For example, "col1" would not be an idiomatic name, but "USD" could be.
Below are the definitions of each rubric level for this objective. This information is also summarized in the rubric, which is attached to the project submission assignment.
Exceeds Objective
Uses pandas to prepare data and answer business questions in an idiomatic, performant way
Meets Objective
Successfully uses pandas to prepare data in order to answer business questions
This includes projects that occasionally use base Python when
pandasmethods would be more appropriate (such as usingenumerate()on a DataFrame), or occasionally performs operations that do not appear to have any relevance to the business questions
Approaching Objective
Uses pandas to prepare data, but makes significant errors
Examples of significant errors include: the result presented does not actually answer the stated question, the code produces errors, the code consistently uses base Python when
pandasmethods would be more appropriate, or the submitted notebook contains significant quantities of code that is unrelated to the presented analysis (such as copy/pasted code from the curriculum or StackOverflow)
Does Not Meet Objective
Unable to prepare data using pandas
This includes projects that successfully answer the business questions, but do not use
pandas(e.g. use only base Python, or use some other tool like R, Tableau, or Excel)
Getting Started
Use the link at the bottom of this assignment to open the project folder in IllumiDesk. This folder contains:
zippedData: This is a directory containing all of the compressed data files you need for the project.- Look in this directory to find the names of the files when you want to open them with
pandas
- Look in this directory to find the names of the files when you want to open them with
exploratory.ipynb: This is the notebook where you should perform all of your data exploration.- It's fine for this notebook to contain broken code or hard-to-read plots; think of it as your "scratch paper".
- We have included some starter code in this notebook, but make sure you look at all of the files in
zippedData, not just the ones used in the starter code. - Work in this notebook until you are ready to start assembling your final report notebook.
final.ipynb: This is the final report notebook.- Once you have a finding (visualization + explanation) in
exploratory.ipynbthat you want to include in the final report notebook, copy those code and Markdown cells over tofinal.ipynb. - You will need to include import statements in
final.ipynbfor any packages that you use (pandas, SQLite, Matplotlib, etc.) - When you are ready to submit the notebook, make sure you restart the kernel and run all cells to make sure that everything runs in order. Then download the notebook as a PDF for submission.
- Once you have a finding (visualization + explanation) in
Summary
This project pulls together everything that you have learned so far. Let's do it!


