
- https://github.com/zappingseb/shiny_animatedbar
- https://github.com/zappingseb/shinycandlestick
- https://github.com/zappingseb/stravachaserapp
This shiny app allows to compare how fast people cycle in your city. This app uses data from strava to compare the cyclists in two cities. How is this possible? Strava is a sports tracking app. Basically whenever people cycle they can track themselves using GPS. Afterwards they will know how fast they went on their track. This is not comparable. Though, strava build in a feature called segments. These segments are tracks of any length all around the world. On each of these segments strava the users can have a virtual race. The time they needed for the segment is stored on a leaderboard. The fastest cyclist is the King of the Mountain on this segment. The data is available for everybody having a strava account via the strava API. This package ( + app) includes the data and allows to crawl it by certain features. A short summary of the data is given here:
| cities                            | 4          |
| segments                          | 421,685    |
| segments with average speed       | 22,589     |
| Average speed per segment         | 28.76 km/h |
| Average speed per segment (men)   | 32.7 km/h  |
| Average speed per segment (women) | 23.49 km/h |
| Average length of a segment       | 2162.3 m   |
| Variables measured per segment    | 23         |
What the app can do will be shown in the next section. To read more about the process of how to get the data, just start the app on shinyapps.io and go to the "About" section.
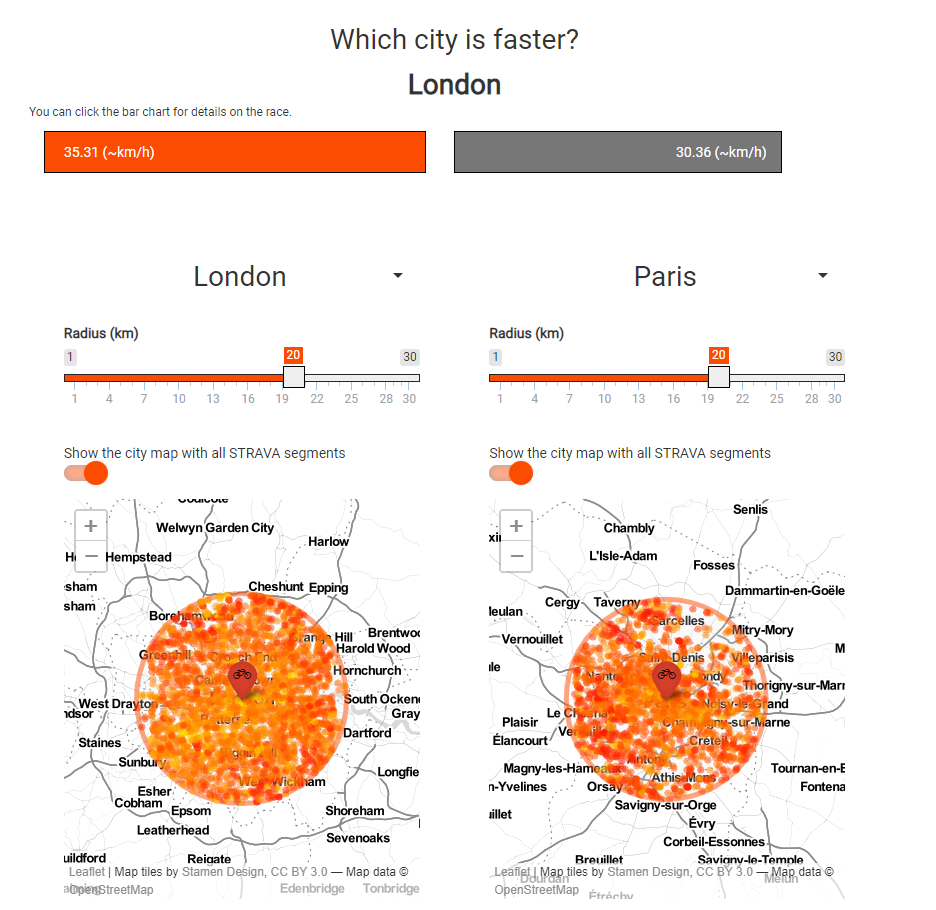
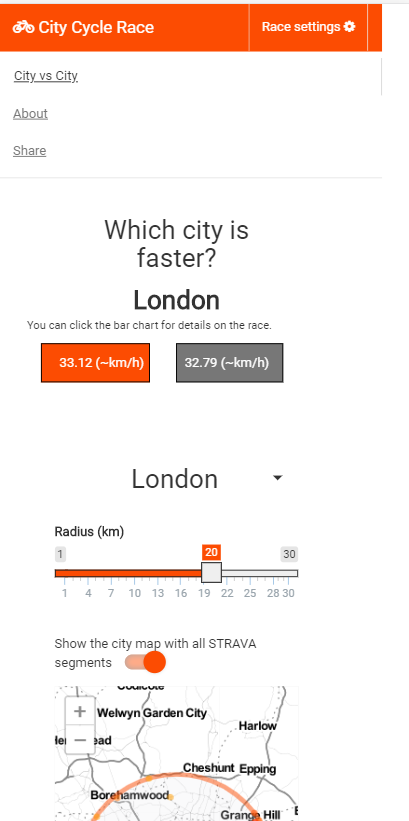
The app now first allows to select a city by radius and see the segments in a map. The map highlights each segment by the average speed on the segment. The city radius gets drawn into the map such that you can see how much of e.g. London you covered with 20 km radius.
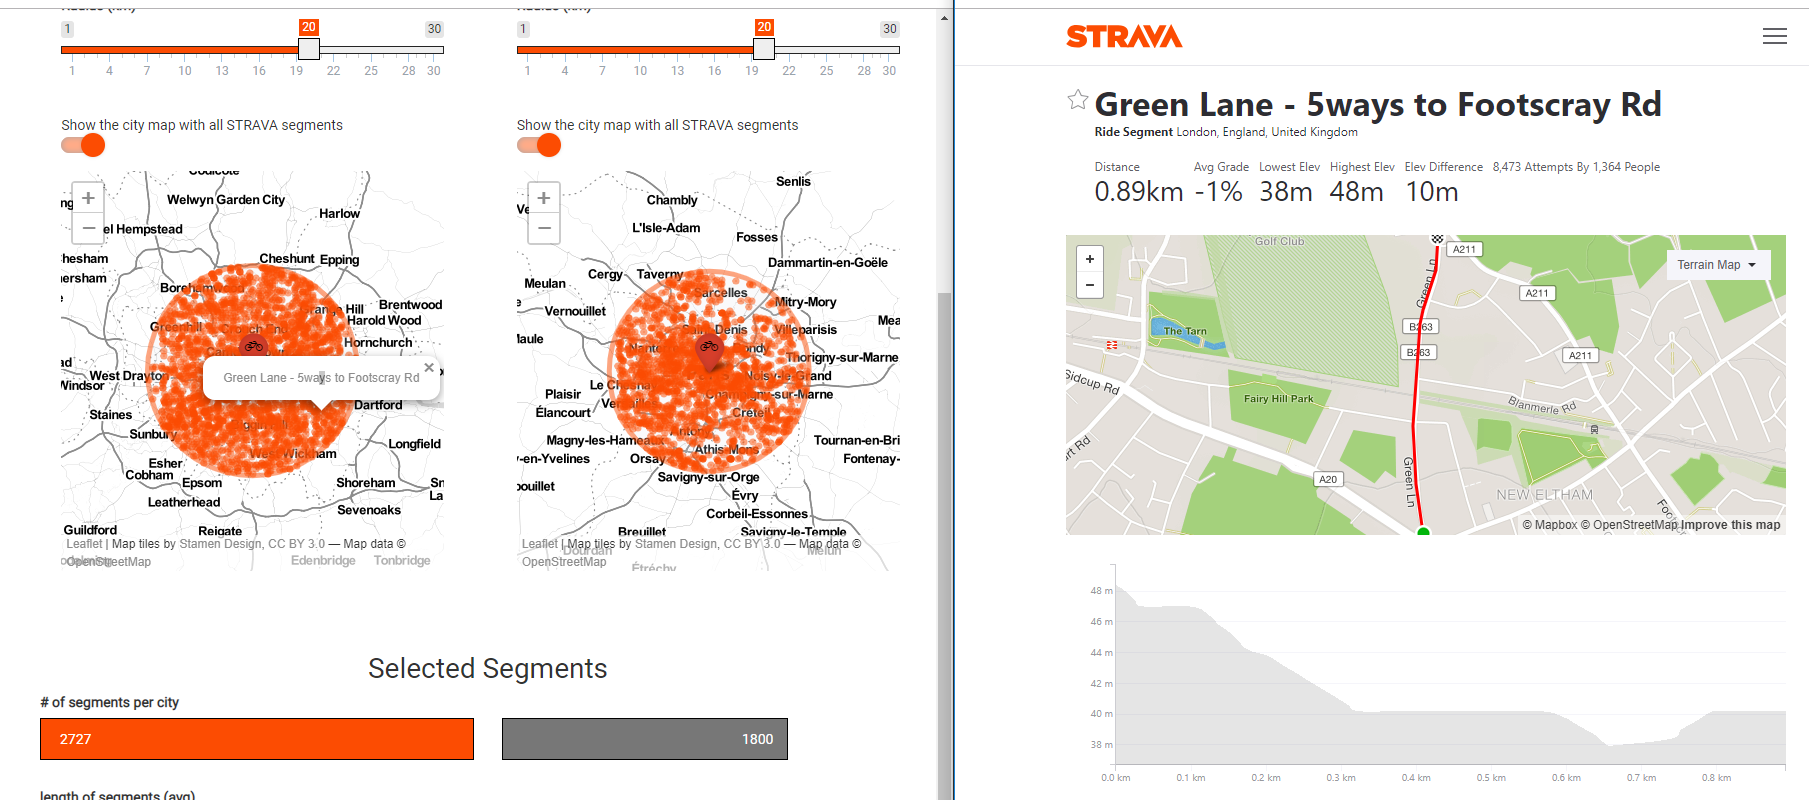
Every single segment on the map can be chosen and the leaderboard for the segment can be explored on STRAVA.
To show that there is a race going on, the app animates all bar charts. Meaning whenever you change the Race settings of two cities some bar charts will get updated as an animation. This function was implemented as a shiny output that can be reused in other apps, too. The Javascript behind allows even sending multiple bars inside a JSON to be rendered under each other and have a maximum length of the maximum of all bars.

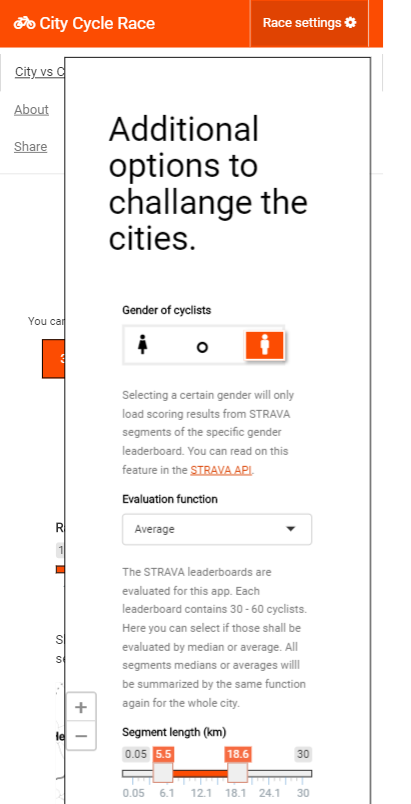
Just for the selection of the gender, I built an R-package to construct a candle-stick input. The package can be found under https://github.com/zappingseb/shinycandlestick.
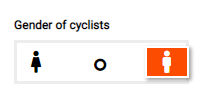
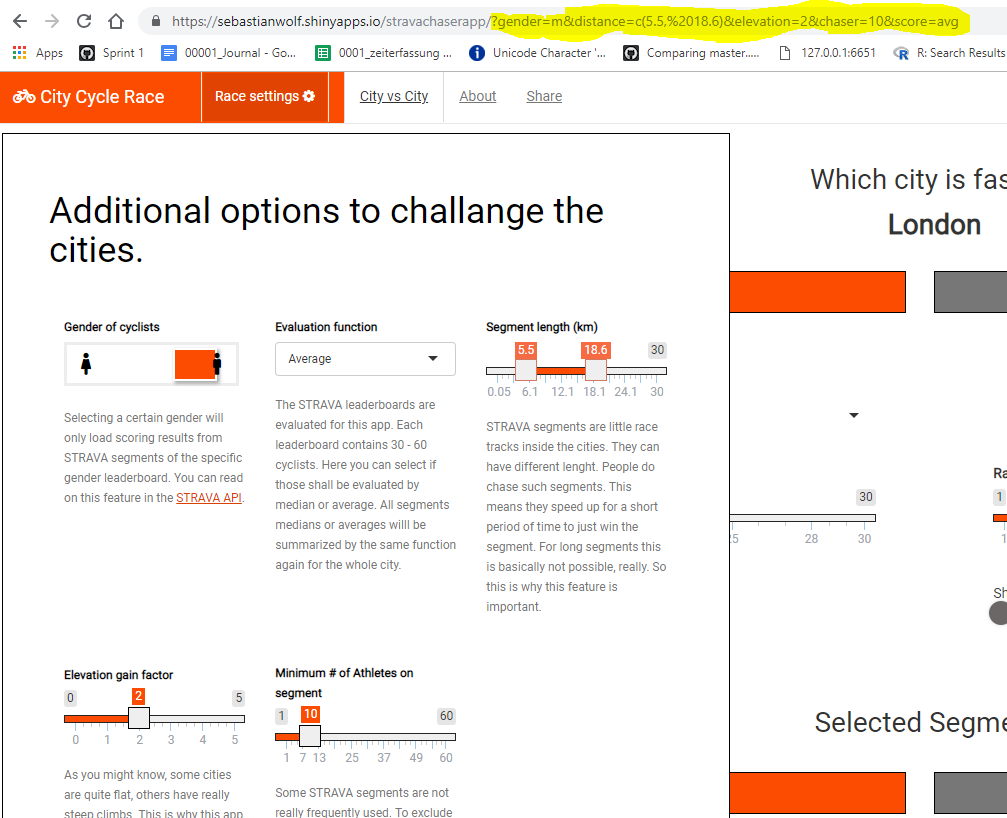
The data for the race can be filtered by several parameters. Gender of Cyclists, if the speed per segment shall be calculated by average or median, length of the segments, elevation calculations, and the number of athletes per segment.
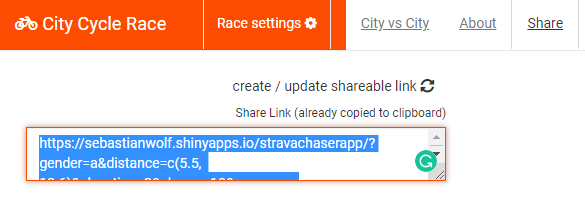
To allow storing and sharing those settings the users have a button to produce a link to the app including all their settings. If the app is called with those settings they will immediately be the default "Race Settings".
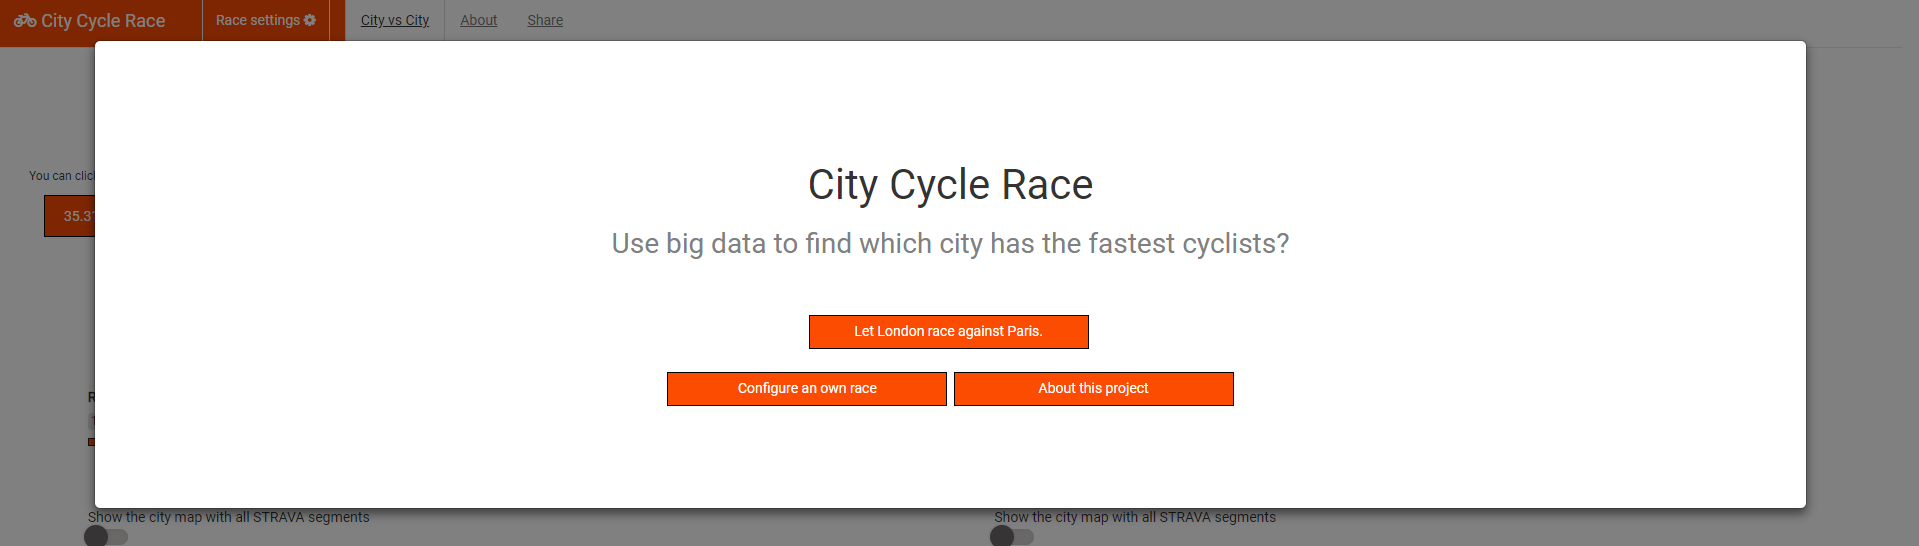
The Landing Page allows to automatically guide the user into the right place. If he wants to already change the setup of the app he/she can navigate to the "Race Settings" immediately.
The app was programmed in a fully responsive way. All features work on a mobile phone.
The whole app was packaged to have an easy way of sharing it with others. Another reason for packaging was the amount of javascript and css going into the app that should be shared. Also, the data needed for the app can be shared inside the R-package
CSS was used to modify most input elements, even standard shiny based input elements. The "Race Setting" button was taken from shinyWidgests::dropdownButton and also modified via CSS.
CSS helped a lot to make the app responsive and let the animated bars look the way they do.
I'm a huge fan of modularization. Actually, the map and the select input are rendered twice. So I thought these have to be modules. I wanted to keep the app itself really clean. the UI function has actually just 60 lines of code thanks to modularization. I wrote an article about why and how to modularize shiny on Medium. If you are interested to go through it.
I used a custom shiny input for the candlestick as described in these two tutorials:
