kurkle / chartjs-chart-treemap Goto Github PK
View Code? Open in Web Editor NEWChart.js module for creating treemap charts
License: MIT License
Chart.js module for creating treemap charts
License: MIT License

![dependabot[bot] avatar](https://avatars.githubusercontent.com/in/29110?v=4 "dependabot[bot]")


tree: [{value: 100, title: 'Alpha'}, {value: 20, title: 'Beta'}, {value: 5, title: 'Gamma'}],
Your current implementation its only show title.
I want to show both title and value in treemap how to do that? Also if the title has a long text it will not fit it UI so how to wrap that text?
I was having issues with my treemap not rendering properly and causing the other charts (that use datalabels) on the page to render incorrectly.
The problem was that chartjs-datalabels is not opt in, so you have to specify the following if you want to use a treemap w/o using the datalabels plugin :
plugins: { datalabels: { display : false }}
Leaving this here to help others who encounter this problem.
Hello
When i'm using Chart.bundle.min.js with chartjs-chart-treemap, i got an error of "x is not a function". You can reproduce that using the bundled version of Chartjs with chartjs-chart-treemap.
Versions:
Chart.js v2.7.2
chartjs-chart-treemap v0.2.3
See stacktrace:
Uncaught TypeError: x is not a function ([email protected] Line 7 Column 3673)
    at i.update ([email protected]:7)
    at i.reset (Chart.bundle.min.js:10)
    at Chart.bundle.min.js:10
    at Object.each (Chart.bundle.min.js:10)
    at t.update (Chart.bundle.min.js:10)
    at t.construct (Chart.bundle.min.js:10)
    at new t (Chart.bundle.min.js:10)
    at Object.success (overviewController.js:503)
    at i (jquery-3.2.1.min.js:2)
    at Object.fireWith [as resolveWith] (jquery-3.2.1.min.js:2)
I'd like to create an onclick listener for each square but this doesn't seem to work:
...
},
options: {
...
    onclick: function(event){
        console.log(event);
    }
...
I am able to add onclick listeners for other chart types, for example line charts. Is this supported and if not how can I add it? Thanks.
Hello,
The means of formatting labels are great, and they really help (both general settings and the formatter option). But I wonder if it's possible to format the tooltips as well
Hi,
Is there any way to format the label "group" of each rectangle? so if the label width is longer than the rectangle width then it should in truncate style (textwith ellipses).
Thanks

How show labels in your basic treemap with different color opacity like the image above?
The documentation states:
The treemap chart provides a method for displaying hierarchical data using nested rectangles.
Everything works fine with flat / single-depth data, but I am having trouble understanding how to make a hierarchical structure work.
I've studied the examples (sample/ directory) but they've not given me enough insight 😞
Simplified, the data I have is:
This should give a Treemap similar to this:
    +-------+------+-------+------+
    |  C1a  |      |              |
    +-------+  C2  |              |
    |  C1b  |      |              |
    +-------+------+      B       +
    |              |              |
    |       D      |              |
    |              |              |
    +-------+------+-------+------+
The only thing I have found is to keep adding groups:
[
  {"name": "A",   "l0": "/", "l1": "A", "l2":  "",  "l3":   "", "l4":    "", "value":  0},
  {"name": "B",   "l0": "/", "l1": "B", "l2":  "",  "l3":   "", "l4":    "", "value": 50},
  {"name": "C",   "l0": "/", "l1": "A", "l2": "C",  "l3":   "", "l4":    "", "value":  0},
  {"name": "C1",  "l0": "/", "l1": "A", "l2": "C",  "l3": "C1", "l4":    "", "value":  0},
  {"name": "C1a", "l0": "/", "l1": "A", "l2": "C",  "l3": "C1", "l4": "C1a", "value":  6.25},
  {"name": "C1b", "l0": "/", "l1": "A", "l2": "C",  "l3": "C1", "l4": "C1b", "value":  6.25},
  {"name": "C2",  "l0": "/", "l1": "A", "l2": "C",  "l3": "C2", "l4":    "", "value": 12.5},
  {"name": "D",   "l0": "/", "l1": "A", "l2": "D",  "l3":   "", "l4":    "", "value": 25}
]
But that looks like a hack to me, which would indicate that there is probably a better way to do this?
I've got a CodePen with what I have thus far: https://codepen.io/potherca/pen/qBVXmRz
Any help would be much appreciated!
Is there a way to have the treemap boxes drawn with rounded corners (borderRadius).
The ChartJS barChart has a borderRadius option (https://www.chartjs.org/docs/latest/charts/bar.html#borderradius).
It would give the treemap a nice modern look.
Thank you.
I'm having the following question. How can this be included in a React project as a component.
My problem is basically understanding how could I access the ctx (document.getElementById) from a React functional component. It is returning me null.
Screenshots / Sketches
This is my TreeMapChart.js file for reference.
const data = {
    labels: initialWords.map((d) => d.key),
    datasets: [
      {
        label: '',
        data: initialWords.map((d) => 10 + d.value * 10),
      },
    ],
  };
  const options = {
    title: {
      display: true,
      text: 'Chart.js Word Cloud',
    },
  };
  const ctx = document.getElementById('treemap').getContext('2d');
  const chart = new TreeMapChart(ctx, {
    data,
    options,
  });
  return (
    <div>
      <div>
        <canvas id='treemap'></canvas>
      </div>
      <chart />
    </div>
  );
Context
Additional context
g

I want to display the label along the value. right now only on hover values of a block is shown in tooltip. Is there any way to show label with value in chart .
Hi there apologies for this. I'm trying to integrate the package into an existing project which is causing errors.
To debug I am trying to run the package locally with npm link. Ahead of that I'm trying to run the test harness. I notice it fails in a few ways--it seems to be linting and the karma browser control (at first run at least). I'm not familiar with karma BTW. Also this is on Ubuntu.
The steps I've been using:
$ # git clone etc.
$ nvm use 18 # or 16 or 14
$ npm install
$ npm run build # or not
$ npm test
$ # many errors with eslint and karma + Chrome and Firefox--do I need to install something else here?
$ npm run lint # Same as above: lots of linting errors
I must be missing something. Any thoughts?
Chart is showing with single color (blue). Not showing with different gradients.
Please check your code in https://codepen.io/kurkle/full/JqbzgQ
backgroundColor: function(ctx) {
var value = ctx.dataset.data[ctx.dataIndex];
var alpha = (value + 3) / 10;
return Color('blue').alpha(alpha).rgbString();
}
variable alpha is NaN .
This function always returns the same RGB value rgb(0, 0, 255)
During the update, the controller is using some dataset options which are not leveraging on the treemap element (because not initialized), for the scriptable options.
At the moment, these properties are mainly used to calculate the space for the caption and can not be defined as callback.
I think these options should be consumed even if they are defined as scriptable options.
The context should slightly different form the data context and maybe a specific context object should be implemented.
The following are the options in scope:
| options |
|---|
dataset.spacing |
dataset.borderWidth |
dataset.borderRadius (probably, when PR #114 will be merged, needed to improve the sub-rect calculation) |
dataset.captions.font |
dataset.captions.padding |
Hello first at all, nice work adding this chart type, thank you.
Currently seems impossible to change color font on this example (https://codepen.io/kurkle/pen/oNjXJwe?editors=1010)
Using fontColor or font: { color: ...} it's the same, doesn't work.
To make it work i had to npm install --beta --save.
I tried this after founding this example (https://codepen.io/kurkle/pen/LYGdxpr?editors=1010) on one of your closed issue.
Now i'm trying to add also the value on the square but without success.
I also had trouble with tooltip because as default was giving me undefined: value instead of titleValue: value.
I had to use the code that is in the last link:
tooltips: { callbacks: { title: function (item, data) { return data.datasets[item[0].datasetIndex].key; }, label: function (item, data) { var dataset = data.datasets[item.datasetIndex]; var dataItem = dataset.data[item.index]; return dataItem.v; } } }
Thank you!
is there a way to change the color and position of text in groups.
https://codepen.io/NemeZZiZZ/pen/VwWpeLO
Actual result:
I got this picture with this data

[346062896.7285156, 4873.543108289924, 2.9610295422558437, 1.3633147804594135, 1.3417739862226647, 1,1, 1, 1, 1]
Expected result:
Several boxes, even if it small ones
Hello,
there is a way to transform dataset label after sorting but before rendering?
Something like formatter of chart-js-plugin-datalabes
https://chartjs-plugin-datalabels.netlify.app/guide/formatting.html#data-transformation
Thank you!
I want to edit the labels of my treemap, however I ca not do this because there is a default value which can not be deleted.
The value is the one that is written next to the key attribute. This issue happens on the version 1.0.0.2, I checked the version 0.0.23. and runs well
var topTags =[{
tag: "tag1", value: 123
}]
datasets:[{
tree: topsTags,
key: "value",
groups: ['Tag']
}]
For example, when area height is larger than area width, it would be better to rotate label vertically.
It would solve missing labels on small width area

It seems that the live examples link is not working. I've had the page opened for a couple hours and nothing and after peeking into dev tools console:
Could be backwards compatibility issues because you're using chartjs@next in the codepen example?
In my react file:
import {Chart as ChartJS} from 'chart.js';
import { Chart } from 'react-chartjs-2';
import {TreemapController, TreemapElement} from "chartjs-chart-treemap";


ChartJS.register(TreemapController, TreemapElement)
When attempting to register the TreemapController and TreemapElement in the 'react-chartjs-2' package, it leads to :
TypeError: Cannot read properties of undefined (reading 'prototype')
   9 |
  10 |
> 11 | ChartJS.register(TreemapController, TreemapElement)
  12 |
  13 | interface TreemapProps {
  14 |
I don't have any issues registering the built in controllers/elements from 'chart.js'
Has anyone else encountered this issue?
Hello,
Is chartjs-chart-treemap exportable with the infamous node wrapper chartjs-node-canvas?
Thanks
return Color('blue').alpha(alpha).rgbString();
I got an error from this line of code. Where to define that Color function. I am using Vue js and I using this chart by following imports
import Chart from "chart.js";
import "chartjs-chart-treemap";
new Chart(ctx, {})
Coverage is build again in Sonar job.
It can be transferred between jobs using actions/upload-artifact and actions/download-artifact
is it possible to add capability of packing circles (rather than rectangles) into the parent rectangle maintaining relative size and clustered around either the center or an arbitrary point?
Hi,
First, Thanks for writing this plugin.
I'm experiencing a bug where when I mouse over/hover over a particular block, in some parts of the block, the lower-level's info is also shown.
Example as gif:

(Source of code: https://codepen.io/kurkle/full/JqbzgQ)
When I mouse over CA block, I see not only CA, but also "West" and "Pacific" tooltip infos.
Is this because the info passed to the tooltip function needs more processing to differentiate between the levels? It's basically like the blocks are overlapping but the overlap is not visible. But this is not present in blocks where the size is relatively small.
The following PR in ChartJS makes the treemap plugin incompatible to the latest version.
Error: node_modules/chart.js/types/index.esm.d.ts:452:25 - error TS2536: Type '"metaExtensions"' cannot be used to index type 'ChartTypeRegistry[key]'.

452   { [key in ChartType]: ChartTypeRegistry[key]['metaExtensions'] }[TType]
Originally posted by LeifHenriksen November 16, 2021
Hi,
I noticed that when using version 1.0.2 that there is no building animation (the animation that plays when the graph spawns), in this code pen you can see it, if you change chartjs and chartjs-chart-treemap to the old version you get the animation back. https://codepen.io/leifhenriksen/pen/porxqar
The chart in the docs also has no animation : https://chartjs-chart-treemap.pages.dev/usage.html
So my question is, how do I enable the build animation?
Thank you
To me this looks like a regression of some kind.
I'm using chart.js 3.7.1 and chartjs-chart-treemap 2.0.2 in an vue project. The chart renders but when I hover it does not show the tooltip and fires errors in console. Sometimes it worked when the live-server reloaded code and when I've did the imports in main.ts and in the component itself.
chart.esm.js?9b4a:9037 Uncaught TypeError: Cannot read properties of undefined (reading 'call')
    at Tooltip._positionChanged (chart.esm.js?9b4a:9037:1)
    at Tooltip.handleEvent (chart.esm.js?9b4a:9007:1)
    at Object.afterEvent (chart.esm.js?9b4a:9077:1)
    at callback (helpers.segment.js?dd3d:92:1)
    at PluginService._notify (chart.esm.js?9b4a:4922:1)
    at PluginService.notify (chart.esm.js?9b4a:4909:1)
    at Chart.notifyPlugins (chart.esm.js?9b4a:6047:1)
    at Chart._eventHandler (chart.esm.js?9b4a:6074:1)
    at listener (chart.esm.js?9b4a:5952:1)
    at Chart.event (chart.esm.js?9b4a:3214:1)
the component looks like this
<template>
  <canvas ref="canvas" />
</template>

<script lang="ts">
import { Vue, Component, Ref } from "vue-property-decorator";
import { Chart } from "chart.js";
import { TreemapController, TreemapElement } from "chartjs-chart-treemap";
Chart.register(TreemapController, TreemapElement);

@Component
export default class TreemapChart extends Vue {
  @Ref("canvas") canvas!: HTMLCanvasElement;

  ctx2d = null as any;

  mounted(): void {
    this.ctx2d = this.canvas.getContext("2d");
    new Chart(this.ctx2d!, {
      type: "treemap",
      data: {
        datasets: [
          {
            label: "Basic treemap",
            tree: [15, 6, 6, 5, 4, 3, 2, 2],
            spacing: 0.1,
            borderWidth: 2,
            borderColor: "rgba(180,180,180, 0.15)",
          },
        ],
      },
      options: {
        responsive: true,
        maintainAspectRatio: false,
        plugins: {
          title: {
            display: true,
            text: "Basic treemap example",
          },
          legend: {
            display: false,
          },
        },
      },
    } as any);
  }
}
</script>
When the calculation to have the space for the captions for groups doesn't check if the borderWidth is configured as object.
chartjs-chart-treemap/src/controller.js
Line 40 in 200396b
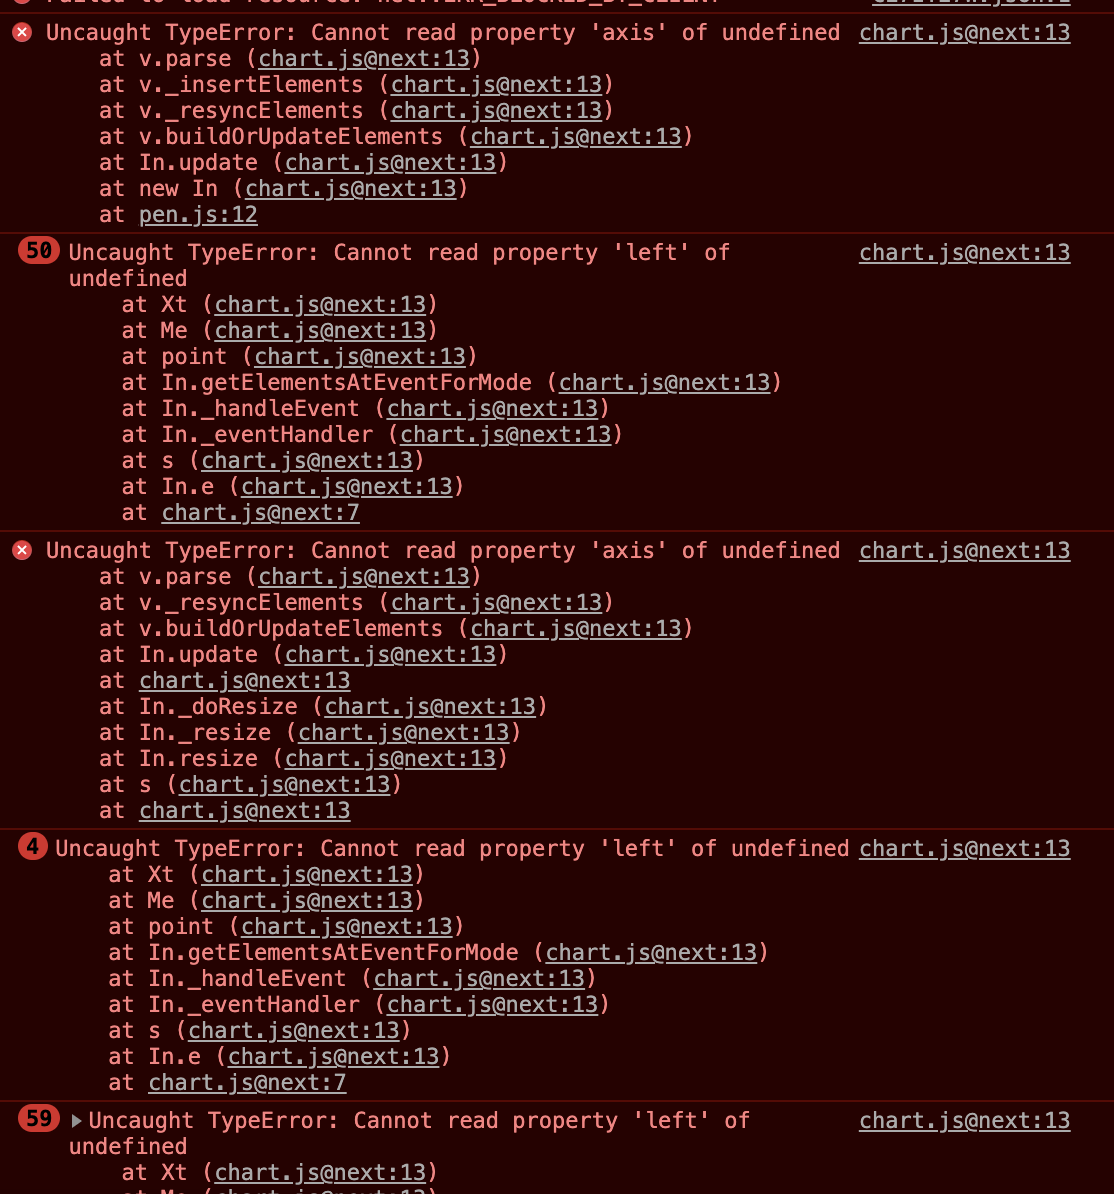
Hi there. This is the issue I was trying to debug in my local. The tests pass locally but still were throwing an error. So I've replicated it in this sandbox:
https://codesandbox.io/s/eloquent-bardeen-fyi1cv?file=/pages/index.vue
Can you see what's going wrong? Have I done something silly?
Hey @kurkle!
I came across an issue in the chartjs-chart-treemap, and I hope you can help me resolve it.
When using groups and non-zero spacing, and when one of the rectangle dimensions is less than the spacing value, child rectangles may overflow their parents.
I reproduced it across all versions between v1.0.0 and v2.0.1. It seems like the version v0.2.3 behaves correctly, hiding the rectangle that's too narrow to show.
If you need more context or any other help with this issue, please let me know. Thank you!
Codepen samples:
[email protected], [email protected]

[email protected], [email protected]

I have played with the treemap and got to this result:

But what I aim at is this:

Is is possible to modify the labels and set different sizes (maybe via a plugin?)
Also, labels currently do not wrap (unless we wrap them manually by using arrays). You think this is something we have to stick with or it would be possible to also automatically wrap them somehow?
Hi 👋
I'm using this library to visualize a coverage map for a project.
I'm mapping path folders to groups in order to have a hierarchical map, but folder nesting is not uniform, resulting in a weird result in the final map.
I've tried already to set thee missing group properties to '' or undefined but results were not as expected - lots of duplication.
It would be nice to natively support this kind of hierarchical grouping, or having a flag to enable it.
Example data:
[
  {
    folder: './src',
    component: null,
    subFolder: null,
    file: 'index.js'
  },
  {
    folder: './src',
    component: 'A',
    subFolder: null,
    file: 'A.js'
  }
  ...
]
From @kurkle #121 (comment)
buildData should be merged with element creation, and the available child rectangle calculation moved to element.
Something like
So actually quite much the same as the buildData, expect creating elements on the fly.
Use data option instead of tree one.
This would enable plugins like chartjs-plugin-zoom and chartjs-plugin-datalabels to work with treemap.
I am trying to use chartjs tree map plugin with react-chartjs-2 library (chartjs 3 version), the below is the pervious version usage of treemap
import React, { Component } from 'react'
import ChartComponent from 'react-chartjs-2';
import 'chartjs-chart-treemap';

export default class TreeMap extends React.Component {

    render() {
        return (
            <ChartComponent
                {...this.props}
                ref={ref => this.chartInstance = ref && ref.chartInstance}
                type='treemap'
            />
        );
    }
}
How to implement it in new version
This will reduce issues among browser when the chart will draw labels.
spriteText needs that the fillText is using a string. Unfortunately the default formatter is using numbers for values.
From #92 (comment)
Hi,
I defined the function plugins.tooltip.itemSort(i0, i1). But depending of the browser (firefox vs chromium based):
one have more info (like gs, etc...) in i0.raw.gs, the other in i0.raw._data.gs
The TypeScript types do not include TreemapController or TreemapElement, so I cannot import them into my TS project.
If Tooltip is not registered before TreemapController, the tooltip positioner is not registered.
chartjs-chart-treemap/src/controller.js
Lines 372 to 386 in 971f84b
Doing some tests for PR #106, I have seen the the label is not correctly positioned in the box.
See codepen: https://codepen.io/stockinail/pen/gOzmEvx
As you can see, there is a difference between the top and bottom free space, even if the position is set as center.
A nice feature to be considered is the possibility to express rect sizes with another property.
For instance, using the US states demo: area dimension property used for rect surface and the population property used as color.
From #45 (comment)
The current datasetIndex is always zero.
options: {
onClick: function (event, array) {
var active = window.treemap.getElementAtEvent(event);
console.log(active[0]._datasetIndex);
},
Thanks for the implementation!
It would be really helpful to have 'rtl' support for the tree map chart, not only for tooltips and legend.
Was trying to include chartjs-plugin-datalabels to the tree map, but it fails with the error:
chartjs-plugin-datalabels.js:155 Uncaught TypeError: Cannot read property 'x' of null at orient (chartjs-plugin-datalabels.js:155) at Object.rect [as positioner] (chartjs-plugin-datalabels.js:354) at coordinates (chartjs-plugin-datalabels.js:847) at Object.draw (chartjs-plugin-datalabels.js:1011) at Object.afterDatasetsDraw (chartjs-plugin-datalabels.js:1330) at Object.notify (Chart.js:7537) at Chart.drawDatasets (Chart.js:9422) at Chart.draw (Chart.js:9350) at Chart.render (Chart.js:9304) at Object.callback (Chart.js:1778)
chartjs-chart-treemap: 0.2.3
charts: 2.9.0
I was trying to implement treemap with chartjs-node-canvas
and I get this error
```
"canvas": "^2.1.0",
"chart.js": "^2.7.2",
"chartjs-chart-treemap": "^0.2.2",
"chartjs-node-canvas": "^2.0.0",
`TypeError: Cannot read property 'hidden' of null
errorHandler.js:14
message:"Cannot read property 'hidden' of null"
stack:"TypeError: Cannot read property 'hidden' of null\n at updateMinMax (d:\Probench\ChartServices\node_modules\chart.js\dist\Chart.js:12964:60)\n at ChartElement.determineDataLimits (d:\Probench\ChartServices\node_modules\chart.js\dist\Chart.js:13001:5)\n at ChartElement.update (d:\Probench\ChartServices\node_modules\chart.js\dist\Chart.js:11502:6)\n at fitBoxes (d:\Probench\ChartServices\node_modules\chart.js\dist\Chart.js:7127:7)\n at Object.update (d:\Probench\ChartServices\node_modules\chart.js\dist\Chart.js:7338:3)\n at Chart.updateLayout (d:\Probench\ChartServices\node_modules\chart.js\dist\Chart.js:9680:16)\n at Chart.update (d:\Probench\ChartServices\node_modules\chart.js\dist\Chart.js:9633:6)\n at Chart.construct (d:\Probench\ChartServices\node_modules\chart.js\dist\Chart.js:9357:6)\n at new Chart (d:\Probench\ChartServices\node_modules\chart.js\dist\Chart.js:9294:7)\n at CanvasRenderService.renderChart (d:\Probench\ChartServices\node_modules\chartjs-node-canvas\dist\index.js:150:16)...`
The chart is not working in IE11. Version 0.2.3
A declarative, efficient, and flexible JavaScript library for building user interfaces.
🖖 Vue.js is a progressive, incrementally-adoptable JavaScript framework for building UI on the web.
TypeScript is a superset of JavaScript that compiles to clean JavaScript output.
An Open Source Machine Learning Framework for Everyone
The Web framework for perfectionists with deadlines.
A PHP framework for web artisans
Bring data to life with SVG, Canvas and HTML. 📊📈🎉
JavaScript (JS) is a lightweight interpreted programming language with first-class functions.
Some thing interesting about web. New door for the world.
A server is a program made to process requests and deliver data to clients.
Machine learning is a way of modeling and interpreting data that allows a piece of software to respond intelligently.
Some thing interesting about visualization, use data art
Some thing interesting about game, make everyone happy.
We are working to build community through open source technology. NB: members must have two-factor auth.
Open source projects and samples from Microsoft.
Google ❤️ Open Source for everyone.
Alibaba Open Source for everyone
Data-Driven Documents codes.
China tencent open source team.