This is a package to integrate PHP Debug Bar with TYPO3. It uses several hooks to include the assets and itself into frontend output. It bootstraps some Collectors to work with TYPO3 and implements a couple custom DataCollectors, specific for TYPO3.
Read the documentation for more configuration options.
Info: Use the DebugBar only in development. It can slow the application down (because it has to gather data). So when experiencing slowness, try disabling some of the collectors.
The extension comes with the default collectors:
- PhpInfoCollector: Show the PHP version
- MessagesCollector: Collects messages from within the Application and pushing them to the DebugBar
- TimeDataCollector: Here you can start and stop a timer. Default it times the Application. More in the Usage section
- MemoryCollector: Show the Memory usage
- ExceptionsCollector: Collects exceptions from withing the Application and pushing them to the DebugBar
And includes some custom collectors:
- InfoCollector: Show the same information like the Info pane of the Admin Panel
- MySqliCollector: Show all queries, including timing and the values of prepared statements
- Typo3Collector: Show the TYPO3 version, Locale and Environment
- AuthCollector: Show the username of the logged-in backend user
- SessionCollector: Show session data
Require this package with composer. It is recommended to only require the package for development.
composer require konafets/typo3_debugbar --devAfterwards you need to activate the extension in the Extension Manager. The DebugBar is enabled by default and will be displayed to you if you are logged into the backend as an administrator.
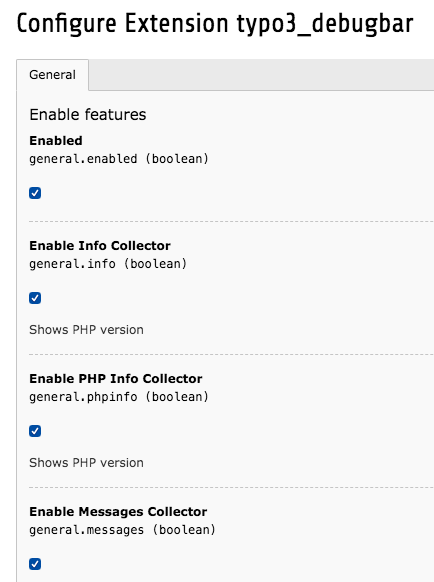
The extension is configurable through the Extension Manager. There you can enable/disable the DebugBar as well as the DataCollectors.
The Typo3DebugBar implements the SingletonInterface, therefore you can get the same instance via debugbar(). This opens the possibility to interact with the DebugBar from within TYPO3.
try {
    throw new Exception('foobar');
} catch (Exception $e) {
    debugBar()->addThrowable($e);
}
These will be shown in the Exception pane.
debugBar()->info($object);
debugBar()->error('Error!');
debugBar()->warning('Watch out…');
debugBar()->addMessage('Another message', 'mylabel');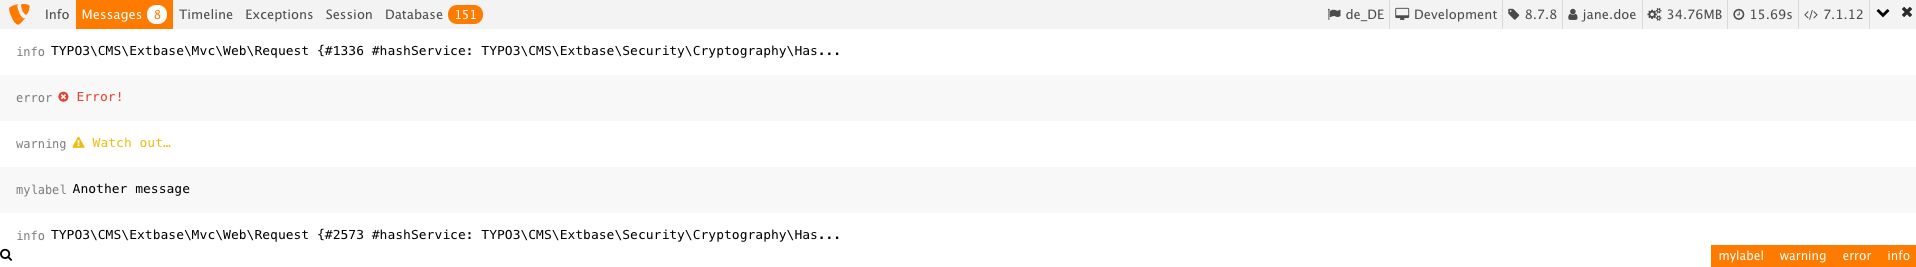
And start/stop timing:
debugBar()->startMeasure('render', 'Time for rendering');
debugBar()->stopMeasure('render');
debugBar()->addMeasure('now', TYPO3_START, microtime(true));
debugBar()->measure('My long operation', function() {
    // Do something…
});
debugbar_debug($value);
or even shorter:
startMeasure('render', 'Time for rendering');
stopMeasure('render');
addMeasure('now', TYPO3_START, microtime(true));
measure('My long operation', function() {
    // Do something…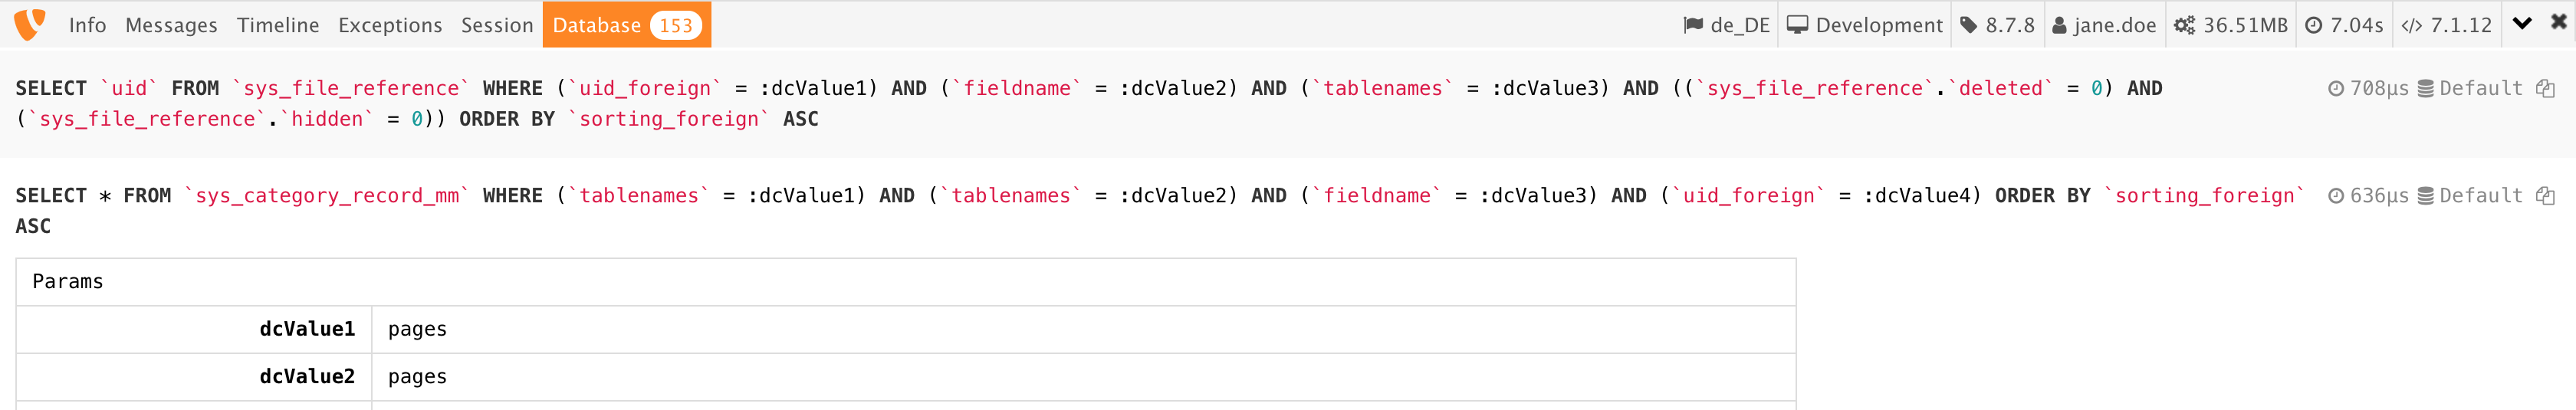
});This pane shows all issued queries of the connection with the name Default. Is there is no connection with this name, the first connection of the ConnectionPool will be used.
Per default, the statements were shown as Prepared Statements, meaning the placeholders are inside the statement while the actual values are in a hidden table below each statement. To see them, click on the statement.
To render the values directly inside the statements, activate the option with_params in the extension settings.
Info: The extension uses the connectToDB hook to inject Doctrine\DBAL\Logging\DebugStack as a logger to the connection. At the end of the rendering process it retrieves the Logger and shows the logged queries. Its important to understand, that the extension adds Doctrine\DBAL\Logging\DebugStack in any case, even if its not shown in the frontend. This is due to log all queries from the very beginning ... but at that point the BE User is not initialized yet and its unclear if the DebugBar is enabled or not. Classical Chicken-and-egg problem.
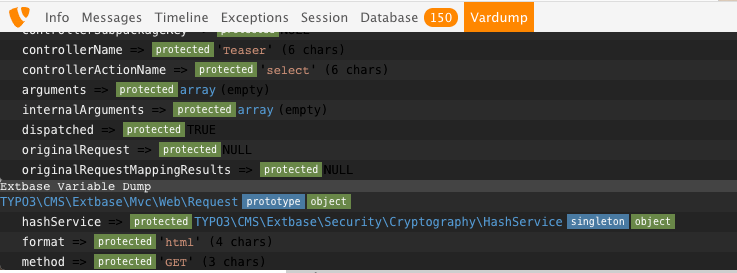
Everybody knows the output of DebugUtility::var_dump() ... and everybody knows that it breaks the layout. Lets move the output to the TYPO3 Debugbar. Use Konafets\Typo3Debugbar\Overrides\DebuggerUtility::var_dump($variable) and get an output like this:
As mentioned above the extension uses hooks. The following figure shows the usage during a request life cycle.

The extension is heavily inspired by the Laravel Debugbar. Thanks for your good work Barry vd. Heuvel. I also copied the idea of a ServiceProvider from Laravel.