Git Product home page Git Product logo

r-spatial-autocorrelation-analytics's Introduction

Variograms & Kriging Workflow

1. Load in SF Points & SF Study Area

ca_cnty  = st_read(here("data", "CA", "CA_Counties", "CA_Counties_TIGER2016.shp"))
ca_ozone = st_read(here("data","CA", "CA_ozone_2017.GPKG"))
ca_ozone = st_transform(ca_ozone, st_crs(ca_cnty))
st_crs(ca_ozone) == st_crs(ca_cnty)

2. Utilize the vgm_krige_analysis() function

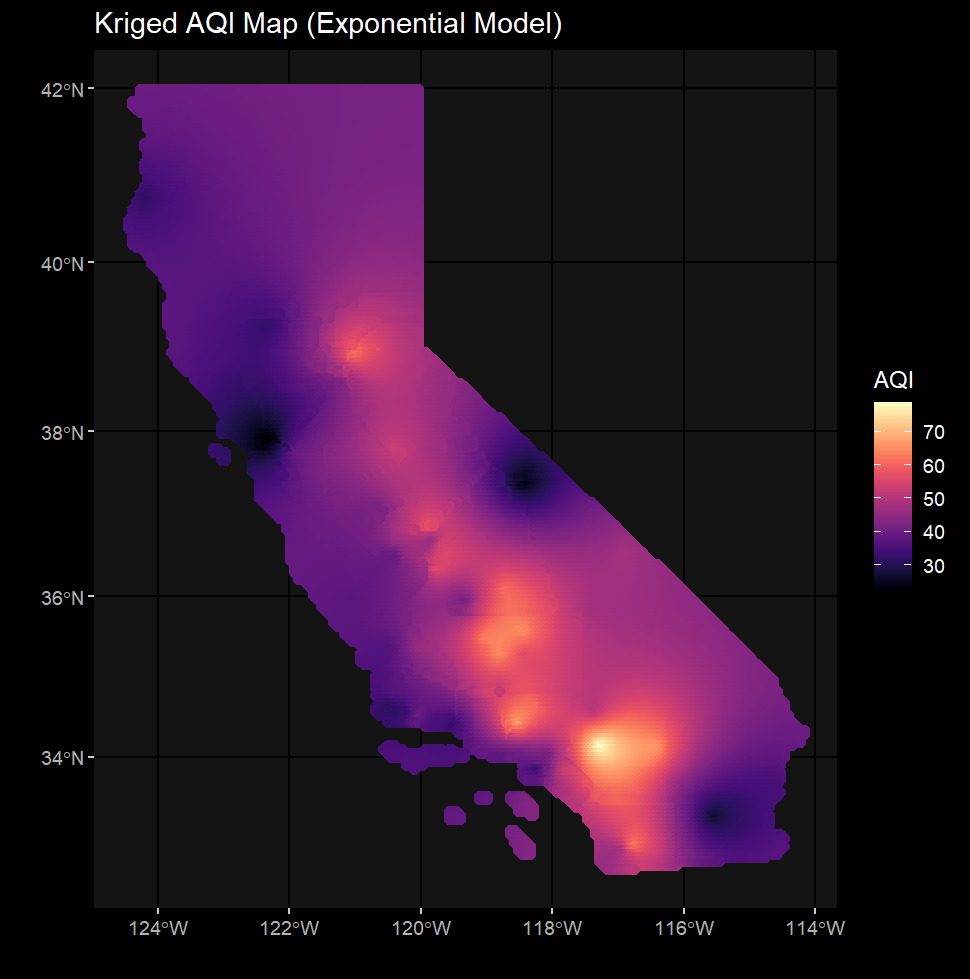
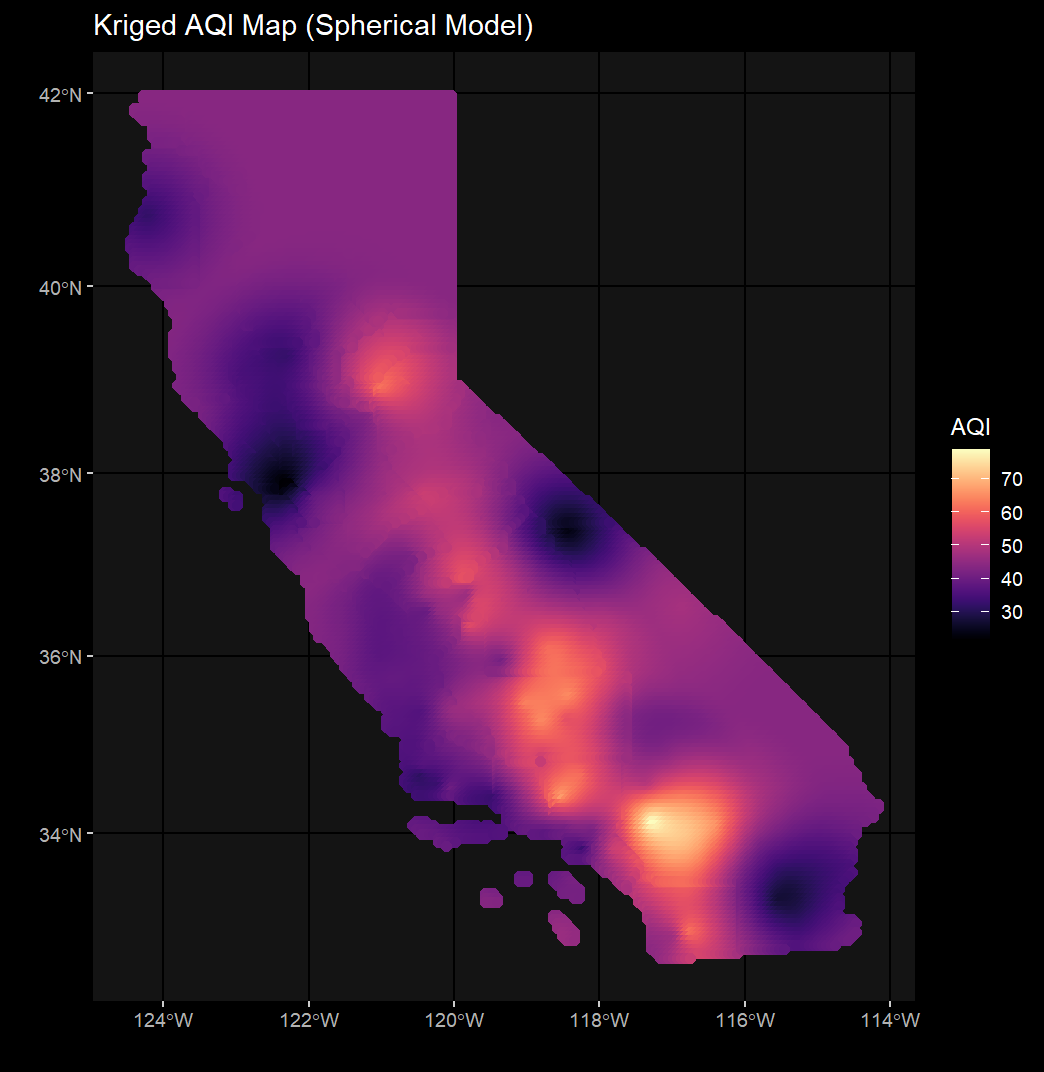
This custom function wraps together all the essential components to generate a krige. You can specify your study area, points, and nugget/range for your krige here.

vgm_krige_results = vgm_krige_analysis(study_area_sf = ca_cnty, 
                                       points_sf = ca_ozone, 
                                       variable_name = "AQI")

3-4. Extract Variograms & Kriged Outputs for Plotting

KrigeEXP KrigeSPH

Correlogram Workflow

0. Load in dependency custom function from Correlogram_Function.R

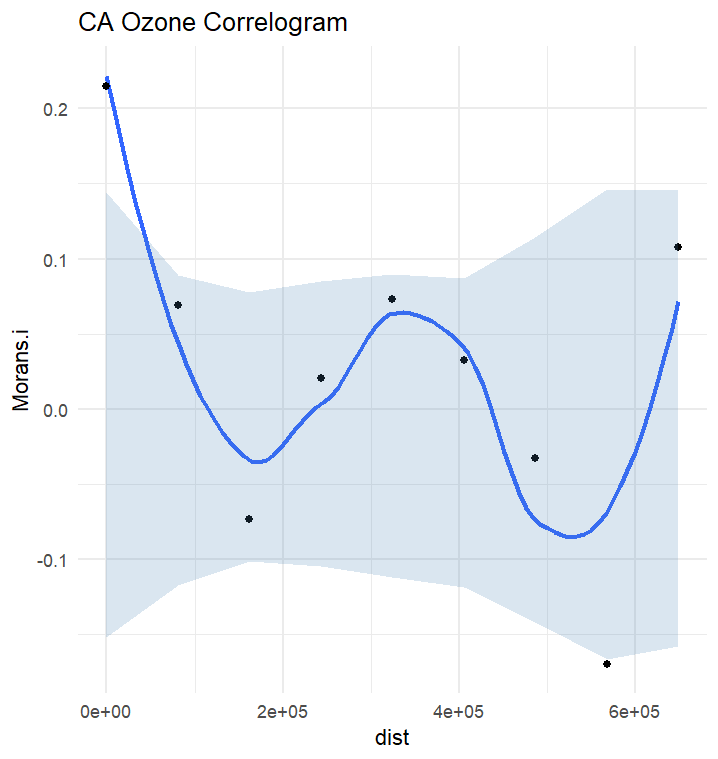
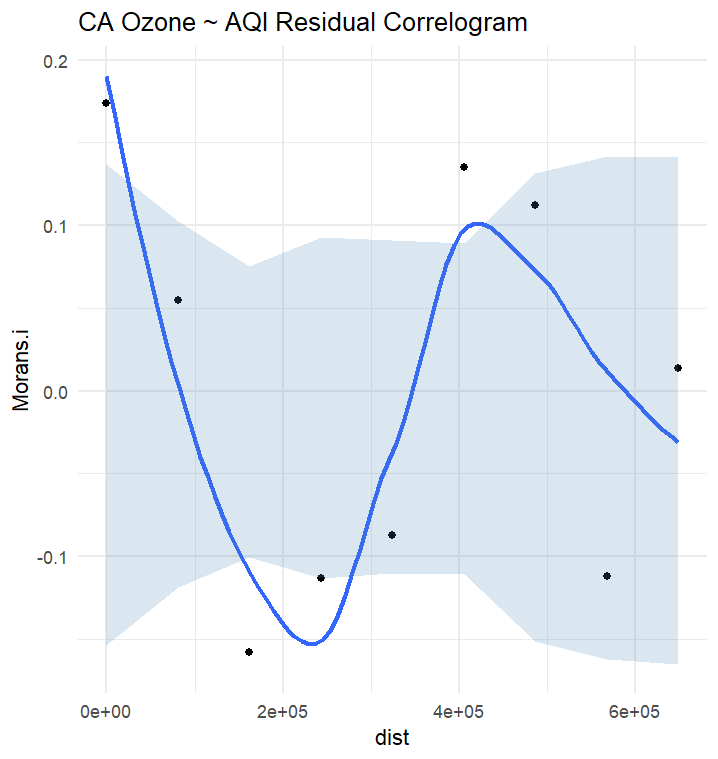
Correlogram_Function.R contains the calculate_morans_i() custom function which loops through unique distance classes and calculates Moran's I at those distances. Confidence intervals are additionally calculated in order to generate an envelope and determine the presence/abscence of autocorrelation in our data.

source("path/to/Correlogram_Function.R")

1. Load in SF Points & SF Study Area

ca_cnty  = st_read(here("data", "CA", "CA_Counties", "CA_Counties_TIGER2016.shp"))
ca_ozone = st_read(here("data","CA", "CA_ozone_2017.GPKG"))
ca_ozone = st_transform(ca_ozone, st_crs(ca_cnty))
st_crs(ca_ozone) == st_crs(ca_cnty)

2. Create & Inspect a Linear Model for our data

# 2.1: Create your linear model with lm()
aqi_lm = lm(ozone ~ AQI, data = ca_ozone)

# 2.2: Inspect the residuals by looking at the fitted residuals & QQPlot
par(mfrow = c(1,2))
plot(aqi_lm, which = 1)
plot(aqi_lm, which = 2)

# 2.3: Extract residuals to ca_ozone from the model fit!
ca_ozone$resids = residuals(aqi_lm)

3. Run correlogram_calculator() custom function

ozone_correlogram_results = correlogram_calculator(ca_ozone, variable_name = "ozone")
resid_correlogram_results = correlogram_calculator(ca_ozone, variable_name = "resids")
4. Plot Correlograms for your variable of interest & residuals!

Correlog ResidCorrelog

r-spatial-autocorrelation-analytics's People

Contributors

jtsalah avatar

Watchers

 avatar

Recommend Projects

  • React photo React

    A declarative, efficient, and flexible JavaScript library for building user interfaces.

  • Vue.js photo Vue.js

    ๐Ÿ–– Vue.js is a progressive, incrementally-adoptable JavaScript framework for building UI on the web.

  • Typescript photo Typescript

    TypeScript is a superset of JavaScript that compiles to clean JavaScript output.

  • TensorFlow photo TensorFlow

    An Open Source Machine Learning Framework for Everyone

  • Django photo Django

    The Web framework for perfectionists with deadlines.

  • D3 photo D3

    Bring data to life with SVG, Canvas and HTML. ๐Ÿ“Š๐Ÿ“ˆ๐ŸŽ‰

Recommend Topics

  • javascript

    JavaScript (JS) is a lightweight interpreted programming language with first-class functions.

  • web

    Some thing interesting about web. New door for the world.

  • server

    A server is a program made to process requests and deliver data to clients.

  • Machine learning

    Machine learning is a way of modeling and interpreting data that allows a piece of software to respond intelligently.

  • Game

    Some thing interesting about game, make everyone happy.

Recommend Org

  • Facebook photo Facebook

    We are working to build community through open source technology. NB: members must have two-factor auth.

  • Microsoft photo Microsoft

    Open source projects and samples from Microsoft.

  • Google photo Google

    Google โค๏ธ Open Source for everyone.

  • D3 photo D3

    Data-Driven Documents codes.